68
Research Paper on Performance Evaluation &
Capacity Estimation for Selected Undisciplined
Intersections in Gurgaon City
Neelam
1, Mr. Nirmal Dhir
21
Master of Technology in Civil Engineering (Transportation Engg.), from World College of Technology and Management, Gurgaon
2
Professor & HOD, Civil Engineering (Transportation Engg.), from World College of Technology and Management, Gurgaon
ABSTRACT
In India carry different types of vehicles like high speed automobiles, low speed cycles, cycle rickshaws and animal drawn carts. This will lead to complex interaction between the vehicles and study of such traffic behaviour needs special attention. This will result in increased interactions between vehicles; then they tend to move in clusters rather than one after the other. Traffic consists on Indian roads of bi-directional freedom traffic such as two or three wheeled vehicles and uni-directional vehicles such as four wheelers while the above tends to overtake or turning or crossing or turn right even if a small gap is available. Hence, to determine the intersection capacity traffic engineer requires a clear understanding of gaps being accepted or rejected by various modes of traffic. Besides, in these mixed traffic conditions, users do not usually follow lane discipline and can occupy any lateral position on the road. To prevent traffic accidents, conflicting traffic streams are separated either in space or in time. Due to the increasing population of India, there is a growth in transportation demand, which results in increase in vehicular movement and hence increase in vehicular volume on roads. This increase in vehicular volume affects the level of service (Q, K & V) and safety of road especially at critical locations like intersection of two roads where vehicles moving in different directions compete for the use of same space.
INTRODUCTION
The rapid development in India has brought an increase to the cost of living of the citizen. It influenced the travel pattern of the community from their origin to any destination. The development also affects the transportation system as shown by the annual increase in the No. of vehicles on Roads.
Everybody travels whether it is to be work, play shop or do business. All raw materials must be conveyed from the land to the place of manufacturing or usage, and all goods must be moved from factory to the market place and from the staff to the customer. Transport is the means by which those activities occur; it is the cement that binds the together the communities and their activities. Meeting these needs has been, and continues to be, the transport task. How people live and work has changed as a consequence of improvements in life style and in transport capabilities. What can be said with certainty about the future is that these interactive changes will continue, and that it will be the task of the transport planner and traffic engineer to cope with them.
In India carry different types of vehicles like high speed automobiles, low speed cycles, cycle rickshaws and animal drawn carts.
69 one after the other. The vehicles entering the rotary are gently forced to move in a clockwise direction in orderly fashion. Rotary intersections are an effective intersection type which is also called as Roundabout which is provided for easier decision making than conventional intersections. These rotary intersections have a traffic calming effect by reducing vehicle speeds using geometric design. Rotaries require less maintenance than traffic signals. A well designed roundabout achieves a balance of safety and efficiency.
Traffic consists on Indian roads of bi-directional freedom traffic such as two or three wheeled vehicles and uni-directional vehicles such as four wheelers while the above tends to overtake or turning or crossing or turn right even if a small gap is available. Hence, to determine the intersection capacity traffic engineer requires a clear understanding of gaps being accepted or rejected by various modes of traffic. Besides, in these mixed traffic conditions, users do not usually follow lane discipline and can occupy any lateral position on the road. Traffic rotaries reduce the complexity of crossing traffic by forcing them into weaving operations. The shape and size of the rotary are determined by the traffic volume and share of turning movements. Capacity assessment of a rotary is done by analyzing the section having the greatest proportion of weaving traffic. In the past years various models have been developed for analyzing the traffic flow on this intersection. These methods are classified in two groups. The first group consists of methods which are purely empirical and based on geometry of intersection. The second group consists of methods which are based on Gap acceptance process. To prevent traffic accidents, conflicting traffic streams are separated either in space or in time. Due to the increasing population of India, there is a growth in transportation demand, which results in increase in vehicular movement and hence increase in vehicular volume on roads. This increase in vehicular volume affects the level of service (Q, K & V) and safety of road especially at critical locations like intersection of two roads where vehicles moving in different directions compete for the use of same space.
In India intersections are comparatively more critical as the traffic composition is basically of heterogeneous nature. All metropolitan cities have busy urban streets, especially during peak period of the day, and the intersection on these streets become the major place of conflicts to the smooth flow of vehicles. The capacity of intersections further gets reduced due to the presence of other road side commercial and social activities. For the purpose of providing solution it is required to provide the intersection with proper mechanism, which can reduce the conflicts, delays, and enhance safety. This mechanism can be in the form of signal system, flyover or roundabout depending on the magnitude of the traffic flow.Flyovers or grade separated intersections can also prove to be appropriate in conditions where flow is high in both the directions but restricting the change in direction is a point of concern here which again needs to be addressed.
Under many traffic conditions, an unsignalised roundabout may operate with less delay to users than traffic signal control or all-way stop control. Unlike all-way stop intersections, a roundabout does not require a complete stop by all entering vehicles, which reduces both individual delay and delays resulting from vehicle queues and hence capacity of intersection can be enhanced. A roundabout may also operate much more efficiently than a signalized junction because drivers are able to proceed when traffic is clear without the delay incurred while waiting for the traffic signal to change. These advantages also reduce air pollution from many idling vehicles waiting for traffic lights to change.
DATA ANALYSIS & METHODOLOGY
The present study is been conducted in Gurgaon, Haryana and the Intersection selected for the study is IFFCO Chowk
Overview of Gurgaon
70 Fig. 1: Gurgaon in Map
The major highway that links Gurgaon is National Highway 8, the road runs from Delhi to Mumbai. Developed expressway is expanded to six lanes. Public transit in Gurgaon is mostly provided by government buses, Rapid Metro, Delhi Metro, Private buses, and vans, and shared auto rickshaws also ply in the city.
The transportation system in Gurgaon is very poor. During peak hours at morning huge rush we can see coming from Delhi to Gurgaon and at evening huge rush we can see going towards Delhi from Gurgaon. The city lacks facilities for pedestrians with almost no proper sidewalks. There are no proper routes for bicycles, though a large part of the population in the city use bicycles for commuting. With no designated bicycle lanes in Gurgaon, riding it can be dangerous due to uncontrolled driving of cars and lack of infrastructure.
71 Selection of Roundabout
The criteria for selection of the intersection for the study are:
The intersection should be four legged with sufficient traffic flow. Percentage of non-motorized vehicle should be low.
The approach lane should be straight and hence there should be no curves present on either of
approaching arms.
The road surface should be even and uniform so as to ensure that the traffic approaching the
intersection should not be forced to reduce the speed due to bad surface condition. There should be no effect of gradient on any side of the approach.
Sufficient weaving length should be available on all of the approach and traffic movement should
be equally proportioned in all the direction.
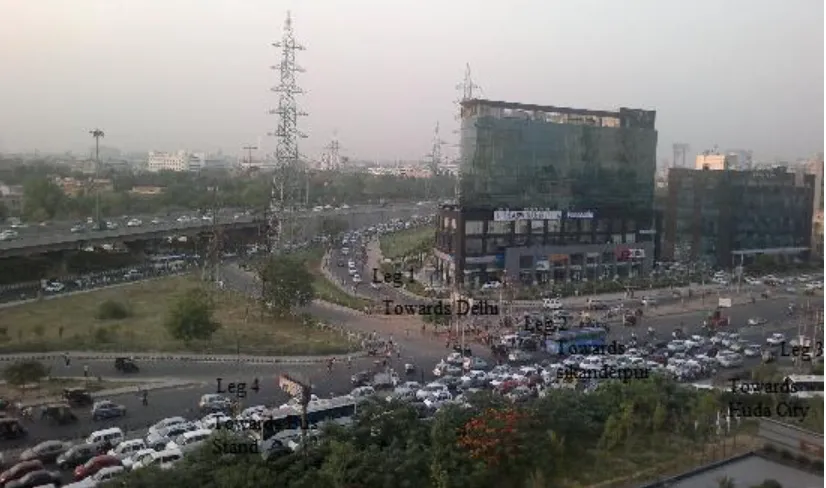
Various intersections were visited for pilot survey in Gurgaon city and Videography at those intersections was carried out for 10 minutes during the peak hours from a high rise building near IFFCO Chowk.
Fig. 3: View of IFFCO Chowk through video recording.
Speed analysis using Performance box
Performance Box is a high performance which measures Speed, Position, Acceleration and Heading ten times a second. It is equipped with an MMC/SD Flash memory card socket. This allows 10Hz logging of Time, Distance, Speed, Position, and Split Times etc. Data logged to the MMC flash card can be analyzed in detail using the PC software provided [10].
72 Using the supplied software and an SD flash card, the speed/time/distance/acceleration data from Performance Box via USB can be analyzed. Another very powerful feature is the ability to export your Performance Box position files to Google Earth, generating vehicle's path onto a satellite image of the area. This data can be used to study the performance of the vehicle in the study stretch and also to analyze the stretch for its speed reducing location.
Performance box was used to analyze the vehicle trajectory and the speed profile at various locations in the intersection. Since the traffic composes of 2W with maximum numbers, the performance box was used at the intersection using 2W as the test vehicle. The test vehicle was made to run on the intersection in peak duration in and out of all the approaches for 3 numbers of trails. The data thus obtained was transformed so as to show the speed values of test vehicle at every 10 meter distance on the intersection.
RESULTS AND DISCUSSIONS
The value of accepted gap is not constant. It differs from driver to driver and vehicle to vehicle at every particular situation. The critical gap as per various definitions will change with the values of accepted and rejected gap. Hence determining the critical gap itself is a point of concern. Various methodologies and concept have been put up in recent past by various researchers worldwide for determining the critical gap. However, the condition in which they have been derived and used so far is different from the Indian traffic condition since we have heterogeneous traffic condition. Few of those methods have been used for the study area and the results are observed as under.
Harder’s Method
This is a simple method based on the values of Gap. The drivers are assumed to be consistent so as to simplify the method. A consistent driver is assumed to behave or react in the same way in different situations. For determining the critical gap using this method, all Gaps were measured using the frames generated by the videos recorded for the study area. The acceptance and rejection of the gaps has been noted and the time scale is divided into segments of 1 second. The number of observed and accepted Gaps at every interval of 1 second is observed. The ratio of observed and accepted gap for the particular segment is estimated as ai. If the assumption is made that the proportion of drivers who accept a gap of size t seconds is identical to the probability that a driver has critical gap value smaller than t [22], then,
Pa, Gap= Fc(t)
And if ti is the time at the centre of interval i, then
Fc (ti) = ai
This is an approximation of the cumulative distribution function of critical gaps. The mean critical gap is then given
as tc=∑W
ti.[Fc(ti)-Fc(ti-1)
Where, W is the number of intervals of 1 second.
The data for the accepted and rejected Gaps for the study area was utilised to determine the value of critical gap by dividing the segments at an interval of 1 second. The number of observed and rejected Gaps and the calculation of critical gap is shown as under.
Table 1: Calculation for Harder’s Method for Critical Gap
Time (Sec) Accepted Gaps
Rejected Gaps Observed Gaps ai Fc(ti)-Fc(ti-1)
0-1 23 61 84 3.65 ---
1-2 103 35 138 1.33 2.32
2-3 86 5 91 1.06 0.27
3-4 55 0 55 1 0.06
73 Using the equation stated above, the value of tc is calculated as 1.295 seconds. Brilonet.al. has noted that for practical applications this method has some drawbacks. For the method, in each interval i, a sufficiently large sample should be available and for this, longer observation period is required. Another disadvantage noted is that it only considers the condition where no queuing occurs. An additional problem could be that the critical values can be systematically different from that for the gaps. As a result of all these points, the Lag method is not used in practice.
Raff’s Method
If an observation is made on a driver of Minor Street and his gap acceptance and rejection decisions, it can be stated that his tc is greater than the maximum rejected gap and tc is smaller than the gap he accepts. This statement can be done with an assumption that the driver is consistent. If we observe a series of accepted gaps, ta, then these accepted gaps may be described by an empirical statistical distribution function Fa(t). Similarly the distribution of rejected gaps, Fr(t) can be observed. Raff‟s definition of critical gap states that it is that value of t at which the function [1- Fr(t)] and [Fa(t)] intercept. The data of accepted and rejected gaps for the study area was used for this method and the results are plotted as below for the combined value of accepted and rejected gaps for all types of vehicles.
Fig. 4: Raff’s Method for Combined Values of Accepted and Rejected Gap
The value of rejected gap ranges between zero to 2.8 seconds and the value of accepted gap ranges between 0.7 second and 4 seconds. Also from the chart, it can be observed that after considering all the types of vehicles in the data obtained, the value of critical gap is found to be 1.4 seconds combined for all the vehicle types. To study the classified behavior of vehicles, the accepted and rejected gap by a particular type of vehicle is also found. The critical gap value for cars as a subject vehicle is shown in the chart below
Fig. 5: Raff’s Method for Car as subject Vehicle 0 20 40 60 80 100 120
0 0.2 0.4 0.6 0.8 1 1.2 1.4 1.6 1.8 2 2.2 2.4 2.6 2.8 3 3.2 3.4 3.6 3.8 4 4.2
C u m u lati v e F r e q u e n c y
Gap in Seconds
0 20 40 60 80 100 120
0 0.20.40.60.8 1 1.21.41.61.8 2 2.22.42.62.8 3 3.23.43.63.8 4 4.24.44.64.8 5
Cu mu la ti ve Fr e q u en cy
74 The accepted gap values for only 4-wheelers as subject vehicle is ranging from 1.3 seconds to 4.4 seconds and the gaps smaller than 14 seconds is been rejected. This upper range for accepted gap may be due to the size of the vehicle as seen in 3-wheelers. But the value of critical gap for 4-wheeler is less as compared to 3-wheelers and is found to be 1.425 seconds. This may be due to the acceleration rate of 4-wheeler prompting the drivers to accept the comparatively lower gaps.
CONCLUSIONS
The traffic situation in India has few exclusive features when compared with the traffic in developed countries. Out of various points, one significant basis is the share of categories of vehicles. Indian traffic has almost 60 to 80 percent of vehicles in traffic flow is two-wheeler. From the classified volume count also it can be observed that the proportion of two wheeler in total traffic using the intersection, ranges from 65% to 70%.
Since the traffic condition in India is heterogeneous, a well-defined methodology for data extraction was required. The study presents various methodologies for extracting the data for Gap (Accepted and Rejected), Lag time and Follow up time. These methodologies take into account the condition of typical Indian traffic and decision making by the driver.
However for the analysis of data, the driver is assumed to be regular and homogenous. The traffic is found not observing the Lane discipline and the proportion of forced gap is found to be higher than the accepted gap.
Since the vehicles differ in various ways as per their characteristics, the classified gap acceptance behaviour was studied through the estimation of critical gap by each type of vehicle using Raff‟s Method. The critical gap value is lowest for only 2 wheelers as 1.25 seconds. It is found highest for 3 wheelers as 1.78 seconds. For the same, when cars were considered, the critical gap value obtained is 1.425 seconds. This variation can be related to the vehicular characteristics such as magnitude and acceleration rate due to which they are found to differ from each other.
This comparison has been already done for Rohtak city with same three methods. I have compared the values of Gap analysis, Follow up Time, Headway, Lag time and studied that the difference from that value is that, in Rohtak city frequent running vehicle is 2 wheeler while in Gurgaon city it is car, a 4 wheeler vehicle. Also there is only minor difference in the analysis.
REFERENCES
[1]. Darshana O. and Uden K. (2013) Training report titled “Analysis of Travel Information Data at Various Fuel Stations in Delhi” Submitted at SVNIT, Rohtak
[2]. Hagring O (2000) “Estimation of critical gaps in two major streams” Transportation Research Part B 34. Page 293-313 [3]. Harris B, Notley S, Boddington K and Rees T.“External Factors Affecting Motorway Capacity” 6th International
Symposium on Highway Capacity and Quality of Service Stockholm, June28-July 1, 2011. Page 69-75 [4]. Highway Safety Research and Communication website (iihs.org)
[5]. Hwang S. and Park C. (2005) “Modeling of the Gap Acceptance Behavior at A Merging Section Of Urban Freeway” Proceedings of the Eastern Asia Society for Transportation Studies, Vol. 5, Page 1641 – 1656 indiastat.com Website [6]. Sabanayagam S. (1990) “Capacity Analysis of Unsignalized Traffic Circles” TE Compendium of Technical Papers [7]. Subodh D, Balaji P. and Arkatkar S (2012) “Time Gap Modeling under Mixed Traffic Condition: A Statistical Analysis,
Journal of Transportation Systems Engineering and Information Technology, Vol. 12, Issue 6, Dec2012, Page 72-84 [8]. Troutbeck R. and Brilon W. “Unsignalised Intersection Theory” Chapter 8,Traffic Flow Theory, A State-of-the-Art
Report, Organized by the Committee on Traffic Flow Theory and Characteristics, Revised in 2001.
[9]. Troutbeck R. (2001) “Roundabouts” Chapter 8 Traffic Flow Theory A State-of-the-Art Report, Committee on Traffic Flow Theory and Characteristics (AHB45)
[10]. Troutbeck, R. (1992) “Estimating the critical acceptance gap from traffic movements” Physical infrastructure centre, Queensland University of Technology, Research Report