ISSN: 2231-3354 Received on: 30-03-2012 Revised on: 09-04-2012 Accepted on: 14-04-2012 DOI:10.7324/JAPS.2012.2416
Jenil C. Khamar, Satish A. Patel
Department of Quality Assurance, S. K. Patel College of Pharmaceutical Education and Research, Ganpat University, Kherva, Mehsana, Gujarat, India.
For Correspondence Jenil C. Khamar
Tel: (+91) 9978543690; E-mail: [email protected]
Q-Absorbance Ratio Spectrophotometric Method for
the Simultaneous Estimation of Rifampicin and
Piperine in their Combined Capsule Dosage
Jenil C. Khamar and Satish A. Patel
ABSTRACT
The present manuscript describe simple, sensitive, rapid, accurate, precise and economical Q-absorbance ratio method for the simultaneous determination of Rifampicin and Piperine in combined capsule dosage form. Absorbance ratio method uses the ratio of absorbances at two selected wavelengths, one which is an isoabsorptive point and other being the
λ-max of one of the two components. Rifampicin and Piperine show an isoabsorptive point at 387 nm in methanol. The second wavelength used is 337 nm, which is the λ-max of Piperine in methanol. The linearity was obtained in the concentration range of 5-40 μg/ml for Rifampicin
and 2-20 μg/ml for Piperine. The concentrations of the drugs were determined by using ratio of
absorbances at isoabsorptive point and at the λ-max of Rifampicin. The method was successfully applied to pharmaceutical dosage form because no interference from the capsule excipients was found. The results of analysis have been validated statistically and by recovery studies.
Keywords: Rifampicin, Piperine, absorbance ratio method, isoabsorptive point, validation, simultaneous.
INTRODUCTION
IP (Indian Pharmacopoeia., 2010) describe liquid chromatography method for its estimation. Literature survey reveals HPLC(A. B. Wood et al., 1988), UV Spectrophotometry (Gupta Vishvnath et al., 2011) and HPTLC(P.D.Hamrapurkar et
al., 2011; P. Shanmugasundaram et al., 2008) method for the
determination of PIPE. Literature survey also reveals HPLC (Kalrishna Veni Nagappan et al., 2009; Kamal YT et al., 2011)
method for determination of PIPE with other drugs in combination. The combined dosage forms of RIFA and PIPE along with Isoniazid are available in the market and used as anti tuberculosis drugs. The combination of these two drugs is not official in any pharmacopoeia; hence no official method is available for the simultaneous estimation of RIFA and PIPE in their combined dosage forms. Literature survey does not reveal any simple spectrophotometric method for simultaneous estimation of RIFA and PIPE in combined dosage forms. The present communication describes simple, sensitive, rapid, accurate, precise and cost effective spectrophotometric method based on Q-absorbance ratio spectrophotometric method for simultaneous estimation of both drugs in their combined capsule dosage form.
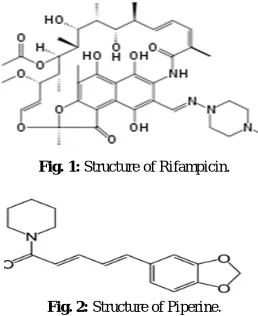
Fig. 1: Structure of Rifampicin.
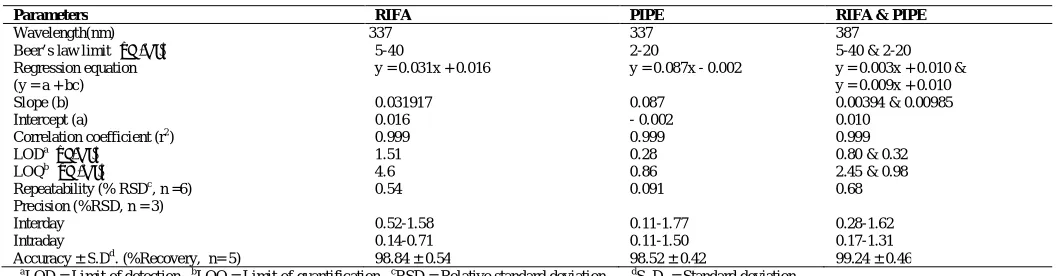
Fig. 2: Structure of Piperine.
MATERIALS & METHODS
Materials
A shimadzu model 1700 (Japan) double beam UV/Visible spectrophotometer with spectral width of 2 nm, wavelength accuracy of 0.5 nm and a pair of 10 mm matched quartz cell was used to measure absorbance of all the solutions. Spectra were automatically obtained by UV-Probe system software. A Sartorius CP224S analytical balance (Gottingen, Germany), an ultrasonic bath (Frontline FS 4, Mumbai, India) was used in the study. RIFA and PIPE bulk powder was kindly gifted by Cadila Pharmaceuticals Ltd. Ahmedabad, Gujarat, India. The commercial fixed dose combination product was procured from the local market. Methanol (AR Grade, S. D. Fine Chemicals Ltd., Mumbai, India) were used in the study.
Methods
for RIFA) and dissolved in methanol. The flasks were shaken and volumes were made up to mark with methanol to give a solution containing 100 μg/ml each of RIFA and PIPE.
Methodology
Absorbance ratio method uses the ratio of absorbances at two selected wavelengths, one which is an isoabsorptive point and
other being the λ-max of one of the two components. From the
overlay spectra of two drugs, it is evident that RIFA and PIPE show an isoabsorptive point at 387 nm. The second wavelength
used is 337 nm, which is the λ-max of PIPE. Working standard
solutions having concentration 5, 10, 15, 20, 25, 30, 35 and 40
μg/ml for RIFA and 2, 4, 6, 8, 10, 12, 16 and 20 μg/ml for PIPE
were prepared in methanol and the absorbances at 387 nm
(isoabsorptive point) and 337 nm (λ-max of PIPE) were measured
and absorptivity coefficients were calculated using calibration curve.
The concentration of two drugs in the mixture can be calculated using following equations.
CX = [(QM – QY) / (QX -QY)] × A1/ax1 ... (1) CY = [(QM – QX) / (QY -QX)] × A1/ay1 ... (2) Where, A1 and A2 are absorbances of mixture at 387 nm and 337 nm; ax1 and ay1 are absorptivities of RIFA and PIPE at 387 nm; ax2 and ay2 are absorptivities of RIFA and PIPE respectively at 337 nm; QM = A2 / A1, QX = ax2 / ax1 and QY = ay2 / ay1.
Validation Of The Proposed Method
The proposed method was validated according to the International Conference on Harmonization (ICH) guidelines.
Linearity (Calibration Curve)
The calibration curves were plotted over a concentration range of 5-40 μg/ml for RIFA and 2-20 μg/ml PIPE. Appropriate aliquots from the standard stock solutions of RIFA and PIPE were used to prepare two different sets of dilutions: Series A, and B as follows. Series A consisted of different concentration of RIFA
(5-40 μg/ml). Aliquot from the stock solution of RIFA (100 μg/ml)
was pipette out in to a series of 10 ml volumetric flask and diluted with methanol to get final concentration in range of 5-40 μg/ml
(0.5, 1.0, 1.5, 2.0, 2.5, 3.0, 3.5 and 4.0 ml). Series B consisted of varying concentrations of PIPE (2-20 μg/ml). Appropriate volume
of the stock solution of PIPE (100 μg/ml) was transferred into a
series of 10 ml volumetric flask and the volume was adjusted to the mark with methanol to get final concentration in range of 2-20
μg/ml (0.2, 0.4, 0.6, 0.8, 1.0, 1.2, 1.6, and 2.0 ml). The absorbances
of solution were then measured at 387 nm and 479 nm. The calibration curves were constructed by plotting absorbances versus concentration and the regression equations were calculated.
Method Precision (Repeatability)
Intermediate Precision (Reproducibility)
The intraday and interday precision of the proposed method was determined by analyzing the corresponding responses 3 times on the same day and on 3 different days over a period of 1 week for 3 different concentrations of standard solutions of RIFA and PIPE (10, 20, 40 μg/ml for RIFA and 2, 10, 20 μg/ml for
PIPE). The result was reported in terms of relative standard deviation (% RSD).
Accuracy (Recovery Study)
The accuracy of the method was determined by calculating the recoveries of RIFA and PIPE by the standard addition method. Known amounts of standard solutions of RIFA and PIPE were at added at 50, 100 and 150 % level to prequantified sample solutions of RIFA and PIPE (20 μg/ml for RIFA and 8 μg/ml for PIPE ). The amounts of RIFA and PIPE
were estimated by applying obtained values to the respective regression line equations.
Limit Of Detection And Limit Of Quantification
The limit of detection (LOD) and the limit of quantification (LOQ) of the drug were derived by calculating the signal-to-noise ratio (S/N, i.e., 3.3 for LOD and 10 for LOQ) using the following equations designated by International Conference on Harmonization (ICH) guidelines[20].
LOD = 3.3 × σ/S LOQ = 10 × σ/S
Where, σ = the standard deviation of the response and
S = slope of the calibration curve.
Analysis Of Capsule Sample
Weigh 20 capsules and determine average net content of blend. Remove Isoniazid tablet from blend. Accurately weigh and transfer quantity of capsule contents equivalent to about 200 mg of RIFA and 10 mg of PIPE into 100 ml amber coloured volumetric
flask. Add 70 ml of Methanol and sonicate for about 20 minutes. Dilute volume up to mark with Methanol and mix. Take 2 ml aliquot in separate 100 ml amber coloured volumetric flask. Dilute it up to mark with Methanol to get the solution containing 40 μg/ml of RIFA and 2 μg/ml of PIPE. The absorbances of the sample
solution i.e. A1 and A2 were recorded at 387 nm (isoabsorptive
point) and 337 nm (λ-max of PIPE) respectively, and ratios of
absorbance were calculated, i.e. A2/A1. Relative concentration of two drugs in the sample was calculated using above equation (1) and (2). The analysis procedure was repeated three times with capsule formulation.
RESULTS AND DISCUSSION
In absorbance ratio method (Q-analysis), the primary requirement for developing a method for analysis is that the entire spectra should follow the Beer’s law at all the wavelength, which was fulfilled in case of both these drugs. The two wavelengths were used for the analysis of the drugs were 387 nm (isoabsorptive
point) and 337 nm (λ-max of PIPE) at which the calibration curves
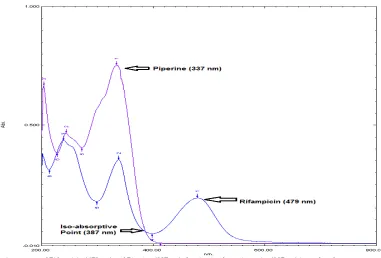
were prepared for both the drugs. The overlain UV absorption spectra of RIFA (479 nm) and PIPE (337 nm) showing isoabsorptive point (387 nm) in methanol is shown in Figure 3. The validation parameters were studied at all the wavelengths for the proposed method. Accuracy was determined by calculating the recovery and the mean was determined (Table 2). The method was successfully used to determine the amounts of RIFA and PIPE present in the capsule dosage forms. The results obtained were in good agreement with the corresponding labeled amount (Table 3). Precision was calculated as repeatability and intra and inter day variations (% RSD) for both the drugs. Optical characteristics and summary of validation parameters for method is given in Table 1. By observing the validation parameters, the method was found to be simple, sensitive, accurate and precise. Hence the method can be employed for the routine analysis of these two drugs in combined dosage form.
Table. 1: Regression Analysis Data and Summary of Validation Parameters for RIFA and PIPE by First Derivative Spectrophotometric Method.
Parameters RIFA PIPE RIFA & PIPE
Wavelength(nm) 337 337 387
Beer’s law limit (μg /ml) 5-40 2-20 5-40 & 2-20
Regression equation (y = a + bc) Slope (b) Intercept (a)
y = 0.031x + 0.016
0.031917 0.016
y = 0.087x - 0.002
0.087 - 0.002
y = 0.003x + 0.010 & y = 0.009x + 0.010 0.00394 & 0.00985 0.010
Correlation coefficient (r2
) 0.999 0.999 0.999
LODa
(μg/ml) 1.51 0.28 0.80 & 0.32
LOQb
(μg /ml) 4.6 0.86 2.45 & 0.98
Repeatability (% RSDc
, n =6) 0.54 0.091 0.68
Precision (%RSD, n = 3) Interday
Intraday
0.52-1.58 0.14-0.71
0.11-1.77 0.11-1.50
0.28-1.62 0.17-1.31 Accuracy ± S.Dd
. (%Recovery, n= 5) 98.84 ± 0.54 98.52 ± 0.42 99.24 ± 0.46
a
LOD = Limit of detection, b
LOQ = Limit of quantification, c
RSD = Relative standard deviation, d
Table. 2: Recovery Data of RIFA and PIPE by Spectrophotometric Method.
Drug Amount
taken (μg/ml)
Amount added (%)
%Recovery ± S. D. (n=5)
At 337 nm At 387 nm
RIFA 20 20 20
50 100 150
98.36 ± 0.19 98.93 ± 0.56 99.23 ± 0.87
99.53 ± 0.77 99.29 ± 0.41 98.91 ± 0.22
PIPE 8
8 8
50 100 150
98.01 ± 0.50 98.90 ± 0.55 98.67 ± 0.21
99.53 ± 0.77 99.29 ± 0.41 98.91 ± 0.22
Table. 3: Analysis of RIFA and PIPE by Spectrophotometric Method.
Capsule Label Claim
(mg)
Amount Found (mg)
% Label Claim ± S.D. (n=6)
RIFA PIPE RIFA PIPE RIFA PIPE
I 200 10 197.84 10.14 98.92 ± 0.44
101.40 ± 0.52
CONCLUSION
The proposed spectrophotometric method was found to be simple, sensitive, accurate and precise for determination of RIFA and PIPE in capsule dosage form. The method utilizes easily available and cheap solvent for analysis of RIFA and PIPE hence the method was also economic for estimation of RIFA and PIPE from capsule dosage form. The common excipients and other additives are usually present in the capsule dosage form do not interfere in the analysis of RIFA and PIPE in method, hence it can be conveniently adopted for routine quality control analysis of the drugs in combined pharmaceutical formulation.
ACKNOWLEDGEMENT
The authors are thankful to Cadila Pharmaceuticals Ltd., Ahmedabad, Gujarat, India for providing gift sample of RIFA and PIPE for research. The authors are highly thankful to Shree S. K.
REFERENCES
Ali J, Ali N, Sultana Y, Baboota S and Faiyaz S, Development and validation of a stability-indicating hptlc method For analysis of antitubercular drugs, acta chromatographica, no. 18, 2007, 168-179.
Atal CK, Dubey RK, Singh J. "Biochemical basis of enhanced drug bioavailability by piperine: evidence that piperine is a potent inhibitor of drug metabolism". J. Pharmacol. Exp. Ther., 1985; 232 (1); 258–62.
British Pharmacopoeia, Vol. II, London, The British Pharmacopoeia Commission; 2010: 1844, 3063.
Calleri E, Lorenzi EDe, Furlanetto S, Massolini G, Caccialanza G, Validation of a RP-LC method for the simultaneous determination of isoniazid, pyrazinamide and rifampicin in a pharmaceutical formulation, Journal of Pharmaceutical and Biomedical Analysis, August 2002; 29(6); 1089–1096
Goyal P, Pandey S, Udupa N, Simultaneous Spectophotometric Estimation Of Isoniazid And Rifampicin From Combined Dosage Forms Indian journal of Pharmaceutical science; 2002; 64(1); 76-78
Gupta V and Jain UK., Estimation of Piperine By UV-Spectrophotometric Method In Herbal Formulation, Pippli Churna, International Journal of Research in Pharmaceutical and Biomedical Sciences, Apr – Jun 2011; 2 (2); 550-553
Hamrapurkar PD, Jadhav K and Zine S, Quantitative Estimation of Piperine in Piper nigrum and Piper longum Using High Performance Thin Layer Chromatography Journal of Applied Pharmaceutical Science 2011; 01 (03); 117-120
Indian Pharmacopoeia, Vol. III, New Delhi, The Controller Publication, Govt. of India; 2010: 2054-2065.
Indian Pharmacopoeia, Vol. III, New Delhi, The Controller Publication, Govt. of India; 2010: 2522, 2530-31.
Kamal YT, Mohammed Musthaba S, Singh M, Parveen R, Ahmad S, Baboota S, Ali I, Siddiqui KM, Arif Zaidi SM.; Development and validation of HPLC method for simultaneous estimation of piperine and guggulsterones in compound Unani formulation (tablets) and a nanoreservoir system. Biomedical Chromatography, Dec-2011, DOI: 10.1002/bmc.2676.
Khuhawar MY and Rind FMA, High performance liquid chromatographic determination of isoniazid, pyrazinamide and rifampicin
Dosage Forms, Indian journal of pharmaceutical science; 2000; 62(3); 185-186
Mariappan TT, Jindal KC, Singh S, Overestimation of rifampicin during colorimetric analysis of anti-tuberculosis products containing isoniazid due to formation of isonicotinyl hydrazone, Journal of Pharmaceutical and Biomedical Analysis, November 2004; 36(3); 905– 908
Maryadele JO Neil. The Merck Index: An Encyclopedia of chemicals, drugs and biologicals. 14th ed., Whitehouse station, New Jersey: Published by Merck Research Laboratories, Division of Merck and Co., Inc; 2006: 1417.
Nagappan KV, Meyyanathan SN, Raja RB and Kannan E, A Liquid Chromatography Method for the Simultaneous Determination of Curcumin and Piperine in Food Products Using Diode Array Detection, Asian J. Research Chem.; April.-June, 2009, 2(2): 115-118
Panchagnula R, Sood A, Sharda N, Kaur K, Kaul CL, Determination of rifampicin andits main metabolite in plasma and urine in presence of pyrazinamide and isoniazid by HPLC method, journal of
.
Pharmaceutical and Biomedical Analysis January 1999, 18(6), 1013–1020 Shanmugasundaram P, Maheswari R, and Vijayaanandhi M, Quantitative estimation of piperine in herbal cough syrup by hptlc method, Rasayan J. Chem, 2008; 1(2); 212-217
Shishoo CJ, Shah SA, Rathod IS, Savale SS, Vora MJ, Impaired bioavailability of rifampicin in presence of isoniazid from fixed dose combination (FDC) formulation, International Journal of Pharmaceutics, October 2001; 228(1-2); 53–67.
Sweetman S.C. The Martindale: The Complete Drug Reference. 35th ed. Pharmaceutical Press. London, UK: 2007. p. 290.
The International Conference on Harmonization, Q2 (R1), Validation of Analytical Procedure: Text and Methodology: 2005.
The United State Pharmacopoeia, USP28 NF23, Rockville MD, United State Pharmacopoeial Convention, Inc; 2005: 3501 – 3507.