Monazitetype SrCrO4 under compression
Gleissner, J, Errandonea, D, Segura, A, PellicerPorres, J, Hakeem, Malik, Proctor,
JE, Raju, SV, Kumar, RS, RodriquezHernandez, P, Munoz, A, LopezMoreno, S and
Bettinelli, M
http://dx.doi.org/10.1103/PhysRevB.94.134108
Title Monazitetype SrCrO4 under compression
Authors Gleissner, J, Errandonea, D, Segura, A, PellicerPorres, J, Hakeem, Malik, Proctor, JE, Raju, SV, Kumar, RS, RodriquezHernandez, P, Munoz, A, LopezMoreno, S and Bettinelli, M
Type Article
URL This version is available at: http://usir.salford.ac.uk/40798/ Published Date 2016
USIR is a digital collection of the research output of the University of Salford. Where copyright permits, full text material held in the repository is made freely available online and can be read, downloaded and copied for noncommercial private study or research purposes. Please check the manuscript for any further copyright restrictions.
Monazite-type SrCrO
4under compression
J. Gleissner1,†, D. Errandonea1,*, A. Segura1, J. Pellicer-Porres1, M. A. Hakeem2, J. Proctor2, S. V.
Raju3, R.S. Kumar4, P. Rodríguez-Hernández5, A. Muñoz5, S. Lopez-Moreno6, and M. Bettinelli7
1
Departamento de Física Aplicada-ICMUV, MALTA Consolider Team, Universidad de Valencia, Edificio
de Investigación, C/Dr. Moliner 50, Burjassot, 46100 Valencia, Spain
2
School of Computing, Science, and Engineering, University of Salford, Manchester M5 4WT, UK
3
CESMEC, Dept. Mechanical Engineering, Florida International University, Miami, FL, USA
4
High Pressure Science and Engineering Center, Department of Physics, University of Nevada Las Vegas
5
Departamento de Física, Instituto de Materiales y Nanotecnología, and MALTA Consolider Team,
Universidad de La Laguna, La Laguna, E-38205 Tenerife, Spain
6
CONACYT – Centre for Corrosion Research, Univeristy of Campeche, Av. Heroe de Nacozari 480,
Campeche 24070, Mexico
7
Luminescent Materials Laboratory, Department of Biotechnology, University of Verona and INSTM, UdR
Verona, Strada Le Gracie 15, 37134 Verona, Italy
Abstract: We report a high-pressure study of monoclinic monazite-type SrCrO4 up to 26 GPa. Therein we
combined x-ray diffraction, Raman and optical-absorption measurements with ab initio calculations, to find a pressure-induced structural phase transition of SrCrO4 near 8–9 GPa. Evidence of a second phase transition
was observed at 10–13 GPa. The crystal structures of the high-pressure phases were assigned to the
tetragonal scheelite-type and monoclinic AgMnO4-type structures. Both transitions produce drastic changes
in the electronic band gap and phonon spectrum of SrCrO4. We determined the pressure evolution of the
band gap for the low- and high-pressure phases as well as the frequencies and pressure dependences of the
Raman-active modes. In all three phases most Raman modes harden under compression; however the
presence of low-frequency modes which gradually soften is also detected. In monazite-type SrCrO4, the
band gap blue-shifts under compression, but the transition to the scheelite phase causes an abrupt decrease of
the band gap in SrCrO4. Calculations showed good agreement with experiments and were used to better
understand the experimental results. From x-ray diffraction studies and calculations we determined the
pressure dependence of the unit-cell parameters of the different phases and their ambient-temperature
equations of state. The results are compared with the high-pressure behavior of other monazites, in particular
PbCrO4. A comparison of the high-pressure behavior of the electronic properties of SrCrO4 (SrWO4) and
PbCrO4 (SrCrO4) will also be made. Finally, the possible occurrence of a third structural phase transition is
discussed.
† ERASMUS student from Imperial College London, London SW7 2AZ, United Kingdom
I. Introduction
Photocatalytic materials which respond to ultra-violet (UV) and visible (VIS) light can be
used in a wide variety of environmental applications [1]. As a consequence, they have received
much attention in recent years. In particular, progress has been made thanks to the development of
chromium-based compounds [1]. Among them, lead chromate (PbCrO4) and strontium chromate
(SrCrO4) are the most studied materials due to their unique properties [2 - 5]. The crystal structures
of these ternary oxides have been determined accurately [6], both being assigned to a monazite-type
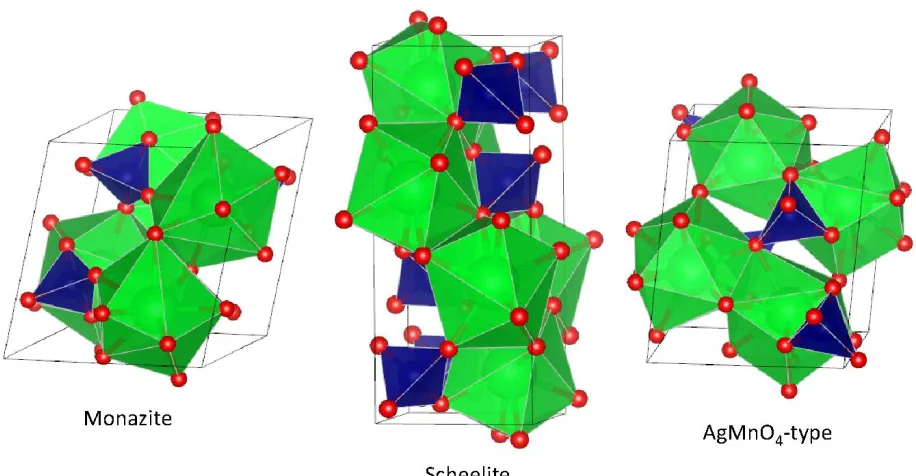
structure (space group P21/n, Z = 4). A schematic view of the monazite structure is given in Fig. 1.
The structural arrangement is based on the nine-fold coordination of the Pb (Sr) cation and the
fourfold coordination of the Cr cation. The ambient-pressure lattice vibrations and electronic band
structures of PbCrO4 and SrCrO4 have already been studied too [7].
During the last decade, high pressure (HP) has been shown to be an efficient tool for
improving the understanding of the physical properties of ternary oxides [8 – 15]. In particular,
numerous monazite-type oxides have already been the subject of HP studies [16 - 19], which have
concentrated mostly on phosphates and vanadates. Among the chromates, monazite-type PbCrO4 is
known to have quite an interesting high-pressure behavior [20, 21], undergoing several
pressure-induced phase transitions. These transitions have important consequences in the electronic
properties, modifying the electronic band gap from 2.3 eV at ambient pressure to 0.8 eV at 20 GPa
[22]. To the best of our knowledge, and in contrast to PbCrO4 and other monazite-type oxides, no
HP studies of SrCrO4 are available in the literature.
Here we will report a combined experimental and theoretical study of SrCrO4 under
compression. X-ray diffraction (XRD), Raman spectroscopy, and optical-absorption experiments
have been carried out up to 26 GPa, which are complemented by ab initio calculations. We will
report evidence of the existence of at least two phase transitions and propose crystal structures for
the HP phases. The transitions have important consequences on the physical properties of SrCrO4,
infrared (IR) modes, and the electronic band gap will be also reported for the different phases.
Moreover, a comparison of the high-pressure behavior of SrCrO4 and related ternary oxides will be
presented. The reported studies have enabled us to improve the understanding of the HP properties
of SrCrO4 and related compounds.
II. Experimental details
SrCrO4 in powder form was prepared by precipitation adding 50 ml of a 1 M Sr(NO3)2
solution to 50 ml of a 1 M K2CrO4 solution. Single crystals were grown using a ternary flux system
composed of NaCl, KCl, and CsCl, as described in Ref. 23. The weight composition of the mixture
was NaCl (24.8%), KCl (26.4%), CsCl (41.3%) and SrCrO4 (7.5%). The starting reagents were
mixed, placed in a platinum crucible with a tight-fitting lid, and kept for 12 h at 620 °C in a
horizontal furnace under air atmosphere. The melt was slowly cooled in three steps: first to 530 °C
with a temperature gradient of -1.5 °C/h, then to 450 °C at -2 °C/h, and finally to ambient
temperature at -50 °C/h. The crystals were separated by careful dissolution of the flux in deionized
water. Yellow single crystals of about 1 x 1 x 1 mm3 were obtained. The purity of the synthesized
material was confirmed by Energy-dispersive x-ray spectroscopy carried out in a
transmission-electron microscope (TEM) operated at 200 KeV at the SC-SIE, Universitat de Valencia. By means
of powder XRD measurements, using Cu Kα radiation, it was verified that the samples were
single-phased and presented the monazite-type structure (P21/n). The unit-cell parameters were
determined to be a = 7.065(7) Å, b = 7.376(7) Å, c = 6.741(7) Å, and β = 103.1(1)º, in very good
agreement with values reported in the literature [6, 24, 25, 26].
High-pressure powder XRD measurements were performed using a membrane
diamond-anvil cell (DAC) and a 4:1 methanol-ethanol mixture as pressure-transmitting medium [27, 28]. The
experiments were performed in the angle dispersive geometry with a symmetric-type DAC. The
micron-sized powder, used throughout the experiments, was obtained by grinding single-crystals
gasket material. The gasket was pre-indented to a thickness of 50 µm and a hole with a diameter of
130 µm was drilled in its center to form a pressure chamber. Special caution was taken during the
sample loading to avoid sample bridging between the diamond anvils [29]. Pressure was determined
using the ruby scale [30]. Experiments were carried out at the beam line 12.2.2 of the Advanced
Light Source, Lawrence Berkeley National Laboratory [31] with a MAR345 detector.
Monochromatic x-rays with a wavelength of 0.4949 Å were used for the experiments and the
FIT2D software [32] was employed to calibrate sample to detector distance and detector tilt, as well
as to integrate the two-dimensional diffraction images to standard one dimensional intensity versus
2θ plots. The structural analysis was performed with the GSAS and Powdercell software packages
[33, 34].
Four independent Raman experiment were performed. Two runs were carried out using one
set-up and the other two with a different set-up. In the first two runs, HP Raman spectra were
collected in the backscattering geometry using a 632.8 nm He-Ne laser, a single spectrometer
(Jobin−Yvon TRH1000), an edge filter and a thermoelectric-cooled multichannel CCD detector
(Horiba Synapse). The set-up was calibrated using plasma lines of the He-Ne laser. The other two
runs were carried out in the backscattering geometry using a 532 nm diode laser. In these
experiments, the scattered light was analyzed with a Jobin-Yvon Raman system equipped with a
single spectrograph, an edge filter, and an air-cooled multichannel CCD detector (iDus 420). This
set-up was calibrated using the Raman lines of Si and diamond. In all the experiments, a laser
power of less than 20 mW before the DAC was used to avoid sample heating and the spectral
resolution of the system was below 2 cm−1. The experiments were carried out using 10-μm-thick
single crystals of SrCrO4 which were loaded either in a symmetric DAC or in a membrane DAC. In
both cases we used ultralow fluorescence diamond anvils (300 – 500 µm size) and either inconel or
stainless steel gaskets. The gaskets were pre-indented to a thickness of 40-50 µm and a hole of
methanol-ethanol-water mixture (MEW) or nitrogen [27]. The four experiments gave similar results. Pressure
was determined using the ruby scale [30].
For optical absorption studies, we used 10-μm-thick parallel face crystals, which were
cleaved from the larger single crystals. Measurements in the UV-VIS-near-infrared (NIR) range
were made with an optical setup that consisted of deuterium and halogen lamps integrated in the
DH-2000 light-source from Ocean Optics, fused silica lenses, reflecting optics objectives, and an
Ocean Optics USB2000 UV−VIS−NIR spectrometer [35, 36]. The absorption spectra were obtained
from the transmittance spectra of the sample, which were recorded using the sample-in, sample-out
method [37, 38]. For these experiments we used a membrane DAC equipped with 500 μm culet
type IIA diamonds. The pressure chamber consisted in a 200 μm diameter hole drilled in a 45 μm
thick inconel gasket. Ruby fluorescence was used as pressure standard [30] and a mixture of
methanol-ethanol-water (16:3:1) was employed as the pressure-transmitting medium [27]. Three
independent experiments, which involve three different samples, were carried out. At ambient
pressure, we found that variation in the optical band gap with crystal orientation is minimum and
comparable to the accuracy of the measurements. Based upon this fact, our HP results neglect
effects of crystal orientation on the band-gap values.
We would like to add here that in all the experiments described above the ruby lines showed
a reasonable full-width at half maximum indicating than even at pressure where the pressure media
were not quasi-hydrostatic deviatoric stresses were small. In addition, we also took care that the
sample occupied only a small fraction of the pressure chamber and the gasket never distorted during
experiments. We think these facts that the phase transition we will reported here are intrinsic to the
application of pressure.
III. Computational details
Ab initio simulations of SrCrO4 under pressure were performed within the framework of
(VASP) [40]. The pseudopotential with the projector augmented wave scheme (PAW)[41] was
employed to describe the atomic species. Due to the presence of oxygen atoms, the set of plane
waves was developed up to a kinetic energy cut off of 520 eV, in order to obtain accurate results.
The exchange-correlation energy was described in the generalized-gradient approximation (GGA)
with the Perdew-Burke-Ernzenhof prescription for solids (PBEsol) [42]. To carry out integrations
over the Brillouin zone (BZ), dense meshes of Monkhorst-Pack special k-points [43] appropriate to
each structure were used. The convergence achieved in energy was better than 1 meV per formula
unit. At selected volumes, and for each structure considered, the lattice parameters and atomic
positions were fully optimized trough the calculation of forces on atoms and the stress tensor. In the
optimized structures, the forces on atoms were less than 0.004 eV/ Å and the deviations of stress
tensor components from the diagonal hydrostatic form were lower than 0.1 GPa. From the set of
energy (E), volume (V), and pressure (P) data, the enthalpy (H) as a function of P was obtained and
the relative stability between the different phases was analyzed. DFT is a well-tested method, which
accurately describes the relative phase stability and the properties of semiconductors under high
pressure [44]. The electronic band structure along high symmetry directions in the Brillouin zone
and the density of states were also calculated.
The direct force-constant method [45] was employed to study the lattice vibrations.
High-pressure lattice dynamic calculations were carried out at the zone center (Γ point) of the BZ. The
diagonalization of the dynamical matrix provided the frequency of the Raman and infrared modes.
The construction of the dynamical matrix at the Γ point required highly accurate calculations of the
forces which appear on the atoms when small displacements from their equilibrium configuration
are considered. From the calculations, symmetry and eigenvectors of the vibration modes of the
considered structures at the Γ point are also identified. The mechanical and phonon stability of the
IV. Results and discussion
A. Effects of pressure on the crystal structure
From our experiments we found evidence for at least two pressure-induced phase transitions
in SrCrO4. Since the interpretation of the experiments will be based upon ab initio calculations, we
will first present the results of our theoretical study on the structural stability of SrCrO4 at high
pressures. In the calculations we have taken into consideration previous results obtained for
monazite-type oxides [16, 17, 21, 46] and also candidate HP structures predicted by the
packing-efficiency criterion proposed by Bastide [15]. We have studied the relative stability of several
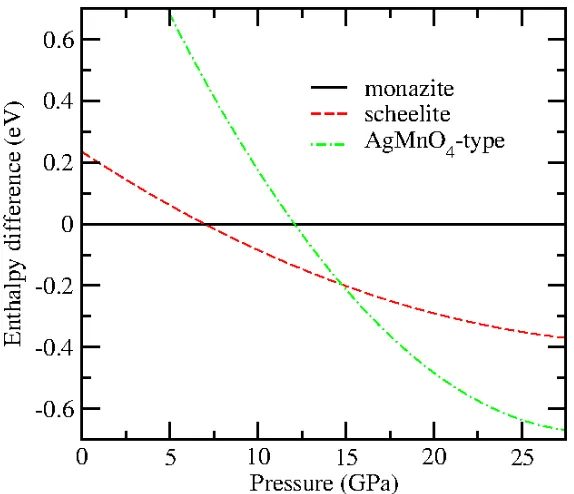
candidate HP structures using the calculation method outlined in the previous section. In Fig. 2 we
report the difference of enthalpy (taking monazite as reference) of the structures that we found to be
thermodynamically competitive with monazite. At ambient pressure, monazite is the most stable
structure of SrCrO4. The calculated structure is reported in Table I where it is compared with
experiments previously reported by us [7]. The agreement is excellent. As can be seen in Fig. 2, at
7 GPa a transition from the monoclinic monazite-type structure to a tetragonal scheelite-type
structure (space group I41/a, Z = 4) is suggested by the calculations. At 14 GPa a subsequent
transition to a monoclinic AgMnO4-type structure (space group P21/n, Z = 4) is predicted by the
calculations. Details of the calculated HP crystal structures are given in Tables II and III. A
schematic view of both HP structures can be seen in Fig. 1. The two phase transitions proposed by
calculations are in agreement with the experiments reported below. According with calculations the
predicted phase transitions are not caused by mechanical or phonon instabilities being probably ions
interactions the trigger factor of the detected phase transitions.
In order to confirm the existence of pressure-induced phase transitions in SrCrO4 we
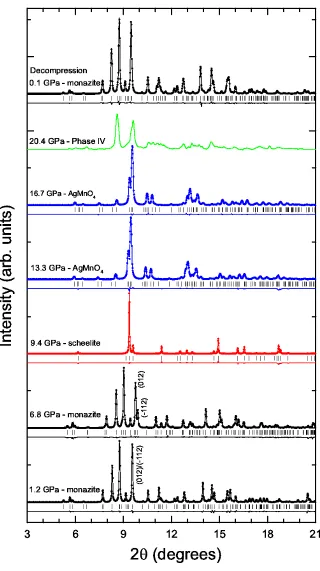
performed ambient-temperature XRD measurements. A selection of diffraction patterns at different
pressures is given in Fig. 3. We found that up to 6.8 GPa the XRD patterns can be Rietveld refined
1.2 GPa and 6.8 GPa together with Rietveld refined profiles and the residuals, which support the
identification of the monazite structure. At 1.2 GPa, the goodness-of-fit parameters are: RP =
4.47%, RWP = 6.76%, and χ2 = 1.64. Similar figures of merit were obtained at all pressures for the
monazite structure; e.g. at 6.8 GPa RP = 4.94%, RWP = 7.22%, and χ2 = 1.84. Before discussing the
phase transitions induced by pressure in SrCrO4, we would like to mention that when comparing
the XRD pattern measured at 6.8 GPa with the one measured at 1.2 GPa, it can be seen that several
Bragg peaks split as pressure increases. This is clearly seen in the figure for the (012) and (-112)
peaks which are labelled accordingly. This fact suggests a non-isotropic compression of monazite
SrCrO4, which will be discussed after presenting the evidence of the observed phase transitions.
When increasing the pressure from 6.8 GPa to 9.4 GPa very noticeable changes take place in
the XRD pattern. These changes are consistent with the occurrence of a phase transition at 7.5 GPa
as predicted by our calculations. The reduction in the number on Bragg reflections presents a strong
indication for a symmetry increase in the crystal structure. In particular, the XRD patterns we
measured at 9.4 and 11.2 GPa can be indexed assuming the tetragonal scheelite-type structure. In
Fig. 3 we show the results of a Rietveld refinement carried out for the XRD pattern measured at 9.4
GPa. The residuals are small, which indicates that scheelite is a suitable structural model for the
crystal structure of the HP phase. The structural information of the scheelite-type phase is given in
Table II. The agreement between calculations is good, not only for the unit-cell parameters, but also
for the atomic positions of the oxygen atoms (The positions of Sr and Cr are fixed by the symmetry
of the structure). The goodness-of-fit parameters of the refinement shown in Fig. 3 for the scheelite
structure are: RP = 5.74%, RWP = 7.94%, and χ2 = 2.12.
When increasing the pressure from 11.2 GPa to 13.3 GPa, we found evidence for a second
phase transition, which agrees with the 12 GPa transition pressure found by calculations for the
scheelite-AgMnO4-type transition. In particular, the XRD patterns measured from 13.3 GPa up to
refinement performed at 13.3 GPa and 16.7 GPa are shown in Fig. 3. The refinements indicate that
the AgMnO4-type structure can be assigned to the second HP phase of SrCrO4. The goodness-of-fit
parameters of the refinement for the XRD pattern measured at 13.3 GPa are: RP = 5.97%, RWP =
8.02%, and χ2 = 2.19. The obtained unit-cell parameters and atomic positions are given in Table III.
The agreement between experiments and calculations is quite good, which makes us confident
about the structural assignment made for the second HP phase of SrCrO4. We would like to
highlight the fact that the coordination of Cr is not affected during the monazite-scheelite-AgMnO4
-type structural sequence, Cr being coordinated by four oxygens forming a regular (or nearly
regular) CrO4 tetrahedron in all three structures. However the Sr coordination is modified,
becoming the coordination number of Sr ten the AgMnO4-type structure.
After a subsequent compression step from 18.9 GPa to 20.4 GPa we observed important
changes in the XRD pattern (see Fig. 3). These changes indicate that possibly a third phase
transition is taking place. Unfortunately, the low quality of the XRD pattern measured at 20.4 GPa
does not allow the identification of the crystal structure of the third HP phase, which we will name
phase IV. In fact we cannot exclude the phase coexistence of phase IV and the AgMnO4 phase at
20.4 GPa. With the aim of trying to clarify this last hypothesis we increase the pressure in two steps
up to 24 GPa. However, the diffraction peaks broaden, which precludes any sound structural
identification. Thus, from our XRD experiments we can only state that the onset of a third phase
transition takes place between 18.9 and 20.4 GPa. This conclusion is supported by our Raman
experiments, as we will comment below. The identification of the crystal structure of phase IV
remains an open issue for future studies. Before concluding this part of the discussion we would
like to mention that upon a rapid decompression from 24 GPa to 0.1 GPa the crystal structure of the
low-pressure monazite phase was recovered. This is shown in Fig. 3. There it can be seen that the
XRD pattern measured after decompression at 0.1 GPa is quite similar to the one measured at 1.2
From the XRD experiments and the calculations we have determined the pressure dependence
of the unit-cell parameters. The results are shown in Fig. 4 where the symbols and lines represent
the experimental results and calculations, respectively. We found that the low-pressure phase is
slightly more compressible than the two HP phases. This is consistent with the volume reduction
associated with each phase transition. In Fig. 4, it can be seen that in both phase transitions there is
a discontinuity in the volume, which is larger than the uncertainty of the volume determination.
While ab initio calculations correctly predict the overall volume change between the monazite and
AgMnO4 phases, there is a discrepancy between the predicted and measured relative volume
changes at the monazite-scheelite (-2% theory versus -4% experiment) and scheelite-AgMnO4 (-4%
theory versus -2% experiment). This small discrepancy is most probably due to the narrow pressure
range through which the scheelite phase is observed, which certainly limits the accuracy in the
determination of the scheelite phase equation of state (EOS). From the volume discontinuities
observed in the transitions, it can be stated that both structural changes are first-order transitions.
Regarding the reduction of the lattice parameters, we can conclude that the compression in the
low-pressure monazite phase is anisotropic, with the a-axis being the most compressible axis. In
addition, it can be seen that the β angle is reduced by compression; approximately 0.2º per GPa.
The observed behavior of monazite SrCrO4 is qualitatively similar to that of other monazites [16 –
20, 47]. In contrast to the low-pressure phase, the compression in the scheelite and AgMnO4
structures is nearly isotropic, with the β angle of the last phase being only slightly reduced by
compression.
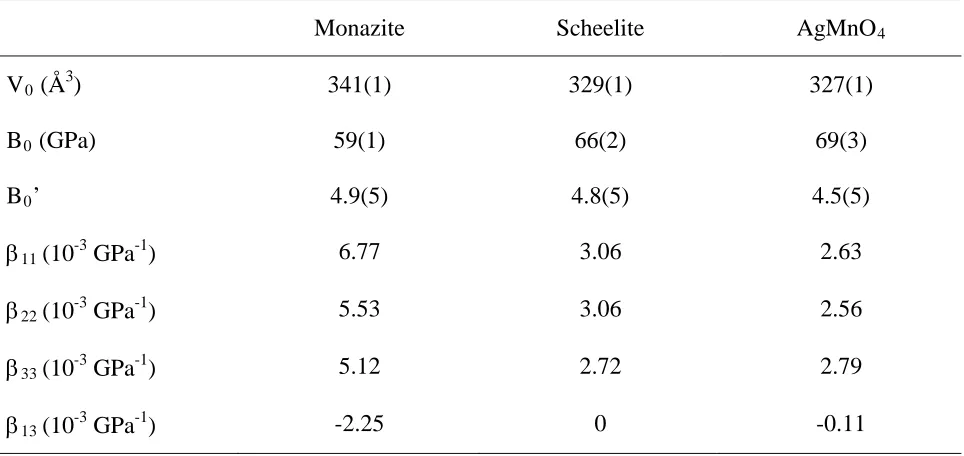
From the pressure dependence of the unit-cell parameters we determined the pressure-volume
equation of state (EOS) for the three phases of SrCrO4 and their compressibility tensor. Since we
have a few experimental data points for each phase and calculations and experiments qualitatively
give similar pressure dependence for the unit-cell volume, we have used the calculations to
quantitatively describe the compression of the different phases. We found that for the three phases,
EOS [48]. The obtained EOS parameters are summarized in Table IV. In the table V0 is the
unit-cell volume at ambient pressure, B0 the bulk modulus, and B0’ its pressure derivative. The use of a
third-order EOS was based upon an analysis of the dependence of the normalized pressure on the
Eulerian strain [49]. Among the different polymorphs of SrCrO4, monazite is the one with the
smallest bulk modulus. Regarding the compressibility tensor, in a monoclinic structure this tensor
has four independent components β11, β22, β33, and β13. The analytical expressions of them can be
found in Ref. 50. In our monoclinic structures (where b is the unique crystallographic axis) β22 and
β33 are the compressibilities of the b and c axes, respectively. On the other hand β11 corresponds to
the compressibility in the direction perpendicular to the b-c plane and β13 describes the change of
the shape of the plane perpendicular to the unique crystallographic axis. In the case of the tetragonal
scheelite structure, given the symmetry of the crystal, β11 = β22 and β13 = 0. The values obtained for
β11, β22, β33, and β13 for the three phases are given in Table IV. In the table it can be confirmed that
the compression of the low-pressure phase is non-isotropic. This is indicated by the fact that β33 is
more than 20% larger than β11 and β22. In contrast in the other two phases the diagonal components
of the tensor have values that differ by less than 10%. In the case of the AgMnO4 structure, β13 is
quite small compared to the same parameter in the monazite structure. This fact indicates that the
shape of the unit-cell of AgMnO4 is basically not modified by compression. This and the value of
the β angle, which is close to 90º, suggest that as a first approximation this HP phase behaves as a
quasi-orthorhombic structure, which resembles a distorted-barite structure.
B. Raman spectroscopy
We will now present Raman-spectroscopic evidence on the pressure-driven transitions in
SrCrO4. We have previously reported the ambient pressure Raman spectrum of monazite SrCrO4 as
well as the mode frequency and assignment of the Raman-active modes [7]. The modes have been
identified as internal stretching (high frequency) and bending (intermediate frequency) modes of the
and CrO42- ions [7]. Previously, thirty of the thirty-six expected modes (Γ = 18Ag + 18Bg) were
measured at ambient pressure (outside the DAC) [7]. In this paper, thirty-three modes have been
detected. The wavenumbers of these modes are given in Table V. In Figures 5 and 6 we show
Raman spectra measured at HP using MEW as the pressure medium and a 632.8 nm He-Ne laser
excitation. To facilitate the mode identification we have divided the Raman spectra into three
regions. They correspond to the external and internal (bending and stretching) modes, which have
very different intensities. The spectra shown in Figure 5 correspond to measurements carried out up
to 8.2 GPa. All the Raman spectra shown in this figure resemble the ambient pressure Raman
spectrum of monazite SrCrO4. In the HP experiments, we have been able to identify a maximum of
twenty-six modes of the monazite phase. They are identified by ticks in the figure for the spectrum
measured at 1.1 GPa. The weakest modes observed at ambient pressure (outside the DAC) were not
observed at HP because the presence of the diamond anvils increases the background level thereby
decreasing the signal-to-noise ratio [51]. Most of the modes could be followed up to 8.2 GPa. Up to
this pressure the Raman spectra can be unambiguously assigned to the monazite phase. Since not all
modes are equally affected by pressure, a tendency of some of them to merge under compression
was observed. Clear evidence of three phonons crossing over other Raman modes was also
observed. Two of the phonon crossovers occur for external modes, and one for internal stretching
modes. Most of the modes harden under compression. Only two modes have negative pressure
coefficients according to experiments. The frequencies (ω) and pressure coefficients (dω/dP) of the
different modes are summarized in Table V where they are compared with our theoretical
calculations. The Grüneisen parameters (γ), which provide a dimensionless representation of the
response to compression, are also included. The pressure dependence of the Raman frequencies is
presented in Figure 7. In the table we have included a column to show the relative difference
between experimental and theoretical frequencies, Rω, as defined in Ref. 52. For most modes Rω is
smaller than 5% and in many modes even smaller than 1%, which illustrates the excellent
there is a qualitative agreement between calculations and experiments. We observed that the
behavior observed in monazite-type SrCrO4 is qualitatively similar to that of isomorphic PbCrO4
[20]. A remarkable feature is the presence of two external modes below 100 cm-1 which have
negative pressure coefficients. Theory predicts the existence of a third mode whose frequency
decreases under compression. However, this mode is not detected in our experiments because it is
expected to be below the low-frequency limit of the Raman set-up. The presence of these modes is
apparently a typical feature of monazites since it has been also detected in PbCrO4 [20] and LaVO4
[46]. The presence of such modes might be correlated with a weakening of the restoring force
against the corresponding deformation associated to the phonon mode, probably marking the
existence of a collective instability that tends to make the crystal structure unstable. This fact is
consistent with the finding of a phase transition at relatively low pressures as it was found in
SrCrO4. However, since the wavenumber of the modes with negative pressure coefficients never
reaches zero, they are not classical soft-modes, as those observed in a second-order displacive
transition [53, 54]. Another feature to be remarked upon is the tendency of the external modes of
monazite SrCrO4 to have larger Grüneisen parameters than the internal modes. The same trend has
been observed before, not only in monazite PbCrO4 [20], but also in barite-type BaCrO4 [55].
When increasing the pressure from 8.2 GPa to 8.9 GPa very important changes take place in
the Raman spectrum. In the spectrum measured at 8.9 GPa only eleven modes can be identified.
The observed changes indicate the occurrence of a phase transition. The transition pressure is
consistent with the monazite-scheelite transition pressure obtained from XRD and calculations. The
mode distribution of phonons in the Raman spectrum is very similar to that of most scheelite oxides
[56]. The Raman spectrum of the scheelite structure has thirteen Raman-active modes (Γ = 3Ag +
5Bg + 5Eg) [56], but in our case we detected only eleven. They are identified by ticks in Figure 5
for the spectrum measured at 8.9 GPa. Regarding the undetected modes, one of the modes not
detected (with a wavenumber of 175 cm-1, according to calculations) is usually very weak [56]. The
assignment of the Raman spectrum measured at 8.9 GPa to the scheelite phase comes from ab initio
calculations. In Table VI we report the Raman frequencies determined from experiments and
calculations. All frequencies agree within 5%, supporting the finding that the measured Raman
spectrum can be assigned to the HP scheelite structure. Calculations also provide the mode
assignment which is given in the table. A typical feature of the scheelite Raman spectrum is the
presence of three strong modes in the high-frequency region, which are indeed present in the
spectra we assigned to the scheelite structure. The modes are internal stretching modes of the CrO4
tetrahedron and are separated by a large phonon gap from the rest of the modes (see Table VI).
When increasing the pressure we observed the scheelite phase, as a single phase, over a reduced
pressure range because of the onset of a second phase transition at 9.7 GPa (see discussion below).
However, the most intense peaks of the scheelite phase can be detected up to 11.7 GPa. The phonon
frequencies as a function of pressure are shown in Figure 7. From these results we estimate the
pressure coefficient of each phonon. The coefficients are shown in Table VI where they are
compared to calculations. The agreement for pressure coefficients is not as good as for the
frequencies. However, differences are comparable with the discrepancy observed between theory
and calculations for the HP phases of related oxides [57]. The mode with the largest discrepancy in
the pressure dependence of the frequency is the low frequency Bg mode at 127 cm-1. In spite of
these facts, both methods gave a qualitatively similar picture, suggesting that in scheelite SrCrO4,
as is also the case in the low-pressure monazite phase, the external modes (ω < 375 cm-1) are the
modes with the largest Grüneisen parameters. In addition, as in the monazite phase, in scheelite
SrCrO4 there is also a phonon with a negative pressure coefficient. This is the phonon with the
lowest frequency (see Table VI). The presence of a mode with such a behavior is a distinctive
feature of scheelite-structured oxides [58].
As we commented above, at 9.7 GPa, additional Raman modes appear in the spectra
suggesting the onset of a second phase transition. We found evidence for the coexistence of the
become stronger while the scheelite modes lose intensity. The coexistence of the two phases can be
a consequence of the fact that the proposed structural phase transition is an order-disorder
transition. At 12.2 GPa the scheelite modes have completely vanished. The existence of this second
transition is in agreement with the conclusions drawn from our XRD experiments and calculations.
It is noticeable that the new HP phase has many more Raman modes than scheelite, which is
consistent with the scheelite-AgMnO4 transition. From 12.2 GPa to 14.7 GPa we did not observe
any qualitative change in the Raman spectrum. We will show below that the calculated Raman
frequencies for the AgMnO4 phase agree reasonably well with the modes we identified in the
experiments. At 15.7 GPa we observe the appearance of several additional Raman modes and the
disappearance of some of the modes of the AgMnO4 phase. These changes suggest another
transition to a phase which we will refer to as phase IV. As we mentioned above this transition was
detected by XRD at 20.4 GPa and the identification of the crystal structure of phase IV is beyond
the scope of this work. We would like to mention here that the same transition was detected when
using nitrogen as the pressure medium at 19.5 GPa. The difference in the transition pressures for the
AgMnO4-phase IV transition can be caused by the use of different pressure media, which have a
different hydrostatic pressure limit [27], therefore influencing the transition pressures of compounds
like SrCrO4 [59, 60]. Before discussing the Raman modes of AgMnO4-type SrCrO4 in more detail,
we would like to add that we observed that phase IV remains stable up to 26 GPa.
From factor group analysis, it can be established that the AgMnO4 structure presents 36
Raman-active phonons (Γ = 18Ag + 18Bg), exactly as the monazite phase. The expected number of
Raman modes is consistent with the changes we observed in the Raman spectra near the
scheelite-AgMnO4 transition pressure. The calculated wavenumbers and mode assignment of all
Raman-active modes for the AgMnO4-type structure are given in Table VII. We have eighteen
low-frequency lattice modes plus ten internal bending modes and eight internal stretching modes of the
CrO4 tetrahedron. In the experiments we have also detected thirty six modes. A correlation can be
modes. However, the internal modes cannot be fully correlated. In fact, for the intermediate
frequency range (340 < ω < 450 cm-1) we have measured only eight modes, whereas calculations
predict ten modes. The discrepancy could be caused by the fact that calculations predict that two
couples of Ag/Bg are very close in frequency. This added to the fact that modes broaden and lost
intensity as pressure increases, could justify the detection of only eight Raman modes instead of the
expected ten modes. In the high-frequency region the opposite behavior is found. Eight modes are
predicted by theory while we observed ten modes in the experiments. The two extra modes could be
overtones of the low-frequency modes or be induced by a disorder in the crystal structure as
previously observed when disorder is induced in related oxides [60, 61]. In summary, however, we
can state that calculations and experiments show a qualitative overall agreement on the Raman
spectrum of the second HP phase of SrCrO4, indicating that the AgMnO4-type structure we
determined from XRD and calculations gives a good model to explain the Raman spectrum of the
second HP phase. Regarding the pressure dependence of the Raman modes, the agreement between
experiments and calculations is good, even better than for the scheelite phase. The main difference
between the AgMnO4 and the other two phases is that in the AgMnO4 phase the external and
internal modes have similar Grüneisen parameters. This feature could be accounted for by the fact
that, in the high pressure phase, external bonds become stronger and less compressible than in the
ambient pressure phase. Another point to note is that the AgMnO4 phase has two phonons with
negative pressure coefficients, which are the two lowest frequency modes.
C. Optical absorption and band structure
Figure 8 shows a selection of optical-absorption spectra measured at different pressures. From
the parabolic dependence of the absorption coefficient on the photon energy, it can be concluded
that SrCrO4 is an indirect band-gap material with band-gap energy (Eg) of 2.45(5) eV.
Band-structure calculations confirm that SrCrO4 has an indirect band gap Eg = 2.67 eV (from Γ to Γ-Z).
9%. As pressure increases, the absorption edge shifts towards higher energy, resulting in a change
of SrCrO4 crystal color from orange to orange-yellow. At 8.3 GPa we observed an abrupt shift of
the absorption edge towards low energies. At this pressure the crystal of SrCrO4 changes it color
becoming orange-red. This abrupt change in the optical properties correlates well with the
occurrence of the monazite-scheelite transition. Upon further compression, there is a blue-shift of
the absorption spectrum of SrCrO4. From the optical-absorption measurements the pressure
dependence of Eg up to 15 GPa was determined, as shown in Figure 9. For the low-pressure phase,
we found a gradual increase of Eg under compression. Assuming there is a linear relation between
Eg and pressure, we determined dEg/dP = 17(5) meV/GPa. This pressure coefficient contrasts with
the pressure coefficient determined for the band gap of monazite PbCrO4 (-46 meV/GPa) [22]. Note
that the same differences are found when comparing the pressure effect on the band gap of SrWO4
(dEg/dP = 3.7 meV/GPa) and PbWO4 (dEg/dP = -61 meV/GPa) [35]. An explanation to the
observed difference comes from band structure calculations. Our calculations indicate that in both
compounds, the upper part of the valence band is dominated by O 2p states. In contrast, the lower
part of the conduction band is composed primarily of electronic states associated with the Cr 3d and
O 2p states. On the other hand, in SrCrO4 the Sr states are completely empty near the Fermi level.
Thus, they do not have any influence on the bandgap energy. However, in PbCrO4, there is a
contribution of Pb 6s electrons to the top of the valence band and of Pb 6p states to the bottom of
the conduction band. As a consequence, Eg is smaller in PbCrO4 (2.25 eV) than in SrCrO4 (2.45
eV). Another consequence is the different behavior of Eg with pressure in both compounds. From
our calculations, we found that under compression in SrCrO4 Cr 3d states move faster towards
higher energies than O 2p states, leading to the small opening of the band gap we observed in the
experiments. In contrast, in PbCrO4, the top of the valence band shifts toward high energies faster
than the bottom of the conduction band. This is a consequence of the separation between Pb
displacement towards higher energies of the top of the valence band, but reduces the displacement
of the bottom of the conduction band.
At 8.3 GPa an abrupt decrease of 0.2 eV in Eg was observed (see Figure 9). This pressure
corresponds to the monazite-scheelite transition we described above. We carried out band-structure
calculations for scheelite-type SrCrO4. Calculations indicate that in the scheelite structure SrCrO4
is a direct band-gap material with Eg = 2.25 eV (at 8.3 GPa) with the band gap located at the Γ
point of the Brilloun zone. This value of Eg is 6% smaller than the experimental value determined
for the scheelite phase; Eg = 2.40(5) eV. The band-gap collapse determined from calculations is 0.4
eV. In summary, the changes observed in the optical properties of SrCrO4 at 8.3 GPa are consistent
with the structural sequence found in our structural and vibrational studies. Upon further
compression in the scheelite phase we observed that Eg linearly increases with pressure with dEg/dP
= 16(5) meV/GPa, which is nearly identical to the behavior of the low-pressure phase. This result is
consistent with the fact that in both structures the valence and conduction bands near the band gap
are dominated by molecular orbitals associated with the CrO4−2 ions, and the fact that the CrO4
tetrahedron undergoes a similar compression in both structures.
At 10.2 GPa a change in the pressure dependence of Eg was found. This change is consistent
with the occurrence of a second phase transition, as discussed in the previous sections based upon
our structural and vibrational studies. For the second HP phase we determined dEg/dP = 4(2)
meV/GPa; which indicates that the band gap is less sensitive to pressure in the AgMnO4-type
phase. The decrease of dEg/dP in this phase is consistent with the fact that this is the least
compressible structure among the three structures reported for SrCrO4. For the second HP phase the
experimentally determined bandgap is Eg = 2.46(5) eV at 14.5 GPa, in excellent agreement with ab
initio band structure calculations yielding Eg = 2.45 eV for the AgMnO4-type phase. According to
our calculation in this phase SrCrO4 is an indirect band gap material, with the top of the valence
V. Summary
We have performed HP XRD, Raman, and optical-absorption measurements as well as ab
initio calculations on SrCrO4. Changes in the crystal structure, lattice dynamics, and optical
properties indicate the occurrence of at least two phase transitions. Ab initio calculations confirm
the experimental findings and help to understand them. We have assigned a scheelite-type and a
AgMnO4-type structure to the two HP polymorphs found in SrCrO4. The pressure dependence of
unit-cell parameters, Raman modes, and band-gap energy is reported for the low-pressure monazite
phase and the two HP phases of SrCrO4. An assignment for the Raman modes is proposed based
upon calculations. The reported results augment the understanding of the effects of pressure on the
physical properties of ternary oxides. A comparison with the behavior of the band gap of SrCrO4
and PbCrO4 is presented and an explanation to their different HP behaviors is proposed. The fact
that the electronic states near the Fermi level are mainly Cr 3d and O 2p states makes the band gap
of monazite SrCrO4 less sensitive to pressure than in PbCrO4. This conclusion also explains the
distinctive pressure behavior of the band gap of SrWO4 and PbWO4.
Acknowledgments
This work has been done under financial support from Spanish MINECO under projects
MAT2013-46649-C4-1/3-P and MAT2015-71070-REDC. Supercomputer time has been provided by the Red
Española de Supercomputación (RES) and the MALTA cluster. The authors thank the SCSIE from
Universitat de Valencia for the technical support. S.M.L. thanks CONACYT from Mexico for
References
[1] L. K. Bharat, L. S. Reddy, and J. S. Yu, Materials Letters 144, 85 (2015) and reference therein.
[2] J. Yin, Z. Zou, and J. Ye, Chem Phys Lett 378, 24 (2003).
[3] M. U. Belyi, S. G. Nedel’ko, and O. V. Chukova, J. Appl. Spectrosc. 62, 604 (1995).
[4] P. Chen, Q. S. Wu, Y. P. Ding, and P. S. Yuan, Bull. Mater. Sci. 31, 603 (2008).
[5] G. A. M. Dalhoeven and G. Blasse, Chem. Phys. Lett. 76, 27 (1980).
[6] H. Effenberger and F. Pertlik, Zeitschrift fur Kristallographie 176, 75 (1986).
[7] D. Errandonea, A. Muñoz, P. Rodríguez-Hernández, J. Proctor, F. Sapiña, and M. Bettinelli,
Inorg. Chem. 54, 7524 (2015).
[8] D. Errandonea, C. Popescu, A. B. Garg, P. Botella, D. Martinez-Garcıa, J. Pellicer-Porres, P.
Rodrıguez-Hernandez, A. Muñoz, V. Cuenca-Gotor, and J. A. Sans, Phys. Rev. B 93, 035204
(2016).
[9] J. Ruiz-Fuertes, S. Lopez-Moreno, J. Lopez-Solano, D. Errandonea, A. Segura, R.
Lacomba-Perales, A. Muñoz, S. Radescu, P. Rodrıguez-Hernandez, M. Gospodinov, L. L. Nagornaya, and C.
Y. Tu, Phys. Rev. B 86, 125202 (2012).
[10] J. Ruiz-Fuertes, A. Segura, F. Rodríguez, D. Errandonea, and M. N. Sanz-Ortiz, Phys. Rev.
Lett. 108, 166402 (2012).
[11] P. Goel, M. K. Gupta, R. Mittal, S. Rols, S. N. Achary, A. K. Tyagi, and S. L. Chaplot, Phys.
Rev. B 91, 094304 (2015).
[12] D. Errandonea, Cryst. Res. Technol. 50, 729 (2015).
[13] D. Errandonea, L. Gracia, R. Lacomba-Perales, A. Polian, and J. C. Chervin, J. Appl. Phys.
113, 123510 (2013).
[14] M. N. Coelho, P. T. C. Freire, M. Maczka, C. Luz-Lima, G. D. Saraiva, W. Paraguassu, A. G.
Souza Filho, N. D. P. S. Pizani, Vibrat. Spectr. 68, 34 (2013).
[15] D. Errandonea and F. J. Manjon, Prog. Mater. Sci. 53, 711 (2008).
(2010).
[17] D. Errandonea, C. Popescu, S.N. Achary, A. K. Tyagi, and M. Bettinelli, Mater. Res. Bull. 50,
279 (2014).
[18] D. Errandonea, O. Gomis, D. Santamaria-Perez, B. Garcia-Domene, A. Muñoz, P.
Rodriguez-Hernandez, S. N. Achary, A. K. Tyagi, and C. Popescu, J. Appl. Phys. 117, 105902 (2015).
[19] T. Huang, J. S. Lee, J. Kung, and C. M. Lin, Solid State Commun. 150, 1845 (2010).
[20] E. Bandiello, D. Errandonea, D. Martinez-Garcia, D. Santamaria-Perez, and F. J. Manjon,
Phys. Rev. B 85, 024108 (2012).
[21] D. Errandonea and R. S. Kumar, Mater. Res. Bull. 60, 206 (2014).
[22] D. Errandonea, E. Bandiello, A. Segura, J. J. Hamlin, M. B. Maple, P. Rodriguez-Hernandez,
and A. Muñoz, J. Alloys Compd. 587, 14 (2014).
[23] R. P. Schenker, T. C. Brunold, H. U. Güdel, Inorg. Chem. 37, 918 (1998).
[24] C. W. F. T. Pistorius and M. C. Pistorius, Zeitschrift fur Kristallographie 117, 259 (1962).
[25] J. Yin, Z. Zou, amd J. Ye, Chem. Phys. Letters 378, 24 (2003).
[26] P. Pahri and V. Manivannan, J. Alloys Compd. 469, 558 (2009).
[27] S. Klotz, J. C. Chervin, P. Munsch, and G. Le Marchand, J. Phys. D: Appl. Phys. 42, 075413
(2009).
[28] D. Errandonea, Y. Meng, M. Somayazulu, and D. Häusermann, Physica B 355, 116 (2005).
[29] D. Errandonea, A. Muñoz, and J. Gonzalez-Platas, J. Appl. Phys. 115, 216101 (2014).
[30] H. K. Mao, J. Xu, and P. M. Bell, J. Geophys. Res. 91, 4673 (1986).
[31] M. Kunz, A. A. MacDowell, W. A. Caldwell, D. Cambie, R. S. Celestre, E. E. Domning, R. M.
Duarte, A. E. Gleason, J. M. Glossinger, N. Kelez, D. W. Plate, T. Yu, J. M. Zaug, H. A. Padmore,
R. Jeanloz, A. P. Alivisatos and S. M. Clark, J. Synchrotron Rad.12, 650 (2015).
[32] A. Hammersley, S. O. Svensson, M. Hanfland, A. M. Fitch, and D. Häussermann, High. Press.
Res. 14, 235 (1996).
(unpublished).
[34] W. Kraus, G. Nolze, J. Appl. Crystallogr. 29 (1996) 301.
[35] R. Lacomba-Perales, D. Errandonea, A. Segura, J. Ruiz-Fuertes, P. Rodriguez-Hernandez, S.
Radescu, J. Lopez-Solano, A. Mujica, and A. Muñoz, J. Appl. Phys. 110, 043703 (2011).
[36] A. Segura, J. A. Sans, D. Errandonea, D. Martinez-Garcia, and V. Fages, Appl. Phys. Lett. 88,
011910 (2006).
[37] V. Panchal, D. Errandonea, A. Segura, P. Rodriguez-Hernandez, A. Muñoz, S. Lopez-Moreno,
and M. Bettinelli, J. Appl. Phys. 110, 043723 (2011).
[38] D. Errandonea, D. Martinez-Garcia, R. Lacomba-Perales, J. Ruiz-Fuertes, and A. Segura,
Appl. Phys. Lett. 89, 091913 (2006).
[39] P. Hohenberg and W. Kohn, Phys. Rev. 136, B864 (1964).
[40] G. Kresse and J. Hafner, Phys. Rev. B 47, 558 (1993).
[41] G. Kresse and D. Joubert, Phys. Rev. B 59, 1758 (1999).
[42] J. P. Perdew, A. Ruzsinszky, G. I. Csonka, O. A. Vydrow, G. E. Scuseria, L. A. Constantin, Z.
Zhou, and K. Burke, Phys. Rev. Lett. 100, 136406 (2008).
[43] H. J. Monkhorst and J. D. Pack, Phys. Rev. B 13, 5188 (1976).
[44] A. Mujica, A. Rubio, A. Muñoz, and R. J. Needs, Rev. Mod. Phys. 79, 863 (2003).
[45] K. Parlinski, Computer Code PHONON. See: http://wolf.ifj.edu.pl/phonon
[46] D. Errandonea, J. Pellicer-Porres, D. Martínez-García, J. Ruiz-Fuertes, A. Friedrich, W.
Morgenroth, C. Popescu, P. Rodríguez-Hernández, A. Muñoz, and M. Bettinelli, J. Phys. Chem. C
120, 13749 (2016).
[47] D. Errandonea, R. S. Kumar, S. N. Achary, and A. K. Tyagi, Phys. Rev. B 84, 224121 (2011).
[48] F. Birch, J. Geophys. Res. 83, 1257 (1978).
[49] R.J. Angel, Rev. Mineral. Geochem. 41, 35 (2000).
[50] K.S. Kight, Phys. Chem. Miner. 37, 529 (2010).
http://dx.doi.org/10.1155/2012/617528
[52] D. Errandonea, A. Muñoz, P. Rodríguez-Hernández, O. Gomis, S. N. Achary, C. Popescu, S.
J. Patwe, and A. K. Tyagi, Inorg. Chem. 55, 4958 (2016).
[53] M. T. Dove, Am. Mineral. 82, 213 (1997).
[54] D. Errandonea, J. Pellicer-Porres, M. C. Pujol, J. J. Carvajal, M. Aguiló, J. Alloys Compd. 638,
14 (2015).
[55] T. Huang, S. R. Shieh, A. Akhmetov, X. Liu, C. M. Lin, and J. S. Lee, Phys. Rev. B 81,
214117 (2010).
[56] P. Botella, R. Lacomba-Perales, D. Errandonea, A. Polian, P. Rodríguez-Hernández, and A.
Muñoz, Inorg. Chem. 53, 9729 (2014).
[57] R. Lacomba-Perales, D. Errandonea, D. Martinez-Garcia, P. Rodríguez-Hernández, S.
Radescu, A. Mujica, A. Muñoz, J. C. Chervin, and A. Polian, Phys. Rev. B 79, 094105 (2009).
[58] D. Errandonea and F.J. Manjon, Materials Research Bulletin 44, 807 (2009).
[59] O. Gomis, J. A. Sans, R. Lacomba-Perales, D. Errandonea, Y. Meng, J. C. Chervin, and A.
Polian, Phys. Rev. B 86, 054121 (2012).
[60] R. Vilaplana, R. Lacomba-Perales, O. Gomis, D. Errandonea, and Y. Meng, Solid State
Sciences 36, 16 (2014).
[61] K. Ruschel, L. Nasdala, A. Kronz, J. M. Hanchar, D. M. Többens, R. Škoda, F. Finger, and A.
Möller, Miner Petrol 105, 41 (2012).
[62] F. D. Saccone, S. Ferrari, D. Errandonea, F. Grinblat, V. Bilovol, and S. Agouram, J. Appl.
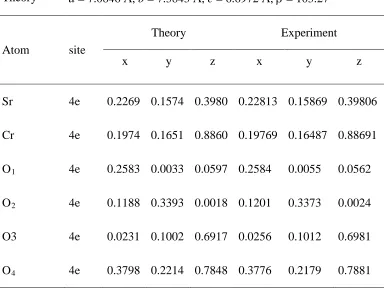
Table I: Structural parameters of the monazite structure (P21/n) at ambient pressure.
Experiment a = 7.065(7) Å, b = 7.376(7) Å, c = 6.741(7) Å, β = 103.1(1)º
Theory a = 7.0846 Å, b = 7.3843 Å, c = 6.6972 Å, β = 103.27º
Atom site
Theory Experiment
x y z x y z
Sr 4e 0.2269 0.1574 0.3980 0.22813 0.15869 0.39806
Cr 4e 0.1974 0.1651 0.8860 0.19769 0.16487 0.88691
O1 4e 0.2583 0.0033 0.0597 0.2584 0.0055 0.0562
O2 4e 0.1188 0.3393 0.0018 0.1201 0.3373 0.0024
O3 4e 0.0231 0.1002 0.6917 0.0256 0.1012 0.6981
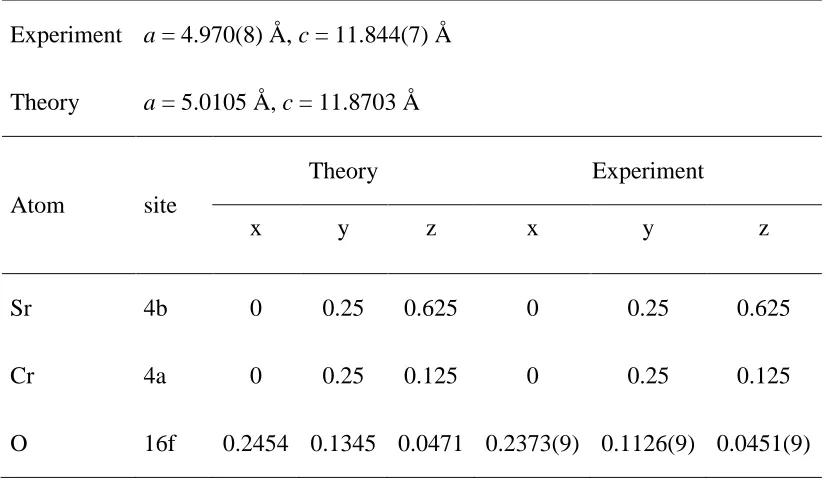
Table II: Structural parameters of the scheelite structure (I41/a) at 9.8 GPa (theory) and 9.4 GPa
(experiments).
Experiment a = 4.970(8) Å, c = 11.844(7) Å
Theory a = 5.0105 Å, c = 11.8703 Å
Atom site
Theory Experiment
x y z x y z
Sr 4b 0 0.25 0.625 0 0.25 0.625
Cr 4a 0 0.25 0.125 0 0.25 0.125
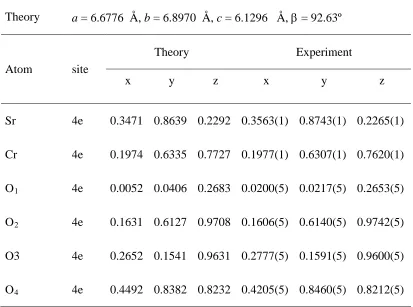
[image:26.595.92.505.123.364.2]Table III: Structural parameters of the AgMnO4 structure (P21/n) at 13.2 GPa (theory) and 13.3
GPa (experiments).
Experiment a = 6.680(8) Å, b = 6.881(8) Å, c = 6.118(8) Å, β = 92.33(9)º
Theory a = 6.6776 Å, b = 6.8970 Å, c = 6.1296 Å, β = 92.63º
Atom site
Theory Experiment
x y z x y z
Sr 4e 0.3471 0.8639 0.2292 0.3563(1) 0.8743(1) 0.2265(1)
Cr 4e 0.1974 0.6335 0.7727 0.1977(1) 0.6307(1) 0.7620(1)
O1 4e 0.0052 0.0406 0.2683 0.0200(5) 0.0217(5) 0.2653(5)
O2 4e 0.1631 0.6127 0.9708 0.1606(5) 0.6140(5) 0.9742(5)
O3 4e 0.2652 0.1541 0.9631 0.2777(5) 0.1591(5) 0.9600(5)
O4 4e 0.4492 0.8382 0.8232 0.4205(5) 0.8460(5) 0.8212(5)
[image:27.595.92.505.162.469.2]Table IV: EOS parameters and components of the compressibility tensor of the three different phases of SrCrO4. These components have been calculated at 0 GPa for the monazite structure, at
8.2 GPa for the scheelite structure, and at 12.4 GPa for the AgMnO4 structure.
Monazite Scheelite AgMnO4
V0 (Å3) 341(1) 329(1) 327(1)
B0 (GPa) 59(1) 66(2) 69(3)
B0’ 4.9(5) 4.8(5) 4.5(5)
β11 (10-3 GPa-1) 6.77 3.06 2.63
β22 (10-3 GPa-1) 5.53 3.06 2.56
β33 (10-3 GPa-1) 5.12 2.72 2.79
[image:28.595.58.540.144.372.2]Table V: Ambient pressure experimental and calculated wavenumbers (ω) for Raman modes of monazite-type SrCrO4 (in cm−1) including mode assignment. The pressure coefficients (dω/dP) are
also reported (in cm-1/GPa) as well as the Grüneisen parameters (γ). The relative difference between measured and calculated frequencies (Rω) is also given (in %).
Mode
Theory Experiments
ω dω/dP γ ω dω/dP γ Rω
Ag 58.4 -0.7 -0.71 ---- ---- ----
----Bg 64.8 2.2 2.00 67 1.7 1.50 -3.3
Ag 76.6 -2.0 -1.54 78 -0.6 -0.45 -1.8
Ag 91.7 -1.0 -0.64 89 -0.1 -0.07 3.0
Bg 92.2 0.2 0.13 94 0.8 0.50 -1.9
Ag 106.6 1.9 1.05 108 3.2 1.75 -1.3
Bg 109.7 2.2 1.18 ---- ---- ----
----Bg 114.4 2.0 1.03 114 1.4 0.72 0.3
Bg 119.4 5.0 2.47 ---- ----
----Ag 122.7 2.5 1.20 127 4.2 1.95 -3.4
Ag 130.3 3.5 1.58 136 2.3 1.00 -4.2
Bg 155.0 5.1 1.94 144 3.3 1.35 7.6
Ag 158.7 5.3 1.97 161 4.9 1.80 -1.4
Bg 174.7 5.8 1.96 177 ---- ---- -1.3
Bg 184.4 6.1 1.95 181 ---- ---- 1.9
Bg 192.1 6.3 1.93 187 ---- 2.7
Ag 192.4 4.9 1.50 196 5.0 1.51 -1.8
Ag 197.4 6.7 2.00 211 ---- -6.4
Bg 333.6 0.6 0.11 334 0.6 0.11 -0.1
Ag 344.2 1.8 0.31 342 1.7 0.29 0.6
Bg 349.0 1.3 0.22 350 1.8 0.30 -0.3
Ag 359.9 1.2 0.20 364 1.3 0.21 -1.1
Ag 367.1 2.7 0.43 367 ---- ---- 0.0
[image:29.595.87.506.192.772.2]Ag 391.8 3.7 0.56 398 3.0 0.44 -1.6
Bg 399.2 2.7 0.40 403 3.3 0.48 -0.9
Bg 423.2 1.9 0.26 424 2.0 0.28 -0.2
Ag 429.1 2.3 0.32 432 2.8 0.38 -0.7
Bg 901.4 4.1 0.27 859 5.3 0.36 4.9
Ag 904.2 4.1 0.27 868 3.9 0.27 4.2
Ag 910.2 4.4 0.29 890 4.9 0.32 2.3
Ag 933.9 5.3 0.33 894 4.8 0.32 4.5
Bg 938.7 4.2 0.26 918 4.4 0.28 2.2
Ag 941.1 4.6 0.29 932 4.7 0.30 1.0
Bg 959.7 4.2 0.26 951 0.9
Table VI: Experimental and calculated wavenumbers (ω) determined at 8.9 GPa for Raman modes of scheelite-type SrCrO4 (in cm−1) including mode assignment. The pressure coefficients (dω/dP)
are also reported (in cm-1/GPa) as well as the experimental Grüneisen parameters (γ). The relative difference between measured and calculated frequencies (Rω) is also given (in %).
Mode
Theory Experiments
ω dω/dP γ ω dω/dP γ Rω
Eg 73.6 -3.8 -3.41 72 -2.2 -1.83 2.2
Bg 124.9 0.3 0.16 127 2.9 1.37 -1.6
Eg 164.8 2.7 1.08 162 2.5 0.93 1.7
Ag 175.2 3.2 1.21 ---- ---- ----
----Bg 219.3 5.8 1.75 221 2.9 0.79 -0.8
Eg 257.5 3.7 0.95 255 5.4 1.27 1.0
Bg 375.1 1.7 0.30
381 2.6 0.41 -1.5
Ag 375.4 2.2 0.39
Bg 394.4 1.2 0.20 401 3.7 0.55 -1.6
Eg 422.5 1.8 0.28 431 3.3 0.46 -2.0
Eg 932.7 4.9 0.35 888 5.5 0.37 5.0
Ag 936.9 2.9 0.20 898 5.5 0.37 4.3
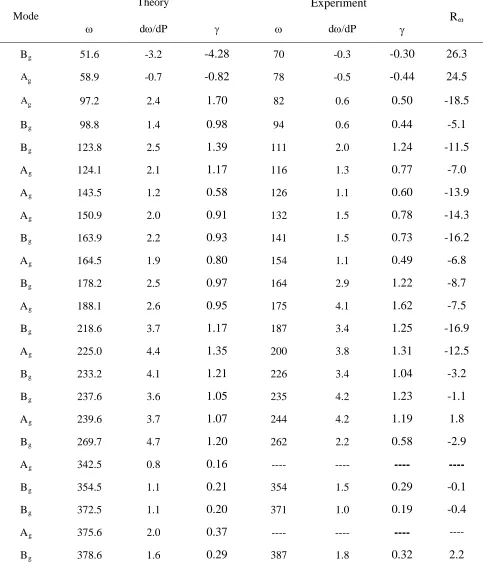
Table VII: Experimental and calculated wavenumbers (ω) determined at 11.7 GPa for Raman modes of AgMnO4-type SrCrO4 (in cm−1) including mode assignment. The pressure coefficients
(dω/dP) are also reported (in cm-1/GPa) as well as the experimental Grüneisen parameters (γ). The column on the right-hand side shows the relative difference (in %) between calculated and measured wavenumbers.
Mode
Theory Experiment
Rω
ω dω/dP γ ω dω/dP γ
Bg 51.6 -3.2 -4.28 70 -0.3 -0.30 26.3
Ag 58.9 -0.7 -0.82 78 -0.5 -0.44 24.5
Ag 97.2 2.4 1.70 82 0.6 0.50 -18.5
Bg 98.8 1.4 0.98 94 0.6 0.44 -5.1
Bg 123.8 2.5 1.39 111 2.0 1.24 -11.5
Ag 124.1 2.1 1.17 116 1.3 0.77 -7.0
Ag 143.5 1.2 0.58 126 1.1 0.60 -13.9
Ag 150.9 2.0 0.91 132 1.5 0.78 -14.3
Bg 163.9 2.2 0.93 141 1.5 0.73 -16.2
Ag 164.5 1.9 0.80 154 1.1 0.49 -6.8
Bg 178.2 2.5 0.97 164 2.9 1.22 -8.7
Ag 188.1 2.6 0.95 175 4.1 1.62 -7.5
Bg 218.6 3.7 1.17 187 3.4 1.25 -16.9
Ag 225.0 4.4 1.35 200 3.8 1.31 -12.5
Bg 233.2 4.1 1.21 226 3.4 1.04 -3.2
Bg 237.6 3.6 1.05 235 4.2 1.23 -1.1
Ag 239.6 3.7 1.07 244 4.2 1.19 1.8
Bg 269.7 4.7 1.20 262 2.2 0.58 -2.9
Ag 342.5 0.8 0.16 ---- ---- ----
----Bg 354.5 1.1 0.21 354 1.5 0.29 -0.1
Bg 372.5 1.1 0.20 371 1.0 0.19 -0.4
Ag 375.6 2.0 0.37 ---- ---- ----
[image:32.595.59.542.211.785.2]Ag 390.6 2.0 0.35 395 2.8 0.49 1.1
Bg 391.0 0.8 0.14 411 1.9 0.32 4.9
Ag 430.4 1.7 0.27 419 1.4 0.23 -2.7
Bg 439.2 2.5 0.39 434 2.2 0.35 -1.2
Ag 442.7 2.7 0.42 445 3.0 0.47 0.5
---- ---- ---- ---- 852 2.2 0.18
--- ---- ---- ---- 890 2.6 0.20
----Ag 926.8 2.5 0.19 904 2.9 0.22 -2.5
Bg 934.3 2.3 0.17 918 3.7 0.28 -1.8
Ag 951.6 2.8 0.20 927 3.3 0.25 -2.7
Ag 964.4 3.1 0.22 933 3.7 0.27 -3.4
Bg 979.8 3.0 0.21 954 3.2 0.23 -2.7
Bg 981.6 3.2 0.22 969 2.9 0.21 -1.3
Ag 997.1 3.5 0.24 996 3.3 0.23 -0.1
Figure 1: (color online) Schematic view of the low-pressure and high-pressure polymorphs of
SrCrO4. Sr atoms: green. Cr atoms: blue. Oxygens: red. The coordination polyhedra of Sr and Cr
[image:34.595.71.529.241.479.2]Figure 2: (color online) Calculated enthalpy difference versus pressure for the three relevant
[image:35.595.132.419.181.428.2]Figure 3: (color online) Selection of XRD patterns at different pressures. Dots: experiments (at
20.4 the experiment is shown as a line). Solid lines are the refinements and residuals at all pressure
with the exception of 20.4 GPa. Ticks show the position of Bragg reflections. Different colors have
[image:36.595.120.440.183.754.2]Figure 4: Pressure dependence of the unit-cell parameters and volume. Symbols correspond to
experiments: Circles: monazite phase. Squares: scheelite phase. Diamonds: AgMnO4 phase. Solid
[image:37.595.92.477.177.749.2]Figure 5: (color online) Raman spectra measured at various pressures up to 8.2 GPa using MEW
as pressure-transmitting medium. Ticks identify the most intense Raman modes of the
[image:38.595.57.570.217.496.2]Figure 7: (color online) Raman spectra measured at various pressures from 8.9 GPa to 15.7 GPa
using MEW as pressure medium. Different phases are identified with different colors. Ticks
[image:39.595.56.572.217.494.2]Figure 7: (color online) Pressure dependence of the Raman modes of the different phases of
SrCrO4. Black squares: monazite phase. Red circles: scheelite phase. Blue diamonds: AgMnO4
[image:40.595.29.573.192.460.2]Figure 8: (color online) Absorption spectra of SrCrO4 at selected pressures. The arrows point to
[image:41.595.78.478.221.523.2]Figure 9: (color online) Pressure dependence of the band-gap energy of SrCrO4. Black circles:
monazite phase. Red squares: scheelite phase. Blue diamonds: AgMnO4 phase. Solid lines show the
[image:42.595.86.460.217.513.2]