www.ijsernet.org Page 1
EFFECTS OF TABLET PCS ON STUDENTS’ LEARNING IN AN
INTRODUCTORY STATISTICS COURSE
Wei Wei1,* and Zhi Qiao2
1Mathematics & Statistics Department, Metropolitan State
University, Saint Paul, MN 55106, U.S.A.
2Kaiser Permanente, 2000 Broadway, Oakland, CA 94612, U.S.A.
ABSTRACT
Tablet PCs offer an alternative to the traditional chalk-board lectures. With Tablet PCs, instructors can write on PowerPoint slides during lecture. This offers real-time response between the instructor and students. This paper compares students’ learning outcomes using four different types of lectures: traditional chalk-board lecture, PowerPoint presentation only, PowerPoint with chalk and board, and PowerPoint with Tablet PC. We found that students’ average quiz scores from PowerPoint with Tablet lectures are significantly higher than average quiz scores from all other types of lectures. In the end-of-semester survey, student responses showed that they liked the PowerPoint with Tablet lectures significantly better than other types of lectures and they felt that they learned the best with the Tablet lectures.
Keywords: Tablet PC, PowerPoint, Chalk-Board, Introductory Statistics
Introduction
Traditional lectures were given mostly using chalk and board. With the development of technology, different tools were applied in lectures, for example, PowerPoint slides, overhead transparencies and Tablet PCs.
PowerPoint presentations offered better visualization of class materials and provided better outline of the materials before class than the traditional chalk-board approach. Carefully designed PowerPoint presentations helped students to learn and motivated students’ learning (Bartsch & Cobern, 2003, Lari 2014). However, it was less flexible for PowerPoint presentations as they were set in advance before class, preventing modifications to respond to students’ questions during lecture time. The supplement of using chalk and board to PowerPoint presentations could potentially solve the problem. But there were some limitations of this approach: board has limited space; instructor may block students while writing on the board; and the writing on a board may not be well connected to the slides. One possible solution is to use Tablet PC as a supplement tool to write notes on PowerPoint slides while lecturing (Bilder & Malone 2008).
www.ijsernet.org Page 2 invented tools that allow instructors to provide students logical steps of solving a problem, utilize visual aids, and post in-class materials online for review. Lecturing using Tablet PCs helped to incorporate instructor annotations with visualization, made the instructor able to face the class, and did not obstruct the view of the materials as it was presented (Brophy & Walker, 2005). Teaching with Tablet PCs made the lecture dynamic and motivated students to learn (Cicchino & Mirliss 2004, Loch & Donovan 2006). The use of Tablet PC helped to improve performance of students as it provided an interactive engaging classroom environment (Bilder & Malone 2008, Amelito 2009, and Robson & Kennedy 2013).
Regarding to students’ learning experiences, studies have shown that Tablet PC use enhanced student learning experience (Berque et al. 2006, Bilen et al. 2008). Studies have reported that lecturing with Tablet PCs supported and benefited all learning styles (Kothaneth et al. 2012). Tablet PCs have improved students’ attendance, performance, and retention in STEM field (Romney, 2011). Romney (2011) reported that students who began their undergraduate mathematics education in the Tablet PC classes were more likely to stay in the STEM field than students without Tablet PC facilitating their first year classes.
From an instructor point of view, the Tablet PC enabled the instructor to combine the features of traditional chalk-board lectures and multimedia techniques (Frolic and Zurn, 2004). It has been reported that Tablet PCs supported instructors demonstrating the problem solving process, providing visual aids, and helping to keep a record of the materials (Chen et al. 2008).
In this paper, we investigated whether lecturing using PowerPoint and Tablet enhanced student learning, and compared the students’ performance among four types of lectures: 1) traditional chalk-board lecture; 2) PowerPoint presentation only; 3) PowerPoint with chalk-board; and 4) PowerPoint with Tablet.
Materials and Methods
Classroom environment
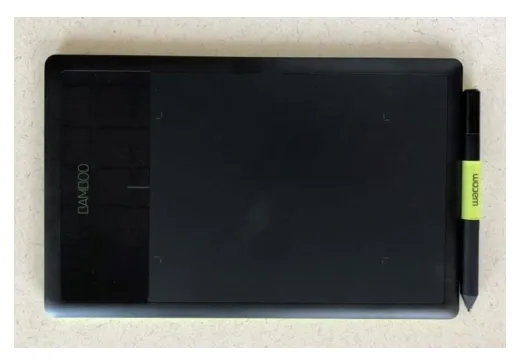
www.ijsernet.org Page 3 Figure 1. Bamboo Pen and Touch slate-style Tablet.
Types of lectures
Four types of lectures were given throughout the whole semester: chalk-board, PowerPoint only, PowerPoint with chalk-board, and PowerPoint with Tablet. The chalk-board lecture was the traditional lecturing method that instructors write class materials on the board. PowerPoint only lectures included only PowerPoint slides without using any other tools to facilitate teaching. PowerPoint with chalk-board lectures showed most teaching materials on PowerPoint slides with writing on the board to facilitate explanations of the materials. PowerPoint with Tablet lectures showed most of the materials on PowerPoint slides and the instructor explained the materials with writing on the slides using the Tablet. Figure 2 provided an example of the lecture slide with the writings using Tablet.
www.ijsernet.org Page 4 Teaching Methods
A total of seventy students, thirty-seven from section one and thirty-three from section two, agreed to participant in this study. The course met three times a week for fifty minutes. The semester was fifteen weeks long.
The instructor taught ten modules throughout the whole semester. Each module covered about one chapter of the textbook. The four lecture types were randomly assigned to two or three of those modules. The same lecture style was used across one entire module. The arrangements of types of lectures are: PowerPoint only lectures were applied to module 1, 2 and 5; chalk-board lectures were applied to module 3, 4 and 7; PowerPoint with chalk-board lectures were used in module 6 and 8; and the PowerPoint with Tablet lectures were used in module 9, 10 and 11. The lecture type arrangements were the same for both sections. Besides the lecture type difference, there were no other pedagogical differences between modules.
Survey and quiz data collection
At the end of each module, a fifteen-minute quiz and a short survey were given in class. The quiz for each module included multiple choice and short answer questions. The survey after each module was composed of two questions: “How much do you think you learned from the module?” and “Do you like the lecture style of the module?” Students rated the first question using a 1-5 scale with 1 indicating a large amount of information, 2 indicating a fair amount of information, 3 indicating neutral, 4 indicating a small amount of information and 5 indicating nothing at all. Students rated the second question using a 1-5 scale with 1 indicating very much, 3 indicating neutral, and 5 indicating not at all.
At the end of the semester, a survey with three attitude questions was given to the students. Those questions are “Which one of the following lecture style do you like mostly?”, “You learned the best when using……”, and “Please write the pros and cons about Tablet lectures”. For the first two multiple choice questions, the four lecture styles were given as the options, listed as a) chalk-board, b) PowerPoint only, c) PowerPoint with chalk-board, and d) PowerPoint with Tablet.
Data analysis
Quiz scores were firstly converted to percentage for each student. Quiz grades were summarized for each type of lecture. Statistical measurements of mean, standard deviation and 95% confidence intervals of each lecture type were calculated. A 2 (section) by 2 (lecture style) analysis of variance (ANOVA) was performed to compare mean quiz grades among the four lecture types and between the two sections.
www.ijsernet.org Page 5 opinion. The number of positive opinions and negative opinions were summarized for each lecture type. A Chi-square test of independence was performed to investigate whether the type of opinion is significantly associated with the lecture type. The percentage of positive and negative opinions was plotted for each lecture type.
For each of the two multiple choice questions of the end of semester survey, the number of preference of each lecture type was summarized for the two sections, and a Chi-square goodness-of-fit test was performed to see whether the four types of lecture were equally like preferred and whether students felt they learned equally among the four types of lectures.
We used an alpha level of 0.05 for all statistical tests. All the analyses were conducted using the IBM SPSS Statistics 24.0 software (IBM Corp. Armonk, NY).
Results
Quiz results
Average quiz scores were compared among the four types of lectures. The 2 (type of lecture) by 2 (section) ANOVA showed a significant mean difference between the two sections (F(1,760)=5.44, p-value=0.02), a significant mean difference among the four types of lectures (F(3,760)=38.10, p-value<0.001), and a significant interaction between section and lecture type (F(3, 760)=4.35, p-value=0.005). The Tukey multiple comparisons showed significant mean differences between PowerPoint with Tablet lecture and traditional chalk-board lecture (p-value <0.001), between PowerPoint with Tablet lecture and PowerPoint only lecture (p-value <0.001), and between PowerPoint with Tablet and PowerPoint with chalk-board lecture (p-value <0.001). The PowerPoint with chalk-board lecture was also significantly different from the traditional chalk-board lecture (p-value=0.001), and the PowerPoint only lecture (p-value<0.001). There was no significant difference between traditional chalk-board and PowerPoint only lectures (p-value=0.992).
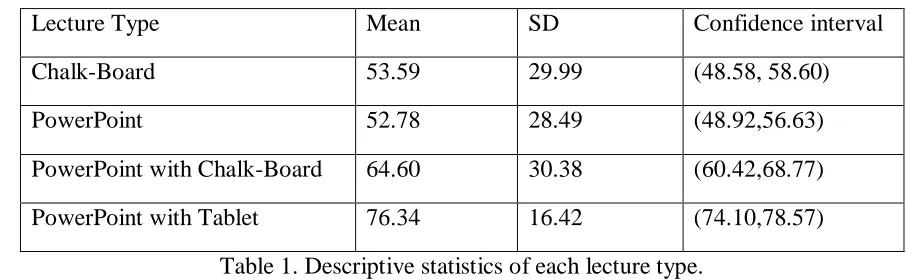
Table 1 listed the mean, standard deviation, and 95% confidence interval of quiz scores for each lecture type. Table 1 showed that the average quiz score was the highest when using PowerPoint
with Tablet lectures. The lowest average quiz score was from the PowerPoint only lecture.
Lecture Type Mean SD Confidence interval
Chalk-Board 53.59 29.99 (48.58, 58.60)
PowerPoint 52.78 28.49 (48.92,56.63)
PowerPoint with Chalk-Board 64.60 30.38 (60.42,68.77)
PowerPoint with Tablet 76.34 16.42 (74.10,78.57)
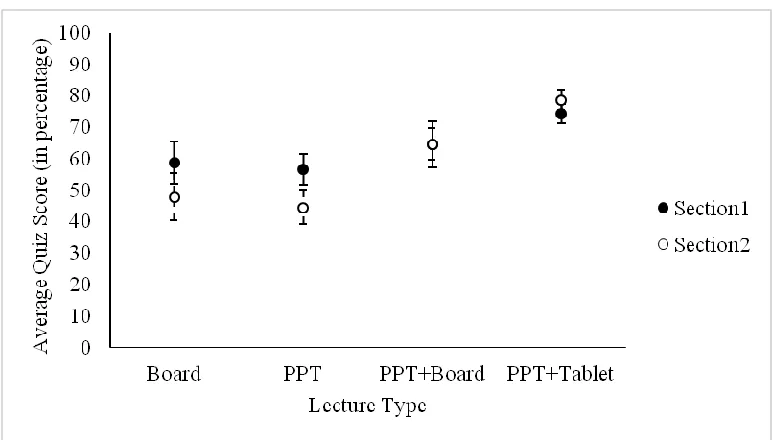
www.ijsernet.org Page 6 Figure 3 showed the average score after the PowerPoint with Tablet lectures were significantly higher than the average scores of all other three types of lectures for both of the two sections. Figure 3 also showed an interaction between section and lecture type: the average scores of section one were significantly higher than those of section two after the traditional chalk-board lecture and PowerPoint only lecture; the average score of section one after PowerPoint with chalk-board lecture was almost the same as the average score of section two for the same type of lecture; and the mean from the PowerPoint with Tablet lecture for section one was significantly lower than the mean of the same type of lecture for section two.
For both sections, the mean scores from the PowerPoint with Tablet lecture were the highest, the mean scores from PowerPoint with chalk-board were the second highest, and the mean scores from the PowerPoint only lecture were the lowest (Figure 3)
Figure 3. Average quiz scores for both sections for the four types of lectures. The dark circles represent average score of section 1, and the white circles represent average score of section two.
The error bars represent the 95% confidence intervals.
Module survey results
www.ijsernet.org Page 7 Figure 4. The percentage of positive responses to module survey question one.
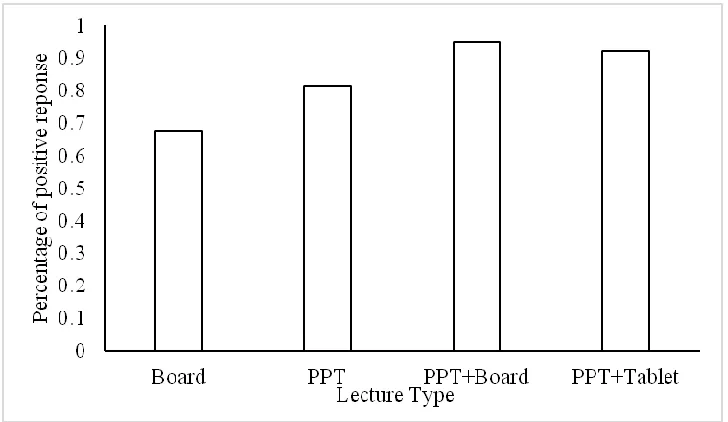
For the second question of the module survey “Do you like the lecture style of the module?”, the Chi-square test showed that there is a significant association between opinion and type of lecture ( [3,160]=13.43, p-value=0.004). That means the percentage of positive responses were significantly different among the four types of lectures. Figure 5 showed the proportion of positive opinions from the four types of lectures.
www.ijsernet.org Page 8 The percentages of positive responses from the PowerPoint with Tablet lecture and PowerPoint with chalk-board were higher than those from traditional chalk-board lecture and PowerPoint only lecture. The proportion of positive responses were not significantly different between PowerPoint with Tablet and PowerPoint with chalk-board lectures ( [1, 77]=0.24, p-value=0.62). The proportion of positive response from PowerPoint with Tablet lecture was significantly higher than that of the traditional chalk-board lecture ( [1, N=51] =7.24, p-value=0.007).
Based on the module survey results, students did not feel that they have learned differently from different lecture styles in the middle of the semester, but they did show a preference of the PowerPoint with Tablet lecture and the PowerPoint with chalk-board lecture.
End of semester survey results
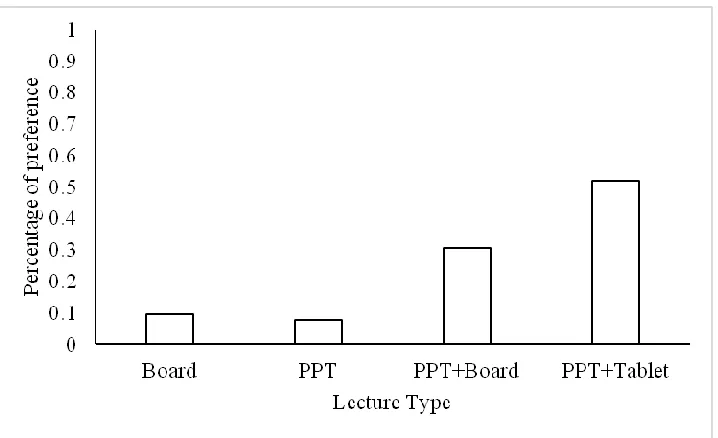
For the first question of the end-of-semester survey, “Which one of the following lecture style do you like mostly?”, the Chi-square goodness-of-fit test showed that at least one lecture type was preferred significantly differently from the others ( [3, N=52] =26.92, p-value<0.001). The proportion of preference for PowerPoint with Tablet lecture was the highest among all lecture styles (figure 6).
Figure 6. The proportion of choice of each lecture type for the end of semester survey question one. The height of each bar represents the proportion of students choosing that option.
www.ijsernet.org Page 9 Figure 7. The percentage of each choice of lecture type for the end of semester survey questions
two. The height of each bar is the percentage of choosing that type of lecture.
Conclusion and Discussion
Based on our quiz and survey results, we found that students’ performance was significantly better when lectured using PowerPoint slides with Tablet. PowerPoint slides provided information of preview and overview the lecture for students (Chen & Lin, 2008). With the use of Tablet, the instructor was able to provide enough explanations while writing on the slides. With the PowerPoint slides with notes written using Tablet saved at the end of the lecture, students were better focused during lecture (Walker et al. 2008).
Students liked the PowerPoint with Tablet lecture significantly better than the other types of lectures based on the end of semester survey, although the module survey showed that students liked the PowerPoint with chalk-board lecture the best, but not significantly different from the PowerPoint with Tablet lecture. The discrepancy between the end of semester survey and ratings taken immediately after lectures was also observed in Bartsch & Cobern, 2003, relating to students’ preference between PowerPoint presentations and overhead transparencies. During the semester, without an overall impression of all types of lectures, students’ opinion toward a certain lecture type may be biased. Students did show better preference to the PowerPoint with Tablet lecture than the PowerPoint only and traditional Board-chalk lecture for both the module survey and the end of semester survey.
www.ijsernet.org Page 10 Acknowledgement
The authors wish to acknowledge the support of data collection at the Center for Learning Innovation at University of Minnesota Rochester, Rochester, MN, U.S.A.
References
Amelito, G.E. (2009) Using Tablet PCs to enhance student performance in an introductory circuit’s course. Proceedings: American Society of Engineering Education / Pacific Southwest Section Conference, San Diego, CA, March 19-20, 32-43.
Bartsch, A. R., and Cobern, M. K., (2003) Effectiveness of PowerPoint presentations in lectures. Computers & Education. 41, 77-86.
Berque, D., Prey, J., and Reed, R. (2006). The impact of Tablet PCs and pen-based technology on education: vignettes, evaluations, and future directions. Purdue University Press, West Lafayette, IN, USA.
Bilder, R. C. & Malone, J. C., (2008) Tablet PC Applications in Statistics Education, Part I. 2008 Proceedings of the American Statistical Association, Section on Statistics Education, Alexandria, VA: American Statistical Association, 2813-2820.
Bilen, G. S., Lee, D., Messner, I. J., Nguyen, T. H., Simpson, W. T., Techatassanasoontorn, A. A., and Devon, F. R. (2008). Tablet PC use and impact on learning in technology and engineering classrooms: a preliminary study. The Impact of Tablet PCs and Pen-Based Technology on Education: Evidence and Outcomes, 2008, 2008: p.11.
Brophy, P. S., and Walker, D. G., (2005) Case study of the pedagogical impact of tablet PCs as a presentation medium in large-scale engineering classrooms. Proceedings of the 2005 American Society for Engineering Education Annual Conference & Exposition: The Changing Landscape of Engineering and Technology Education in a Global World. pp. 1567-1577.
Chen, F., Sager, J., Corbitt, G., and Sandoe, K. (2008) The effects of using a Tablet PC on teaching and learning processes. Americas Conference on Information System
(AMCIS) 2008 Proceedings. 262. http://sisel.aisnet.org/amcis2008/262.
Chen J., and Lin T., (2008) Does downloading PowerPoint slides before the lecture lead to better student achievement? International Review of Economics Education. 7 (2) pp. 9-18
www.ijsernet.org Page 11 Frolik, J., and Zurn, B. J. (2004) Evaluation of Tablet PCs for engineering content development and instruction. Proceedings of the 2004 American Society for Engineering Education Annual Conference & Exposition. Section 1620
Kothaneth, S., Robinson, A., and Amelink, C. (2012) Tablet PC support of students’ learning styles. Journal of Systemics, Cybernetics & Informatics, 10 (6).
Lari, F. S. (2014) the impact of using PowerPoint presentations on students’ learning and motivation in secondary schools. International Conference on Current Trends in ELT 2014: 1672-1677
Loch, B. and Donovan, D. (2006) Progressive teaching of mathematics with tablet technology. e-Journal of Instructional Science and Technology, 9 (2).
Robson, D. and Kennedy, D. (2013) Using Tablet PCs for active learning: learning from other’s mistakes. In: V Steinle, L Ball & C Bardini (eds.) Mathematics Education, Study,
Today, and Tomorrow (Proceedings of the 36th Annual Conference of the
Mathematics Education Research Group Australasia). Melbourne, VIC: MERGA (Mathematics Education Research Group of Australasia, Inc.).
Romney, C. A., (2011) Tablet PC use in freshman mathematics classes promotes STEM retention. Proceedings of the 41st annual Frontiers in Education Conference, F1J-1-F1J-7.