Research Journal
Volume 11, Issue 3, September 2017, pages 31–47
DOI: 10.12913/22998624/70762 Research Article
THE EVALUATION OF THE REDUCTION OF SEISMIC RESPONSE
OF ADJACENT STRUCTURES USING VISCOUS DAMPER JOINTS
Hamed Karbalay Malek1, Kamal Emami2
1 Department of Civil Engineering, Shabestar Branch, Islamic Azad University, Shabestar, Iran, e-mail: civil.eng. [email protected]
2 Department of Civil Engineering, Shabestar Branch, Islamic Azad University, Shabestar, Iran, e-mail: [email protected]
ABSTRACT
This study examines the effects of common viscose damper on the behavior of adja
-cent reinforced concrete structures. For this purpose, three reinforced concrete build
-ings with 3, 5 and 7 floors and a regular plan were selected and were compared in two cases with and without viscous dampers at the seams. They are designed based on discussions of Buildings Regulations 2800 and the 6 and 9 issues of Iranian National Building Regulations. Those buildings that were under the analysis of accelerograms of Bam, Mangil and El Centro, are then analyzed with nonlinear modal time history. The accelerograms before applied to the structures are scaled based on the 2800 Regu
-lations. Those buildings were modeled by SAP2000 finite element modeling software. Linear behavior of structural components of said structure and the non-linear behavior of viscous dampers were modeled. Finally, the seismic response of the buildings in
-cludes the base shear force, up to a maximum lateral acceleration of seismic classes. Classes for both with and without the viscous damper have been extracted and com
-pared. The results showed the reduction in relative lateral displacement, maximum acceleration and base cut applied to a structure in the presence of viscous dampers be
-tween two structures. This decline is not even in the direction that the viscous damper is viewed as significant.
Keywords: viscous damper, drift, maximum acceleration, cutting foundations, rein
-forced concrete structure, seismic analysis.
INTRODUCTION
Earthquake risk is always lurking in any structure where they are prevalent. The conse -quences of this risk, depending on the physical effects caused by the structural failure, can be unpredictable. Braced Frames. braced and shear walls are both economic and effective to control deformation and adverse effects of weak earth -quakes but do not have the desired behavior dur -ing severe earthquakes in these kinds of structure. Firstly, the stiffness of the structures is high and they tend to absorb more seismic forces. Second
-ly, energy dissipation capacity due to the injuries sustained during the earthquake load resisting el -ements of reciprocating motion, (hysteresis), suf -fered severely and power dissipation is reduced as quickly in the next cycle.
Therefore, there is a vital need to waste en -ergy dissipation during earthquakes so that its be -havior under dynamic loading is not affected and is highly effective in terms of economic sense. Fluid viscous dampers are a means of energy loss incurred. Therefore, the amount of movement between two adjacent structures during an earth -quake is of high importance.
One way to reduce seismic retrofitting of structures in seismic lateral force is the use of dampers. During an earthquake, the structure re -ceives a lot of energy. This is both kinetic and potential energy (strain) is applied to structure and it is absorbed or dissipated. If the structure is free of damping, its vibration will be continu -ous, but because there is damping in materials, vibration is reduced [1]. Input energy of struc -tural earthquake statements introduced in the equation (1) becomes:
(1) In the above equation earthquake input en -ergy, Ek is kinetic energy, Es is reversible strain energy in the elastic range, Eh is wasted energy due to inelastic deformation and Ed is wasted en-ergy and is due to the additional damper.
Increased damping reduces the structural response (acceleration and change of location). Increasing the damping at low rotations (close to zero) has no effect on the amount of spectrum and the high rotations little effect on the accel -eration replies.Two different philosophies for the design of earthquake-resistant structures ex -ist [2]:
• (A) Designed such that the ductile deforma -tion structures under severe earthquakes suf -fered substantial and dissipate seismic energy through the non-linear behavior.
• (B) Increasing the damping of structures with the use of mechanical dampers and earth -quake energy dissipation without causing significant damage to structural components.
In the second type of design rather than en -ergy flow and damage caused by deformations and vibration damper member amortized been written. The use of dampers in addition to ac -cretion energy dissipation capability reduces the structural response to the earthquake and thus damage to non-structural components.
The base isolation systems, use of energy dissipation systems, have had a special place. An increase of damping is possible using vari -ous methods such as the flow soft metal, metal friction on the overall movement of a piston in -side a slime or viscos-elastic environment with behavior in the same elastic material.
DAMPING
Due to the structural dynamic equation (1), in more traditional design methods, structures
called damper are not observed. Therefore, by defining a new member in structures as a damp -er, where seismic energy dissipation factor en -ters into a building and applying it to buildings, construction can be optimized against a variety of dynamic loads caused by earthquakes [2].
Due to the dynamic nature of the earthquake and free body structure formula to move one de -gree of freedom system under dynamic load P
can be written:
(2) where: M − mass of the structure, K − structural
stiffness, C − damping, U − displace -ment, Ù − Speed structures, Ü − struc -tural acceleration, P − dynamic force structures.
To reduce the force exerted on the structure U value must be reduced, and the structure of short-term high vibration is prevented. It is obvi -ous that by increasing the damping in equation (2) structural displacement is reduced.
The amount of displacement of structures (U) is:
(3) Two parameters have a major role in this equation: ξ − the ratio of the actual damping coefficient to critical damping coefficient struc -tures; ω − the natural frequency of the structure can be obtained from the equation ω = √K/M.
By increasing ξ the maximum amount of U is reduced, and by increasing ω the number of low volatility is reduced. Therefore, the applied force is reduced.
In equation (2), A and B are constant coeffi -cients that are calculated due to the initial condi -tions. ωD is the natural frequency due to damp -ing and the amount of which:
(4) Due to the amount of ξ we have 3 types of structures:
1. cross-damping ξ > 1,
2. critical damping ξ = 1, 3. low damping ξ < 1.
Viscous fluid Damper
Fluid viscous damper is one of the energy ab -sorbing systems when compared to their physi -cal size have the ability to absorb high energy. Like friction dampers, the idea of dampers is tak -en from a car braking system. Cars Susp-ension uses a spring and a shock absorber that interact with each other, it absorbs the blows into the car and they waste their energy. If the columns of a structure are considered as a shock, by creating firmer springs (damper) next to them there can be a waste of energy into the structure by the earth -quake [3].
The construction of viscous fluid dampers is generally made up of a piston and cylinder. The central piston moves with great speed in the chamber filled with fluid. The viscous fluid is compressed by the piston inside the cylinder with great speed. Therefore, almost all the kinetic energy is converted to pressure energy upstream. Given that in the piston, there is another cylin -der in which high-pressure fluid can be pumped into the system, viscous liquid with little speed and its kinetic energy is exchanged between the two cylinders and the case becomes turbulent. This reciprocating motion causes a pressure dif -ference, so much force that provides resistance to damper movement. A buffer fluid is silicone oil (oil containing oxygen and quartz). This oil also sustainable living and stay for a long time, non-flammable and non-toxic [4].
The generated force is dependent on the size and shape of the pores and the speed of move -ment. The damping forces are generated up to 90% off-stage driving forces by the production shift. This means that the damping forces had no effect on seismic forces leading to increased structural deformation. Addition of a damper flu -id class structure reduces horizontal acceleration and lateral deformation of up to 50% and some -times more [5].
These dampers, used to reduce vibrations, are used in large numbers across the world. In an ef -fort to improve the performance of the damper, controllable models called semi-active damper viscose is provided. This type of damper is very similar to passive dampers. Semi-active viscous dampers that are equipped with an external ring pass fluid in the hydraulic cylinder piston that connect on each side. The ring has an adjust -able through valve and controls the flow inside the damper. Thus, when the piston of the damp
-er fluid pressure increases, it is able to gen-erate larger dampening forces. Therefore, a significant amount of energy cannot dissipate from the earth -quake [5].
Adding the dampers to the structure often will not lead to structural deformation and there will be a change in the structure itself. Viscous fluid dampers in many ways act as diagonal members of the structure. Dampers should be installed in adjacent classes to change any occurrence of un -eveniness in the building [6-7].
Using these dampers is effective in designing structure systems, because the structure needs a predefined stiffness, to remain resistance to lat -eral forces and to remain stable. They can replace this extra stiffness and with energy-absorbing structures reduce vibration responses to other structural members remain in the elastic range.
Viscous damper provides a force that is al -ways in front of the resistance structures. This force is proportional to the relative speed between the two ends of the damper:
(5) In which F is the damper force, V is the rela -tive velocity of the piston and C is the damping coefficient. α damping coefficient, is a fixed num -ber that is determined based on the diameter of the damper and aperture levels. Catalogue of vis -cous damper usually provided by manufacturers for several values of α. α is much smaller than those normally selected for the design of earth -quake-resistant design of the wind. α is exponen -tial function of speed, which can have a value in the range of 0.3 to 1.95 [7].
Value for structural applications is proposed in the range of 0.3 to 1. α=1 is called linear vis -cous damper the damper where the damper force is proportional to the relative velocity of the damper. Damper with α less than 1 is called non-linear viscous damper that for a small relative speed, provides greater damping force.
which is commonly braces are embedded. This means that. it can be easily embedded in existing structures or, replaced if necessary, after loading (earthquake).
There are several important advantages for the use of viscous dampers [5]:
1. The damper has no sensitivity to temperature changes and the lack of a solid construction and Bauschinger effect will not result in fa -tigue.
2. These dampers are the alternative to the meth -od of isolating the base, because they are less expensive and easier to set up and run.
3. It can be used for new and old structures. This is very important in the restoration of historic buildings.
4. One of the characteristics of such dampers is their dynamics and they can adapt to the be -havior of a structure plus their power to resist earthquake forces. Thus they are able to resist these forces.
5. The viscous damper is a sealed device, and this would tend to lower the atmospheric haz -ards that must endure friction dampers. 6. In the damper, a valve is used to adjust exter
-nal energy only. Therefore, the damper does not require an external energy source and therefore are highly reliable.
7. Similar viscous damping equation is valid for all frequency levels.
Disadvantages:
1. Its life expectancy is low compared to the life of the structure.
2. Viscous dampers must be considered in a sep -arate matrix. Attenuation coefficient matrix and if the dampers are an integral part of the process of solving the structural heterogeneity be difficult to disintegration of the system for analysis.
3. Due to low compression of viscous fluid, vis -cous damper is starting with a small kick.
Related works
For the first time viscous dampers were used in aerospace engineering to absorb the impacts caused by the launch or landing of air -craft. When the damper was used for their first structural engineering, the technology was ful -ly developed over 35 years. Research and ap -plication of viscous dampers in civil engineer -ing in 1990 coincided almost simultaneously
with the end of the Cold War. The focus was on averaging the structural response of a seis -mic shake. The first use of viscous dampers for the purpose of seismic resistant design seismic was in 1993 in the Sanber Nsdino Medical Center in California. Viscous dampers added to the system helped to change places below 2.2 inches to 3 seconds remaining, and the structures will increase the effective period.
Dela Liera et al., (2005) analyzed the tor -sional balance of plan-asymmetric structures with frictional dampers. This investigation deals with the torsional balance of the earthquake response and design of elastic asymmetric structures with frictional dampers. Plan asymmetry leads to an uneven lateral deformation demand among struc -tural members and to unbalanced designs with larger capacities in some resisting planes. Fric -tional dampers are capable of controlling lateral-torsional coupling by placing the so-called em -pirical center of balance (ECB) of the structure at equal distance from all edges of the building. This rule is developed for single-story systems with linear and inelastic behavior. However, recently obtained theoretical and experimental results demonstrate that this rule carries over to multi -story structures. Results show that the peak dis -placement demand at the building edges and that of resisting planes equidistant from the geometric center may be similar if the damper is optimally placed. It is also shown that torsional amplifica -tion of the edge displacements of arbitrary asym -metric structures relative to the displacement of the symmetric counterparts are approximately bound by a factor of 2. Furthermore, frictional dampers are equally effective in controlling later -al-torsional coupling of torsional flexible as well as stiff structures [5].
Lin et al. (2006) studied the behavior of concrete buildings with viscous dampers and RC walls in the style of shaking table tests. The results confirm the bracing damper system that we are using at any time that by changing the relative position of the installation method it is considered effective. In order to develop the performance in buildings as well as to de -velop medium and long-orders, a new design proposed that a single trend worked very well and states the ratio of viscous damping work -load [8].
viscous damper effect on steel frames with 3, 6 and 9 floors respectively. In this manner, each of the structures were braced, once without damper and with damper. Once a shift occurred, its effect on the structure was observed. Struc -tural modeling was performed using SAP2000 software. The results show the effect of viscous dampers in the lower right lateral displacement class in particular frames baguette with more classes. In longer structures this amount has been reduced to about 54% [9].
Chakhtab and colleagues evaluate the perfor -mance of a three-story concrete frame. It is mod -eled with finite element method and compared their results with the results of non-linear time history analysis. The results showed that using viscous dampers could affect the structure dis -placement response by up to 80% [10].
Mousavi et al. (2015) designed viscous dampers based on the vibration performance of steel frames. The results of time history analysis of structures under different risk levels records the accuracy of the estimation method. In all three models, the practice has achieved the desired per -formance improvement. In all cases, the build -ing has gained acceptable performance improve -ments under earthquake conditions and real time is a good forecast of the behavior of the structure. This result demonstrates the high level of confi -dence due to the maximum error in the estimation method [11].
METHODS AND MATERIALS
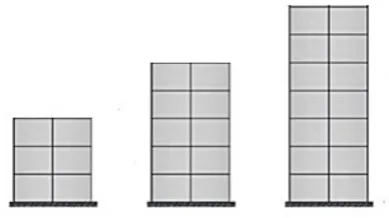
Gravity load profile models and instruments Models in this study are regular three-dimen -sional frameworks in the plan with 3, 5 and 7 floors (Figure 1). Very significant structures I = 1.2, are in an area with very high risk and A = 0.35, with a ductile reinforced concrete moment frame structural system and the soil type II the average R = 7. Floors, ceiling height is 2.3 meters and structures are joists and blocks with two-way performance. Gravity loads in regular mode as symmetrical as shown in Figure 1 that the struc -tures are imported.
As shown in Figure 1 loads on the structure of the project is in the form of live and the dead. The floor dead load and live load of 200 kg to 500 kg per square meter respectively, which is due to two-way system floor, adjacent beams transmit -ted in the frame.
Six types of structures have been used in this study and are presented in Table 1.
Each of these structures was analyzed once in the presence of a damper once regardless of the damper. Sections of beams and columns were presented in tables from Table 2 to Table 7. Selected properties of used material were described in Table 8.
Used accelerograms and privacies to determine them
Due to Iranian 2800 Regulations the earth -quake records that are used to determine the ef -fect of the Earth’s motion should reflect the actual movement of the ground at the site of the building in an earthquake. To achieve this goal it is nec -essary to have at least three pairs of horizontal earthquake records belonging to different compo -nents and are registered with the following char -acteristics elected [2].
A) Accelerograms of earthquakes that satisfy the conditions in which they work: magnitude, distance to fault, seismic source mechanisms are taken into account.
Fig. 1. Structural Plan with Dead Load (DL) and Live Loads (LL) on it
Table 1. Type of structural models examined in this study
Structure type 3-3 3-7 3-5
Introduction 3-storey building in the vicinity of 3 floors 3-storey building in the vicinity of 7 floors 3-storey building in the vicinity of 5 floors
Table 2. Levels of structural columns 3 floors
Floors Section dimension (cm) and longitudinal reinforcement
1, 2 45 x 45 16Ø20
3 40 x 40 12Ø20
Table 3. Beam section in the 3-storey structures
Floors Section dimension (cm) The upper reinforcement (Global) Bottom reinforcement (Global)
1,2 40 x 45 3Ø22 3Ø22
3 35 x 40 3Ø22 3Ø22
Table 4. Levels of structural columns 5 floors
Floors Section dimension (cm) and longitudinal reinforcement
1,2 60 x 60 20Ø22
3,4 55 x 55 20Ø22
5 50 x 50 20Ø22
Table 5. Beam section in the 5-storey structures
Floors Section dimension (cm) The upper reinforcement (Global) Bottom reinforcement (Global)
1,2 55 x 60 4Ø22 4Ø22
3,4 50 x 55 4Ø22 4Ø22
5 45 x 50 4Ø22 4Ø22
Table 6. Levels of structural columns 7 floors
Floors Section dimension (cm) and longitudinal reinforcement
1,2 70 x 70 20Ø25
3,4 65 x 65 20Ø22
5,6 60 x 60 20Ø22
7 55 x 55 20Ø20
Table 7. Beam section in the 7-storey structures
Floors Section dimension (cm) The upper reinforcement (Global) Bottom reinforcement (Global)
1,2 65 x 70 5Ø22 5Ø22
3,4 60 x 65 5Ø22 5Ø22
5,6 55 x 60 4Ø22 4Ø22
7 50 x 55 4Ø22 4Ø22
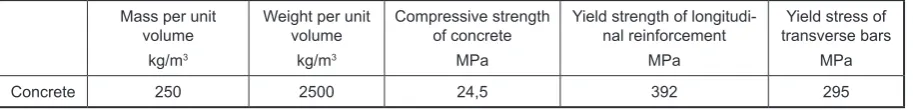
Table 8. Material properties of concrete in structural model
Mass per unit volume
kg/m3
Weight per unit volume
kg/m3
Compressive strength of concrete
MPa
Yield strength of longitudi-nal reinforcement
MPa
Yield stress of transverse bars
MPa
Table 9. Used accelerograms characteristics
No Earthquake Date Location Magnitude R(km) PGA(g)
1 Bam 1382 Bam 6.6 10 0.89
2 Manjil 1369 Manjil 6.6 14.3 0.43
3 El-Centro 1940 - 6.4 14.5 0.27
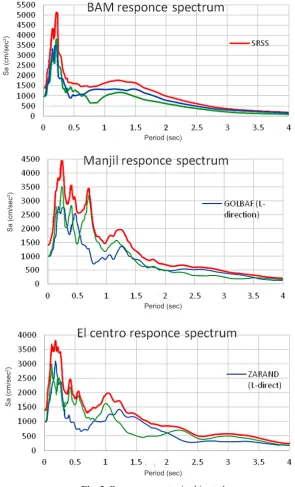
Fig. 3. Response spectra in this study
Fig. 4. Average of the three record earthquake response spectra
Period (sec) Period (sec) Period (sec)
Sa (cm/sec
2)
Sa (cm/sec
2)
Sa (cm/sec
B) Builds of accelerograms have benefits in terms of geology, tectonicand seismology. Profile soil layers at the site of the building have simi -larities.
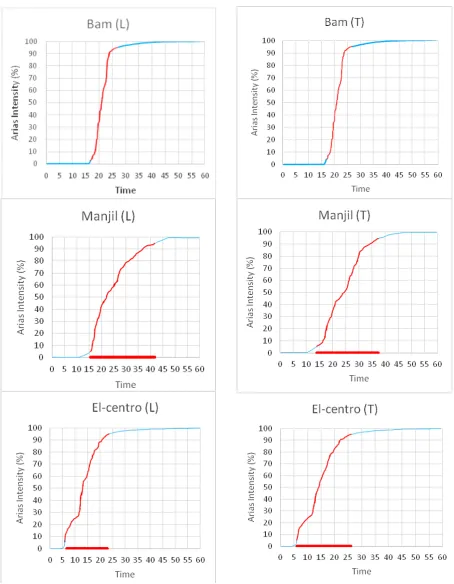
C) Duration of strong ground motion in accelero -grams of at least 10 seconds or three times the fundamental period of construction, which -ever is greater. Accelerograms duration of intense motion may be determined by valid methods, such as energy distribution.
The selected accelerograms should be com -pared using the following method:
A) All the accelerograms scaled in their maxi -mum amount. This means that the maxi-mum acceleration of all of them is equal to the grav -itational acceleration.
B) Acceleration response spectra of each pair scaled accelerograms by setting the damping ratio at 5%.
C) Response spectra combination of three pairs of records, 0.2T and 1.5T averaged in the range of rotations when compared with the spectrum of standard design. T is fundamental period of the building is determined experimentally. D) Determined scale factor, should be multiplied
to the scaled accelerograms in paragraph (a) to be used in dynamic analysis.
Considering the above mentioned, accelero -grams with magnitude 6 to 7 has been selected and the distance of the fault is between 15 to 25 km using 2800 Iran Regulations plans to land Type II scale. Accelerograms were downloaded from http://ngawest2.berkeley.edu. Accelero -grams used in the nonlinear time history analysis are shown in Table 9.
First, the acceleration maps (raw accelero -grams) were processed and corrected, such as modifying the baseline and modify the appro
-Fig. 5. Standard spectra of 2800 regulation
priate frequency band on them. Here, to deter -mine the period of intense seismic maps, the proposed 2800 regulations energy distribution method is used. In this period, strong ground motion duration square integral acceleration in which a large share of the highly records are known to exist.
Square integral momentum is considered as between 5% and 95%, of a period of strong ground motion. For this purpose, the follow -ing maps the Earth by the time the graph is drawn. The diagram below shows the duration of strong ground motion (by way of energy distribution) is given in the records.
In the following acceleration response spectra of each scaled accelerograms pair to be drawn with regard to the damping of 5% were shown. The response spectra of each pair is used and the whole combination unit is con -structed by SRSS for each pair.
The combination of three couples is ob -tained by taking an average response spectra records and spectrum (spectrum average) com -pared with the standard spectrum.
Due to the 2800 standard spectra were plot -ted in B, here to compare with average spec -trum Sa, the standard spectra should be multi -plied in g:
(6)
Average spectrum with 1.4 times the stan -dard spectrum (not the whole stan-dard layout) is compared. And scale factor is determined as the average values (average spectrum) in any case within the period of 0.2T and 1.5T (T is fundamental period of oscillation) of not less than 1.4 times the standard range.
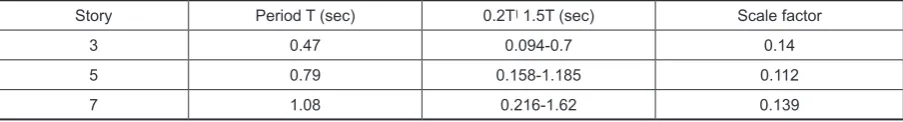
Due to the above figure and comparison of 1.4 standard spectra and the average of SRSS of accelerograms in 0.2T and 1.5T, it is obvi -ous that the average spectrum is under the stan -dard. Considering the modifying factor of 2.15 for accelerograms, as it is shown in the fol -lowing graph, the average spectrum is on the standard spectrum, and due to the main period of 3-, 5-, and 7- story structures and Figure 6, scale structures are obtained as Table 10.
RESULTS
In this section we present an analysis of history when each of the discussed models. To apply the effect of P − Δ in each analysis, first the stiffness of the model is obtained by static analysis model, and then history analy -sis is used. This section is divided into three general classes, respectively, the maximum relative displacement, maximum acceleration of the center of mass on each floor and founda -tion structures has been split. As described in a previous part, three earthquake records have been used all of which equalized due to 2800 regulation. Then, according to the ninth issue, the structural response to earthquake forces is achieved on average. Viscous dampers used in this study has power of 0.5, and the mass were 0.001. In this study, non-linear damper perfor -mance is considered. Damper characteristics are given in Table 11.
Linear dynamic analysis
In order to study the linear response of the structures time history analysis method has been used. Time history analysis used
Table 11. Characteristics of non-linear dampers
Story K (N/mm) C (N∙sec/mm) α
3rd 2000 220 0.5
2nd 2000 235 0.5
1st 2000 300 0.5
Table 10. Accelerograms scale factor for all kinds of structures 3, 5 and 7 floors.
Story Period T (sec) 0.2Tا 1.5T (sec) Scale factor
3 0.47 0.094-0.7 0.14
5 0.79 0.158-1.185 0.112
Hilber-Hughes-Taylor integration method. In this analysis, the structural response is calcu -lated using dynamic relationships in short time steps. The structural response is calculated un -der the stimulation of model based on at least three earthquake records. In this study, three accelerograms with the specifications set forth in the Table 12 is used.
In time history analysis component with larger PGA, structures that are of great im -portance in the study are entered. The analysis of structures listed under the record obtained based on the maximum acceleration mapping are presented in Table 12. The examination of each of the models will be discussed.
Maximum relative displacement of stories According to the material presented in the previous section evaluation of the relative dis -placement of stories is very important. The study of the impact damper in use in buildings adja -cent is realized. To investigate this effect, each of those types of models that have been introduced in the previous section will be discussed.
3-7 Model
The two structures are similar and their dis -placement with and without dampers is provided. The output is related to the software.
Results of displacement of 7-storey build -ing nearby 3 floors with a damper is presented in Table 13. Displacement results for the 7-sto -rey building adjacent to the 3-story building with a damper is showed in Table 14. Displacement results for the 3-storey building adjacent to the 7-story building with a damper is presented in Table 15. Table 16 shows displacement results for the 3-storey building adjacent to the 7-story building without damper. These results are pre -sented also on Figure 7 and Figure 8.
3-5 Model
Displacement results for 5-story building adjacent to 3-story with damper is presented on
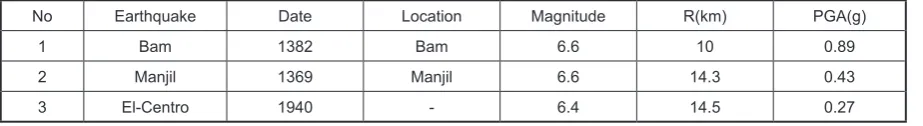
Table 17. Table 18 shows displacement results for 3-story building adjacent to 5-story with damper. Displacement results for 5-story building adja -cent to 3-story without damper is presented in Table 19. Table 20 shows displacement results for 3-story building adjacent to 5-story without damper. These results are presented also on Fig -ure 9 and Fig-ure 10.
3-3 Model
Table 21 shows displacement results for 3-story building adjacent to 3-story with -out damper. Displacement results for 3-story building adjacent to 3-story with damper is presented in Table 22. These results are also presented in Figure 11.
The maximum acceleration of the center of mass
According to previous sections the maximum acceleration of the center of mass is one of the important parameters in the design of earthquake-resistant structures. In this section, the maximum acceleration (Manjil, El-Centro and Bam) is cal -culated and displayed. The average of the three accelerations with and without damper were dis -played in each section individually.
7-3 Model
Table 23 shows maximum acceleration of the center of mass results for 7-story part without damper. Table 24 presents maximum acceleration of the center of mass results for 7-story part with damper. Table 25 shows maximum acceleration of the center of mass results for 3-story part with -out damper. Table 26 exhibits maximum accelera -tion of the center of mass results for 3-story part with damper. Figure 12 presents the average max -imum acceleration of the center of mass results for 7-story part with and without damper. Figure 13 shows the average maximum acceleration of the center of mass results for 3-story part with and without damper.
Table 12. Used seismic profile record
No Earthquake Date Location Magnitude R(km) PGA(g)
1 Bam 1382 Bam 6.6 10 0.89
2 Manjil 1369 Manjil 6.6 14.3 0.43
Table 13. Results of displacement of 7-storey building nearby 3 floors with a damper
Story Manjil Bam El Centro Mean
1 0.1111 2.093063 0.104625 0.769595833
2 0.177575 3.362488 0.16325 1.2344375
3 0.222925 4.093363 0.1941875 1.503491667
4 0.22655 4.265688 0.1994125 1.563883333
5 0.217613 4.292763 0.188725 1.566366667
6 0.188325 3.830463 0.1620625 1.393616667
7 0.150888 3.134288 0.1296375 1.138270833
Table 14. Displacement results for the 7-storey build
-ing adjacent to the 3-story build-ing with a damper
Story Manjil Bam El Centro Mean
1 0.04955 1.536888 0.055738 0.547392
2 0.062038 2.048125 0.07295 0.727704
3 0.047225 1.530013 0.055825 0.544354
Table 15. Displacement results for the 3-storey build
-ing adjacent to the 7-story build-ing with a damper
Story Manjil Bam El Centro Mean
1 0.27775 5.232656 0.2615625 1.923989583
2 0.443938 8.406219 0.408125 3.08609375
3 0.557313 10.23341 0.48546875 3.758729167 4 0.566375 10.66422 0.49853125 3.909708333
5 0.544031 10.73191 0.4718125 3.915916667
6 0.470813 9.576156 0.40515625 3.484041667 7 0.377219 7.835719 0.32409375 2.845677083
Table 16. Displacement results for the 3-storey build
-ing adjacent to the 7-story build-ing without damper
Story Manjil Bam El Centro Mean
1 0.123875 3.842219 0.139344 1.368479
2 0.155094 5.120313 0.182375 1.81926
3 0.118063 3.825031 0.139563 1.360885
Fig. 7. The average of maximum displacement of three records for 7-story adjacent to 3-story
Fig. 8. The average of maximum displacement of three records for 3-story adjacent to 7-story
Table 17. Displacement results for 5-story building adjacent to 3-story with damper
Story Manjil Bam El Centro Mean
1 0.131063 2.292581 0.169875 0.86450625
2 0.190875 3.281494 0.25955625 1.243975
3 0.210038 3.248719 0.28123125 1.2466625
4 0.170888 2.410163 0.2298375 0.9369625
5 0.107869 1.380919 0.145275 0.5446875
Table 18. Displacement results for 5-story building adjacent to 3-story without damper
Story Manjil Bam El Centro Mean
1 0.218438 3.820969 0.283125 1.44084375
2 0.318125 5.469156 0.43259375 2.073291667 3 0.350063 5.414531 0.46871875 2.077770833
4 0.284813 4.016938 0.3830625 1.561604167
Table 19. Displacement results for 3-story building adjacent to 5-story with damper
Story Manjil Bam El Centro Mean
1 0.736406 10.30854 1.00216875 4.01570625
2 0.093056 3.072188 0.109425 1.09155625
3 0.238219 7.672538 0.276769 2.729175
Table 20. Displacement results for 3-story building adjacent to 5-story without damper
Story Manjil Bam El Centro Mean
1 1.227344 17.18091 1.67028125 6.69284375
2 0.155094 5.120313 0.182375 1.819260417
3 0.397031 12.78756 0.461281 4.548625
Fig. 9. the average of maximum displacement of three records for 5-story adjacent to 3-story
Fig. 10. Average of maximum displacement of three records for 3-story adjacent to 5-story
Table 21. Displacement results for 3-story building adjacent to 3-story without damper
Story Manjil Bam El Centro Mean
1 0.27775 5.232656 0.2615625 1.923989583
2 0.443938 8.406219 0.408125 3.08609375
3 0.557313 10.23341 0.48546875 3.758729167
Table 22. Displacement results for 3-story building adjacent to 3-story with damper
Story Manjil Bam El Centro Mean
1 0.2222 4.186125 0.20925 1.539191667
2 0.35515 6.724975 0.3265 2.468875
3 0.44585 8.186725 0.388375 3.006983333
5-3 Model
Table 27 shows maximum acceleration of the center of mass results for 5-story part without damper. Maximum acceleration of the center of mass results for 5-story part with damper is pre -sented in Table 28. Table 29 shows maximum ac -celeration of the center of mass results for 3-story part without damper. Table 30 presents maximum acceleration of the center of mass results for 3-story part with damper. Figure 14 shows the av -erage maximum acceleration of the center of mass results for 5-story part with and without damper. Figure 15 presents the average maximum accel -eration of the center of mass results for 3-story part with and without damper.
3-3 Model
Table 31 shows maximum acceleration of the center of mass results for 3-story part without damper. Table 32 presents the appropriate results for 3-story part with damper. Figure 16 shows the av -erage maximum acceleration of the center of mass results for 3-story part with and without damper.
B
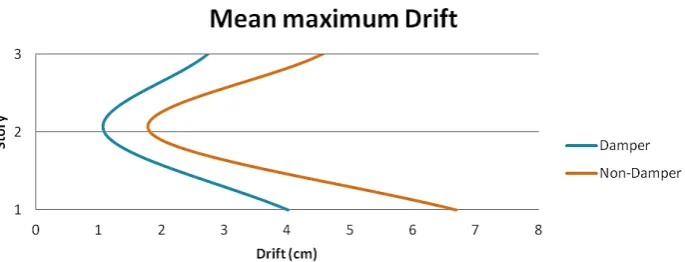
ase shear of structures 7-3 modelFigure 17 shows the base shear of structure for 7-story part with and without damper. Figure 18 presents the base shear of structure for 3-story part with and without damper.
Table 23. Maximum acceleration of the center of mass results for 7-story part without damper
Acceleration non-damper
story Manjil EL-Centro Bam mean
1 1.78808 2.8031 57.47479 20.68866
2 4.04565 4.93421 98.52459 35.83482
3 5.82087 6.45097 120.9507 44.4075
4 6.72371 7.14912 148.7083 54.1937
5 7.33115 7.30493 146.5756 53.73724
6 7.97824 8.21385 156.9957 57.72926
7 10.31619 9.39094 186.5167 68.74127
Table 25. Maximum acceleration of the center of mass results for 3-story part without damper
Acceleration non-damper
story Manjil EL-Centro Bam mean
1 1.6861 3.95833 80.9752 28.87321
2 4.08966 7.53631 153.0573 54.89444
3 5.84985 9.92367 239.3436 85.03905
Table 24. Maximum acceleration of the center of mass results for 7-story part with damper
Acceleration damper
story Manjil EL-Centro Bam mean
1 0.786755 1.205333 23.27729 8.275463
2 1.658717 1.973684 41.87295 14.33393
3 2.357452 2.870682 54.4278 17.763
4 3.02567 3.00263 63.94455 21.67748
5 3.042427 3.14112 61.56177 21.4949
6 3.590208 3.326609 65.15322 23.09171
7 4.3328 4.225923 76.47184 27.49651
Table 26. Maximum acceleration of the center of mass results for 3-story part with damper
Acceleration damper
story Manjil EL-Centro Bam mean
1 0.741884 1.761457 34.81934 11.54928
2 1.758554 3.278295 65.81466 21.95777
3 2.33994 4.366415 101.721 34.01562
Fig. 12. The average maximum acceleration of the center of mass results for 7-story part with and with
-out damper
Fig. 13. The average maximum acceleration of the center of mass results for 3-story part with and with
Table 27. Maximum acceleration of the center of mass results for 5-story part without damper
Acceleration non-damper
story Manjil EL-Centro Bam mean
1 1.65647 3.14831 61.89578 22.23352
2 3.63331 5.80471 126.6063 45.34811
3 5.29447 8.35513 143.3589 52.33618
4 6.06575 9.73448 141.127 52.30908
5 7.64616 10.39264 180.8331 66.29064
Table 29. Maximum acceleration of the center of mass results for 3-story part without damper
Acceleration non-damper
story Manjil EL-Centro Bam mean
1 1.6861 3.95833 80.9752 28.87321
2 4.08966 7.53631 153.0573 54.89444
3 5.84985 9.92367 239.3436 85.03905
Table 28. Maximum acceleration of the center of mass results for 5-story part with damper
Acceleration damper
story Manjil EL-Centro Bam mean
1 1.060141 1.983435 37.44695 13.34011
2 2.216319 3.482826 79.12895 27.20887
3 3.203154 5.389059 93.1833 31.40171
4 3.942738 6.035378 88.91001 31.38545
5 4.702388 6.547363 112.1165 39.77438
Table 30. Maximum acceleration of the center of mass results for 3-story part with damper
Acceleration damper
story Manjil EL-Centro Bam mean
1 1.079104 2.553123 51.01438 17.32393
2 2.576486 4.785557 96.42612 32.93666
3 3.50991 6.351149 149.5898 51.02343
Fig. 14. The average maximum acceleration of the center of mass results for 5-story part with and with
-out damper
Fig. 15. The average maximum acceleration of the center of mass results for 3-story part with and with
-out damper
Table 31. Maximum acceleration of the center of mass results for 3-story part without damper
Acceleration non-damper
story Manjil EL-Centro Bam mean
1 1.6713 3.83178 80.89375 28.79894
2 4.03183 7.44521 150.0507 53.84257
3 5.74251 9.76216 231.9856 82.49674
Table 32. Maximum acceleration of the center of mass results for 3-story part with damper
Acceleration damper
story Manjil EL-Centro Bam mean
1 1.571022 3.563555 73.20884 25.91905
2 3.668965 6.700689 138.7969 48.45831
3 5.196972 9.225241 220.3863 74.24707
5-3 model
Figure 19 shows the base shear of structure for 5-story part with and without damper. Figure 20 presents the appropriate results for 3-story part.
3-3 model
Figure 21 shows the base shear of structure for 3-story part with and without damper.
CONCLUSION
an important parameter in increasing the risk. The allowed value of 1.11 is proposed in regu -lations are not adequate and in some cases it is too conservative. Because structures with differ -ent periods produce differ-ent responses to earth -quakes with frequency components, so it should be studied with care with considering the effect of earthquakes on the performance of structures. Another important consideration is the distance between and two structures and the increased the vulnerability of structures. Thus, widening the gap between two structures does not necessarily
Fig. 18. The base shear of structure for 3-story part with and without damper
Fig. 19. The base shear of structure for 5-story part with and without damper
Fig. 20. The base shear of structure for 3-story part with and without damper
Fig. 21. The base shear of structure for 3-story part with and without damper
Fig. 17. The base shear of structure for 7-story part with and without damper
Fig. 16. The average maximum acceleration of the center of mass results for 3-story part with and with
-out damper
reduce the pass, in many cases increases the force of impact. Change in the amount of impact force, as well as changes in the level of vulnerability of neighboring structures, can be because of the near or distant frequency frequencies on structures. So hit phenomenon can enter transformed from lin -ear to non-lin-ear motion, resulting in the creation of cracks and reducing the level of performance of the structure [12-14].
with energy dissipation devices. In: Proceeding of the 8th National Conference on Earthquake Engi
-neering, 2006.
7. Vial I.J., de la Llera J.C., Almazán J.L., Ceballos V. Torsional balance of plan‐asymmetric struc
-tures with frictional dampers: experimental results. Earthquake Engineering & Structural Dynamics, 2006, 35(15), 1875-98.
8. Lin T.K., Chen C.C., Chang K.C., Lin C.C,. Hwang J.S. Mitigation of micro vibration by viscous dampers. Earthquake Engineering and Engineering Vibration, 2009, 8(4), 569-82.
9. Behravesh A., Armaghani A., Akbarlou A., Sade
-ghi V., Evaluation of the effects of viscous damp
-ers in performance of structures. In: The Sixth Na
-tional Congress of Civil Engineering University of Semnan, Iran, 2012.
10. Charkhtab M., Estekanchi H., Using last time method in the optimal design of viscous dampers based on the seismic performance of steel frames. In: The Fifth National Congress of Civil Engineer
-ing, Ferdowsi University of Mashhad, Iran, 2014. 11. Mousavi S., Ziaifar M., laboratory studies and de
-termine the behavioral features of Voskevaz damp
-er axial contraction. In: The Tenth Int-ernational Congress of Civil Engineering, Tabriz, Tabriz Uni
-versity, 2015.
12. Mousanezahad T., Pourzeinali S., Seismic monitor
-ing tall build-ings us-ing semi-active viscous damp
-ers. In: The Fourth National Congress on Civil En
-gineering, Tehran University, 2011.
13. Mirseifi H., Azhdari M., Ghalenoyi M., 4 and 8-sto
-rey steel buildings equipped with friction damper analysis using Abaqus software. In: The Sixth Na
-tional Congress of Civil Engineering, University of Semnan, 2011.
14. Mansouri M., Nasseri H., Sarvemoghadam A., Laboratory examination and analysis of the dis
-tribution of Voskevaz damper on the behavior of asymmetric structures. Journal of Civil Engineer
-ing and Survey-ing, Islamic Azad University, Sci
-ence and Research Branch, 2012.
observed that the effect of more viscous damp -ers with increased damping constant will not ef -fective, but the location and pattern of installing them is also important. It was also observed that the optimal damping when using a uniform pat -tern of installation can be obtained on the fashion equivalent structures.
In the end it can be concluded that the obser -vance of a safe distance between two adjacent structures can play an important role in making sustainable urban spaces. For the most seismic responses percent, corresponding to maximum acceleration is in the 7-3 model that we saw 53 percent reduction on each floor.
REFERENCES
1. Goel R.K. Effects of supplemental viscous damp
-ing on seismic response of asymmetric‐plan sys
-tems. Earthquake Engineering & Structural Dy
-namics, 1998, 27(2), 125-41.
2. Goel R.K. Passive control of earthquake-induced vibration in asymmetric buildings. In: Proceeding of 12th World Conference on Earthquake Engi
-neering, 2000.
3. Goel R.K., Booker C.A. Effects of supplemental viscous damping on inelastic seismic response of asymmetric systems. Earthquake Engineering & Structural Dynamics, 2001, 30(3), 411-30.
4. De La Llera J.C., Almazan J.L., Vial I., Ceballos V., Garcia M. Analytical and experimental response of asymmetric structures with friction and viscoelas
-tic dampers. In: Proceeding of 13th World Confer
-ence on Earthquake Engineering 2004 Aug 1. 5. De la Llera J.C., Almazán J.L., Vial I.J. Torsional
balance of plan‐asymmetric structures with fric
-tional dampers: analytical results. Earthquake Engineering & Structural Dynamics, 2005, 34(9), 1089-108.