Performance Comparison of Hard and Soft Approaches
for Document Clustering
Vibekananda Dutta
Central University of Rajasthan Kishangarh, India
Krishna Kumar Sharma Central University of Rajasthan
Kishangarh, India
Deepti Gahalot
Govt.Engineering College Ajmer, India
ABSTRACT
There is a tremendous spread in the amount of information on the largest shared information source like search engine. Fast and standards quality document clustering algorithms play an important role in helping users effectively towards vertical search engine, World Wide Web, summarizing & organizing information. Recent surveys have shown that partitional clustering algorithms are more suitable for clustering large datasets like World Wide Web. However the K-means algorithm is the most commonly used in partitional clustering algorithm because it can easily be implemented and most efficient interms of execution in time. In this paper we represent a short overview of method for soft approaches of an optimal fuzzy document clustering algorithm as compare to the hard approaches. In the experiment we conducted, we applied the Hard and soft approaches like K-means and Fuzzy c-means on different text document datasets. The number of document in the datasets ranges from 1500 to 2600 and the number of terms ranges from 6000 to over 7500 in both hard and soft approaches. The results illustrate that the soft approaches can generated slightly better result than the hard approaches.
General Terms
Soft approaches, hard approaches, Partitional clustering, vertical search engine,TF-IDF(Term frequency-inverse document frequency)
Keywords
Document Clustering, Hard and Soft Approaches, Text Datasets, Cluster Centriod and Vector Space Model.
1.
INTRODUCTION
Document clustering is a fundamental operation used in unsupervised document organization, automatic topic extraction, and information retrieval. Clustering involves dividing a set of objects into a specified number of clusters [14]. The motivation behind clustering a set of data is to find inherent structure in the data and expose this structure as a set of groups. The data objects within each group should exhibit a large degree of similarity while the similarity among different clusters should be minimized [5, 9, 13]. There are two major
clustering techniques: “Partitioning” and “Hierarchical” [9]. Most document clustering algorithms can be classified into these two groups. Hierarchical techniques produce a nested sequence of partition, with a single, all-inclusive cluster at the top and single clusters of individual points at the bottom. The partitioning clustering method seeks to partition a collection of documents into a set of non-overlapping groups, so as to maximize the evaluation value of clustering. Although the hierarchical clustering technique is often portrayed as a better quality clustering approach, this technique does not contain any provision for the reallocation of entities, which may have been poorly classified in the early stages of the text analysis [9]. Moreover, the time complexity of this approach is quadratic [13].
In recent years, it has been recognized that the partitional clustering technique is well suited for clustering a large document dataset due to their relatively low computational requirements [13]. The time complexity of the partitioning technique is almost linear, which makes it widely used. The best-known partitioning clustering algorithm is the K-means algorithm and its variants [10]. This algorithm is simple, straightforward and is based on the firm foundation of analysis of variances. The K-means algorithm clusters a group of data vectors into a predefined number of clusters.
It starts with a random initial cluster centers and keeps reassigning the data objects in the dataset to cluster centers based on the similarity between the data object and the cluster centers. The reassignment procedure will not stop until a convergence criterion is met (e.g., the fixed iteration number or the cluster result does not change after a certain number of iterations).
same initial cluster centroids in a dataset will always generate the same cluster results. However, if good initial clustering centroids can be obtained using any of the other techniques, the K-means would work well in refining the clustering centroids to find the optimal clustering centers [5]. It is necessary to introduce some other global optimal searching algorithm for generating this initial cluster centroids. The article Soft Approaches (Fuzzy C-means) algorithm is a population based stochastic optimization technique that can be used to find an optimal, or near optimal, solution to a numerical and qualitative problem. The Soft Approaches (Fuzzy C-means) algorithm can be used to generate good initial cluster centroids for optimal solution. In this paper, we present a Soft Approcahes(Fuzzy C-means) document clustering algorithm that performs fast document clustering and can avoid being trapped in a local optimal solution. The results from our experiments indicate that the Fuzzy C-means algorithm can generate the slightly better results in just 80 iterations in comparison with the Hard Approaches (K-means) algorithm. The remainder of this paper is organized as follows: Section 2 provides the methods of representing documents in clustering algorithms and of computing the similarity between documents. Section 3 provides a general overview of the Soft Approaches (Fuzzy C-means) algorithm. The Soft Approches (Fuzzy C-means) clustering algorithms are described in Section 4.
Section 5 provides the detailed experimental setup and results for comparing the performance of the Fuzzy C-means algorithm with the K-means. The discussion of the experiment’s results is also presented. The conclusion is in Section 6.
2.
PRELIMINARIES
All material on each page should fit within a rectangle of 18 x 23.5 cm (7" x 9.25"), centered on the page, beginning 2.54 cm (1") from the top of the page and ending with 2.54 cm (1") from the bottom. The right and left margins should be 1.9 cm (.75”). The text should be in two 8.45 cm (3.33") columns with a .83 cm (.33") gutter.
2.1
Document representation
In most clustering algorithms, the dataset to be clustered is represented as a set of vectors X={x1, x2,…., xn}, where the vector xi corresponds to a single object and is called the feature vector. The feature vector should include proper features to represent the object. The text document objects can be represented using the Vector Space Model (VSM) [8]. In this model, the content of a document is formalized as a dot in the multidimensional space and represented by a vector d, such as d={ , ,... } 1 2 n w w w , where wi(i = 1,2,…,n) is the term weight of the term ti in one document. The term weight value represents the significance of this term in a document. To calculate the term weight, the occurrence frequency of the term within a document and in the entire set of documents must be considered. The most widely used weighting scheme combines the Term Frequency with Inverse Document Frequency (TF-IDF) [8]. The weight of term i in document j is given in equation 1:
Wji =tfji*idfji=tfji*log2(n/dfji) (1)
Where tfji is the number of occurrences of term i in the document j; dfji indicates the term frequency in the
a collection of documents; and n is the total number of documents in the collection. This weighting scheme discounts the frequent words with little discriminating power.
2.2
The similarity metric
The similarity between two documents needs to be measured in a clustering analysis. Over the years, two prominent ways have been proposed to compute the similarity between documents mp and mj. The first method is based on Minkowski distances [7], given by:
1/
, ,
1
(
,
)
|
|
m n
d
n
n p j i p i j
i
D m m
m
m
(2)
For n =2, we obtain the Euclidean distance. In order to manipulate equivalent threshold distances, considering that the distance ranges will vary according to the dimension number, this algorithm uses the normalized Euclidean distance as the similarity metric of two documents, mp and mj, in the vector space. Equation 3 represents the distance measurement formula:
21
,
/
m d
p j pk jk m
k
d m m
m
m
d
(3)
where mp and mj are two document vectors; dm denotes the dimension number of the vector space; mpk and mjk stand for the documents mp and mj’s weight values in dimension k. The other commonly used similarity measure in document clustering is the cosine correlation measure [11], given by:
cos
,
t
p j
p j
p j
m m
m m
m
m
(4)
Where mpt mj denotes the dot-product of the two document
vectors; |.| indicates the length of the vector. Both similarity metrics are widely used in the text document clustering literatures.
3.
BACKGROUND OF THE SOFT AND
HARD APPROACHES
in the dataset to cluster centriods based on the similarity between the data objects and the clusters centriods. The reassignment procedure will not stop until a convergence criterion is met (e.g., the fixed iteration number. Or the cluster result does not change after a certain number of iterations).
3.1
Hard C-Means (HCM)
Hard C-means is a part of Hard Approaches where it’s better known as K-means and in general this is not a Soft approaches or Fuzzy algorithm. However its overall structure is the basis for all the others methods. Therefore we call it Hard C-means in order to emphasize that it servers as starting point for the soft extensions. Its start with randomly initial cluster centriods and keeps reassigning the data objects in the dataset to cluster centriods based on the similarity between the data object and the cluster Centriod.
The K-means algorithm can be summarized as:
(1) Randomly select cluster Centriod vectors to set an initial dataset partition.
(2) Assign each document vector to the closest cluster centriods.
(3) Recalculate the cluster Centriod vector cj using
equation 5
1
1 n
ij j j
i n
ij j
u x
c
u
(5)
(4) Repeate step 2 and 3 until the convergence is achieved.
The algorithm can now be stated very simply shown as
INPUT: A set of training objects to be clustered and the number of desired clusters c.
OUTPUT: Partition of training examples in c
clusters and membership values ui,j for each example xj and
cluster i.
3.2
Fuzzy C-Means(FCM)
Fuzzy clustering popularly known as soft approaches plays an important role in solving problems in the areas of pattern recognition and fuzzy model identification [1, 2]. A variety of fuzzy clustering methods have been proposed and most of them are based upon distance criteria. One widely used algorithm is the fuzzy c-means (FCM) algorithm. It uses reciprocal distance to compute fuzzy weights. A more efficient algorithm is the new FCM [15]. It computes the cluster centre using Gaussian weights, uses large initial
prototypes, and adds processes of eliminating, clustering and merging.
Fuzzy c-means allows data points to be assigned into more than one cluster [4]. Each data point has a degree of membership (or probability) of belonging to each cluster.
The Fuzzy C-means algorithm can be summarized as:
Let xi be a vector of values for data point gi.
1. Initialize membership U(0) = [ uij ] for data
point gi of cluster clj by random
2. At the k-th step, compute the fuzzy centroid C(k) = [ cj ] for j = 1, .., nc, where nc is the number of
clusters, using
(6) (6)
Where m is the fuzzy parameter and n is the number of data points.
3. Update the fuzzy membership U(k) = [ uij ],
using
(7)
4. If ||U(k) – U(k-1)|| < , then STOP, else return to
step 2.
5. Determine membership cut offFor each data point gi, assign gi to cluster clj if uij of U
(k)
> .
4.
Implementation
4.1
Evaluation on 2-dimensional datasets
Before having implemented HCM and FCM in the Matlab environment using original TF-IDF datasets we tested the algorithm on 2-dimensional datasets. Data was generated artificially using normally distributed clusters of random size, position and standard deviation. Empirical evaluations showed us some of the advantages of FCM compared to HCM. The main reason against using FCM is its higher computational complexity.
4.2
Definition of a distance measure
One of the problems that was encountered during the implementation was how to define a measure of distance between objects (or between an object and a centre of clusters). Where Matlab library uses mainly for the measure of similarity based on the cosine similarity. This proximity measure ranges from 0 to 1 where 0 means no similarity and 1 means total equality of vectors:
1 2
1 2
1 2
.
( ,
)
cos
x x
0,1 ,
sim x x
x
x
(8)Where Xj is an object or more specifically in our case a
bag-of-word vector representation of a document and θ is ⊾ (X1,
X2).
ni
m ij n i
i m ij j
u
x
u
c
1 1
)
(
)
(
1 1
1 1
1
1
1
c
m
i j
ij
m n
j i j
x
c
u
x
c
4.3
Time complexity
Time complexities of HCM and FCM are respectively:
OHCM = O ( iHCM . n . k. v) (9)
OFCM = O ( iFCM . n . k . (v+c)) (10)
Where i is the number of required iterations, v is the length of an example vector, n is the number of terms, k is the number of document and c is the cluster point. According to our experimental results iFCM is slightly higher than iHCM.
Consequently we assume that they share the same order of magnitude and are therefore equal as this analysis is concerned.
5.
Experiment and Result
5.1
Datasets
We used two different document collections and compare the performance of the HCM and new FCM with different combination models. The document in each datasets ranges from 1560 to 2551 and the number of terms ranges from 6589 to 7095. A description of the test datasets is given in Table 1.
Table 1: Summary of text document datasets
Data Number of
documents
Number of
terms
Dataset 1 1560 6589
Dataset 2 2551 7095
5.2
Experimental setup for the documents
data
As we take a set of documents where we used lots of random texts from the web datasets of the organizations description. We partitioned the set in to different cluster’s using the same initial distribution and the same shared parameter. For each cluster we provide the Minkowski distance measure, Euclidian distance measure and cosine correlation measure used as the matrices in each algorithm. The cluster’s are aligned therefore the result can be directly compared in table 2 and 3 respectively.
Table 2: performance comparison of HCM and FCM using 50 iterations
D at a
No of clu ste r’s
No of ite rat io ns
Distance Measure Method
HCM(K-means)
New FCM(C-means)
Da
ta
se
t
1
5 50
Minkowski Euclidean Cosine correlation
5.238±0.09 0 6.279±0.15
0 6.798±0.07
8
4.135±0.95 6 5.438±0.09
7 5.129±0.19
0
Da
ta
se
t
2
7 90
Minkowski Euclidean Cosine correlation
7.498±0.09 6 7.988±0.09
0 8.835±0.19
0
6.238±0.56 0 5.698±0.78
5 8.138±0.64
0
Table 3: performance comparison of HCM and FCM using 90 iterations
D at a
No . of clu ste r’s
No . of ite rat io ns
Distance Measure Method
HCM(K-means)
New FCM(C-means)
Da
ta
se
t
1
8 90
Minkowski Euclidean Cosine correlation
4.085±0.18 0 4.495±0.78
6 5.935±0.67
0
4.012±0.96 7 4.235±0.19
0 4.835±0.09
0
Da
ta
se
t
2
10 90
Minkowski Euclidean Cosine correlation
7.455±0.78 6 6.890±0.96
0 6.675±0.73
9
6.835±0.53 1 5.335±0.99
9 5.135±0.07
0
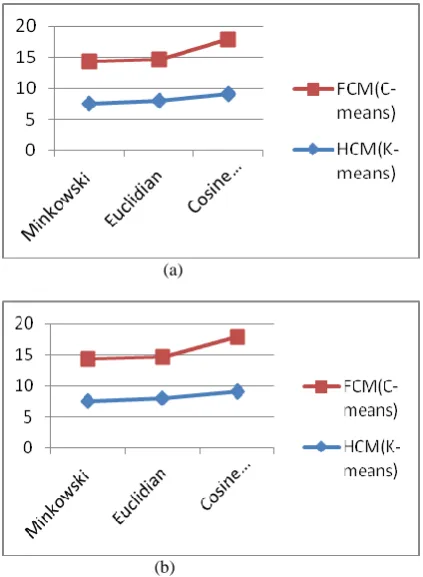
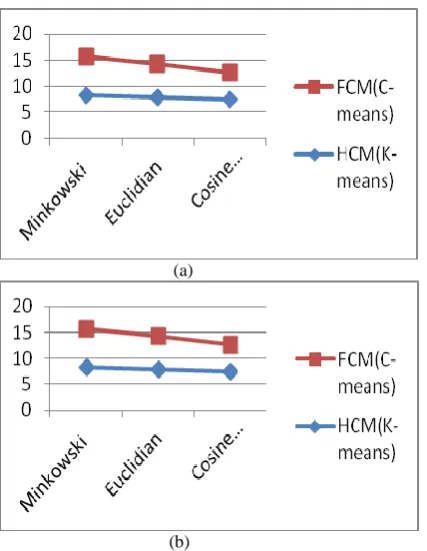
Table 2 and 3 shows the result of document clustering for both the algorithm’s (HCM and FCM). The average mean similarity is lower for the soft approaches as compared to hard approaches which might be the result of both centre localization of C-means or soft approaches.
(a)
(b)
[image:4.595.315.543.101.305.2][image:4.595.315.527.383.672.2]
(a)
(b)
[image:5.595.55.269.68.344.2]Figure-2: Comparative performance of new FCM and
HCM on Dataset 1 and Dataset 2 for 90 iterations.
6.
CONCLUSION
This paper presents an overview on comparison of hard and soft approaches where the soft approaches, which is popularly known as Fuzzy clustering algorithm that can be potentially suitable for the document clustering. An improvement of FCM clustering has been suggested in [15] and an empirical of hard and soft approaches has been performed on 2-dimensional datasets. Where it can be conclude that the Fuzzy clustering gives slightly better result compare to K-means clustering algorithm.
7.
ACKNOWLWDGEMENT
We would like to express our appreciation to “BANARAS HINDU UNIVERSITY” for the anonymous referees of the original datasets for the constructive comments they made. We would further like to express our pleasure to Mr. VIVEK KUMAR SINGH for giving us such opportunity to work with him in this area.
8.
REFERENCES
[1] Dunn, J., C., A Fuzzy Relative of the ISODATA Process and its Use in Detecting Compact Well-Separated Clusters, Journal of Cybernetics 3, pp. 32-57, 1973
[2] Bezdek, J., C., Pattern Recognition with Fuzzy Objective Function Algoritms, Plenum Press, New York, 1988
[3] L. Yanjun, “Text Clustering with Feature election byUsing Statistical Data,” IEEE Transactions on Knowledgeand Data Engineering, vol. 20, pp. 641-652, 2007.
[4] Valente de Oliveira, J., Pedrycz, W., Advances in Fuzzy Clustering and its Applications, John Wiley & Sons, pp 3-30, 2007.
[5] Anderberg, M. R., 1973. Cluster Analysis for Applications. Academic Press, Inc., New York, NY.
[6] Berkhin, P., 2002. Survey of clustering data mining techniques. Accrue Software Research Paper.
[7] Cios K., Pedrycs W., Swiniarski R., 1998. Data Mining – Methods for Knowledge Discovery, Kluwer Academic Publishers.
[8] Everitt, B., 1980. Cluster Analysis. 2nd Edition. Halsted Press, New York.
[9] Jain A. K., Murty M. N., and Flynn P. J., 1999. Data Clustering: A Review, ACM Computing Survey, Vol. 31, No. 3, pp. 264-323.
[10] Hartigan, J. A. 1975. Clustering Algorithms. John Wiley and Sons, Inc., New York, NY.
[11] Salton G. and Buckley C., 1988. Term-weighting approaches in automatic text retrieval. Information Processing and Management, 24 (5): pp. 513-523.
[12] Selim, S. Z. And Ismail, M. A. 1984. K-means type algorithms: A generalized convergence theorem and characterization of local optimality. IEEE Trans. Pattern Anal. Mach. Intell. 6, 81–87.
[13] Steinbach M., Karypis G., Kumar V., 2000. A Comparison of Document Clustering Techniques. TextMining Workshop, KDD
[14] Zhao Y. and Karypis G., 2004. Empirical and Theoretical Comparisons of Selected Criterion Functions for Document Clustering, Machine Learning, 55 (3): pp. 311-331