INTRODUCTION
In the area of industrial maintenance, Indus-try 4.0 is currently focusing on predictive main-tenance. The essence is to record a large amount of data to obtain the information about the cur-rent state of the machine and to predict this state of the machine in the near future. This informa-tion is the basis for planning and performing the necessary maintenance activities. Recording such amount of information also has the potential to monitor the ideal operation of the machine or to detect different heavier discoverable speed reduc -tions or delays. With fully automated manufactur-ing and manufacturmanufactur-ing systems in the automotive and electrotechnical industry, the effort is current -ly being made not on-ly to obtain the data on the status of individual machines or parts of them but also to monitor their activities online. We could say that this is an attempt to achieve comprehen-sive monitoring of such facilities.
In the case of industrial robots, the issue of comprehensive monitoring as a necessary re-quirement for fully automated work has only been addressed recently, due to their structural specificity and versatility in their use in various
applications. Different approaches to the most common methods of device diagnostics, includ-ing vibrodiagnostics, will need to be used in order to solve this issue. Unlike industrial robots, in the case of rotating machines, such as electric motors or pumps, at steady speeds and vibrational vibra-tion measurements, the vibravibra-tions typically have the character of forced oscillation with the excita-tion frequency in dozens of hertz. The movement of industrial robots can also be regarded as a pe-riodical work, to some extent, because the work-ing cycle is performed with some periodicity, but from the point of view of oscillation theory, it is primarily a set of transition phenomena closely related to the frequent changes in the direction and velocity of the robot. In the case of commonly used vibrodiagnostic methods for detecting bear-ing failures, we found that they are ineffective in industrial robots because, unlike rotary machines, robot movements are performed at slower speeds, have a short duration, and robot configuration changes in its movement, thereby changing load-ing of individual bearload-ings. For this reason, online diagnostics will focus on the issues related to re-leasing the end effector link with the robot arm flange and non-obliquity or mistaken grasping of Volume 13, Issue 1, March 2019, pages 68–78
https://doi.org/10.12913/22998624/103381
Specification of the Application of Vibrodiagnostics in Assessing
the State of the Industrial Robot
Naqib Daneshjo
1*, Zuzana Hajduová
1, Erika Dudaš Pajerská
1, Enayat Danishjoo
11 Faculty of Business Economics with seat in Kosice, University of Economics in Bratislava, Slovakia
2 Thk Rhythm Automotive GMBH, Duesseldorf, Germany
* Corresponding author’s e-mail: [email protected]
ABSTRACT
The research presents the measurement of vibrations on KUKA industrial robot and their subsequent evaluation.
The work first deals with vibro-diagnostics and its position in the field of maintenance and then discusses the issue
of its use in monitoring the status of industrial robots. The practical part describes the performance and analysis of the vibration measurement in order to assess the possibilities of applying the vibrodiagnostics in assessing the state of a robot during operation.
Keywords: Industrial robot, vibrodiagnosstics, IEPE, measurement, industry 4.0.
Research Journal
Accepted: 2019.02.12the handling object due to a mechanical error in the finger grippers or leakage of the suction cup while using a vacuum head.
The essence of analyzing the recorded robot data is to compare the obtained reference fre-quency spectrum for a particular section under ideal conditions with the frequency spectrum obtained for the same section in carrying out the work activity.
MEASUREMENT OF ROBOT VIBRATION
The purpose of vibration measurement is to find out whether it is possible to reliably record and analyze the different states of industrial ro -bots with respect to the object they are handling, or the technological operation being performed. Such a state can be considered, for example, the non-obliquity of the robot end-to-end manipula-tion object. Furthermore, under such a condimanipula-tion we can imagine a mistaken grasp of the object of manipulation, in the sense that the object of ma-nipulation will be grabbed, but it will have some will and its grasping will not be perfect and safe or release the end effector connection with the ro -bot arm flange.
The vibration measurement itself was per-formed on the KUKA KR 180-2 2000 angular in-dustrial robot (Fig. 1). This type of robot has six degrees of freedom which in practice means that we can independently program up to six driven robot drives to achieve the desired position. The move-ment of the robot is enabled by six electric motors and its weight is 1 267 kg. It has a carrying capacity of up to 100 kg with an accuracy of repeatability up to the same point of less than 0.1 mm.
As a measuring instrument, the National In-struments NI-9234 measuring board (Fig. 2), which can record a dynamic signal for high preci-sion measurements from an integrated electronic
piezoelectric (IEPE) sensor, such as an acceler-ometer, was used for measurement. This card has four input channels that can simultaneously receive data at up to 51.2 kS/s and each of these channels has a built-in anti-aliasing filter that au -tomatically adapts to the sampling frequency of the measured signal. It is capable of operating in an ambient temperature ranging from -40°C to 70°C and is suitable as a portable measuring de-vice for vibration measurement of industrial ma-chines and their parts [10,11].
A compatible IEPE acceleration sensor of the PCB version was used for the measurement, with a sensitivity of 100 mV/g. This highly sensi-tive accelerometer is capable of recording vibra-tions over a wide frequency range from 0.5 Hz to Fig. 1. Industrial robot KUKA KR 180-2 2000
Fig. 2. Measuring card National Instruments NI – 9234 [10]
10000 Hz with an acceleration measuring range of ± 50 g. A body made of ceramics was used as a sensing element. The position of the accel-erometer in the measurement is on the flange at the end of the robot arm and can be seen in Fig. 3. The reason for selecting this location is that it constitutes the closest possible position to the free end of the open kinematic chain of the robot arm, where the negative effects of the inertia and arm compliance are manifested to the greatest extent at different loads [1].
PROCESS OF MEASUREMENT
The measurement consisted in sensing a sig-nal describing vibrations of an industrial robot, which during the measurement performed repeat-edly uniform rectilinear reciprocation in the y-axis. Measurement without load was conducted first. Subsequently, a 20 and 40 kg load were ap -plied to the end effector, and the response of the mechanism under these loads was investigated.
The last measurement was the situation where the 40 kg load was not firmly fixed with the possi -bility of minimal movement. The robot was pro-grammed to perform the movements according to the program in Tab. 1.
As can be seen, this is a program with an end-less cycle, which means that the robot would, without human intervention, perform the rectilin-ear movements constantly, indefinitely. In order to terminate the robot movements, a manual stop was selected, which could simulate the behavior of the robot while pushing the STOP button or suddenly stopping the robot, for example, in the event of a power failure.
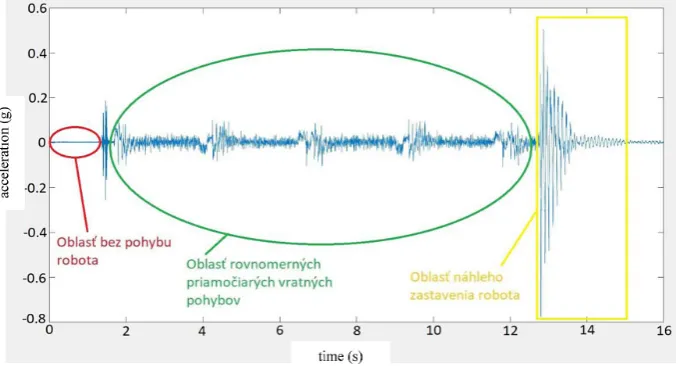
The movements of the robot are well-described and can be seen in Fig. 4. This figure describes the time dependence from the measured acceleration amplitude and in the right part it is possible to see the region with the largest amplitudes. This is the area of the end of the robot movement, and the reason for these greatest amplitude values is pre-cisely the way of its completing. As this is a sud-den process, the robot movement is not blocked, Table 1. Robot motion program
1 INI Initialization
2 PTP HOME Vel= 100% Default Moving to the starting position (implicitly defined in the control system)
3 PTP P1 Vel= 100% PDAT5 TOOL [10] BASE [0] Move to the starting position of repeated movements
4 loop The beginning of the endless loop
5 LIN P2 Vel= 2m/s CPDAT8 TOOL [10] BASE [0] Moving the line to position P2 at a speed of 2 m/s 6 LIN P1 Vel= 2m/s CPDAT8 TOOL [10] BASE [0] Reverse the line to P1 at a speed of 2 m / s
7 endloop End of the endless loop
8 PTP HOME Vel= 100% Default Moving to the starting position (implicitly defined in the control system)
but on the contrary, it stops immediately, resulting in the greatest amplitude of vibration acceleration. While analyzing the data, we did not consider the area of sudden stopping of the robot movements, because such a stoppage would not occur in the normal course of the robot’s work.
The middle and longest part of the diagram is the area of uniform rectilinear reciprocating movements. In this area, the robot moves along the line in one direction to a point where it changes its direction of motion to the opposite and returns to the starting position, and such action is repeat-ed once more. The path between these points in which the direction is changed is the same for all measurements. After completing the entire cycle, the direction of movement is changed again, the direct motion is performed, and the program stops manually. Since it is a manual stop, the length of the movement path between the last change of di-rection and the stop will not be the same but will always be shorter than while performing the pro-grammed cyclical movement backwards. Stretch-es with increased vibration acceleration valuStretch-es in the middle area represent the changes in the direc-tion of movement of the robot.
ANALYSIS OF RESULTS
All measured data providing robot vibration information for the above-mentioned movements were further processed and analyzed using the MATLAB computer software. It is a program-ming environment that has its own programprogram-ming
language and serves to measure and process signals, design algorithms, perform scientific-numerical calculations, and the like. It was de-veloped by the American company MathWorks. This company specializes in the research and development of mathematical computer software and as its other major product can be mentioned the Simulink computer application, which is de-signed for simulation and modeling of dynamic systems [7, 8, 9].
Area without robot movement
As explained above, at the beginning of each measurement sequence, an area occurs when the robot does not move. During this time, vibration signals are recorded, but the robot movement is zero. As the start of the robot’s movement is performed by a manual start of the program, the duration of this area will not be the same for the different sequences of measurement. Therefore, to analyze the data and then present the results, it is necessary to determine whether this delay in the start of the robot’s movement is affected by these measurements.
In order to reveal this fact, we used the fact that MATLAB allow to select a certain amount of time from the entire measured signal in one mea-surement sequence. Thus, from the whole signal, we first removed the robot’s sudden stop zone and then converted the modified signal from the time domain by means of a fast Fourier transform into the frequency domain. We then compared the data obtained with the same signal, but we also
removed the area without the robot’s movement, and we also transferred it to the frequency domain.
Thus, detecting the extent of the area with-out robot motion is based on the comparison of the frequency spectra generated from one signal at a certain load of the robot end effector, one spectrum representing the entire time domain, in-cluding the non-robot section, and the second one only the section with a uniform reversible move-ment of the arm.
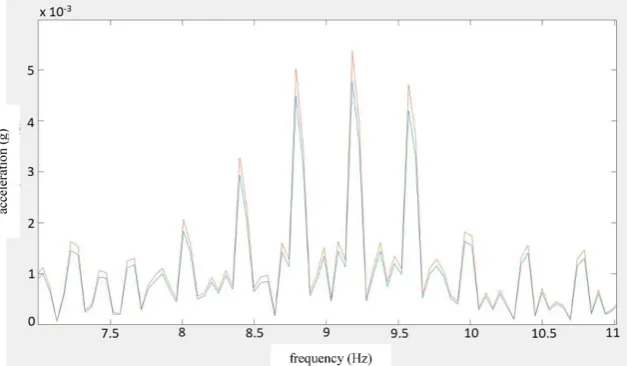
Details for the lower frequencies of such a comparison can be seen in Fig. 5. The orange color shows the spectrum for the signal without considering the area without robot movement, and the blue color is the spectrum corresponding to the whole time zone. These spectra represent the response of the robot mechanism while mov-ing without a load. It can be seen from the graph that the differences between amplitudes at the same frequencies reach the minimum values and therefore we can assert that the inclusion of an area without robot movement in the measurement evaluation does not affect the result of the spec -tral analysis. This conclusion applies to the entire frequency range that has been analyzed.
In order to verify this assertion, the same measurements were performed with the different arm loads, with the results being the same as the no-load measurement.
The area of uniform linear motion of the robot in the y-axis
On the basis of the stated objective of mea-surement, the subject of this research is to reveal
and clarify the possibilities of detecting real-time deviations from the faultless operation of the ro-bot with respect to the object of manipulation in monitoring its state. For this clarification, it is most advantageous to use the area of straight for-ward motion of the robot, since this area is the periodically performed routine work cycle.
The first was the measurement of vibrations in the y-axis of the KUKA industrial robot. It is clear from the description of the course of the measure-ments that the zero load of the robot was carried out in this axis and then the loads of the end ef-fector weighing 20 kg and 40 kg. The recorded signal from these measurements was transformed for the analysis purposes with a fast Fourier trans-form in order to obtain an acceleration amplitude spectrum. With the signal used for this modifica -tion, the area of sudden stoppage was removed before its implementation. The reason for this re-moval is the fact that while monitoring the normal operating state of the robot, a specific situation should not occur in a sudden stop without occur-rence. As far as the robot area is concerned, it was not neglected in this transformation, because as verified above, this area has no impact on the measurement results.
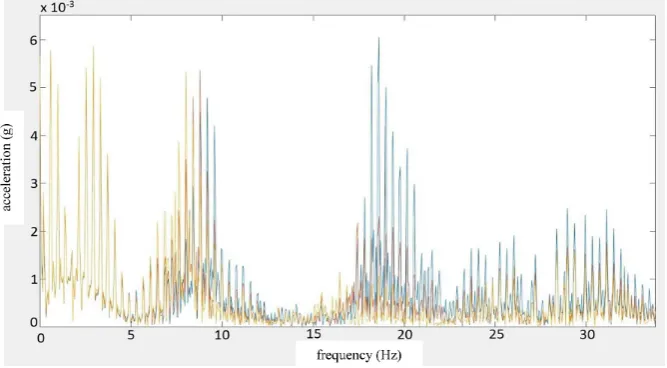
Comparison of the frequency spectra at the above-mentioned loads is possible for equiaxial rectifiers of the robot return movements in the y-axis in Fig. 6. The blue curve represents the amplitude spectrum of the acceleration during no-load movement, while the orange color shows the beam at the weight of the 20 kg robot arm, and the yellow color describes the spectrum with a load of 40 kg.
In this graph containing three amplitude ac-celeration spectra, a range of frequencies ranging from 18 Hz to 20.5 Hz can be seen. This is the appropriate band for assessing the differences in the different loader effects of the robot end ef -fector. This area is suitable because the ampli-tude difference is most evident in the range of frequencies. In the unloaded robot operation, the largest amplitudes are reached in this range com-pared to other loads, with the increase in these values markedly decreasing as the load increases. Further, it could be seen that while increasing the load of the robot end effector, the frequencies of significant components of vibration were shifted to lower values.
Consequently, we can say that while execut-ing the robot motion in its y axis, we are able to detect, by monitoring, recording and analyzing vibrations, a change in the load on its end arm based on the amplitude changes in the frequency band from 18 Hz to 20.5 Hz, and on the fact that the shift of frequencies of significant components changes along with the load. On the basis of this finding, it is possible to detect the different states of the manipulated object by means of vibro-di-agnostic methods and the carry out comparison of the spectrum in the robot’s operation, such as its grasping or not ending with the end effectors.
Measurements with fixed load and load with minimal movement
Another measurement was carried out in the y axis where the load of the end arm was not se-cured firmly but was left with the possibility of minimal movement. The response of the robot
mechanism to this situation was recorded at a load of 40 kg.
The analysis of this type of measurement is based on the comparison of two amplitude spec-tra of acceleration at the same load, one spectrum characterizing the vibrations of a fixed load attach -ment and the other one in the attach-ment of the load with the possibility of minimal movement. In order to obtain these spectra, the time-dependent signal, as in the previous case, had to be convert-ed to an amplitude spectrum using a fast Fourier transform. During the transformation, the abrupt stop area was omitted for the reasons already men-tioned, while the robot-free area was considered.
Comparison of two spectra at the same load of 40 kg is shown in Fig. 7. The blue color shows a fixed weight beam with this weight, and the orange color describes the spectrum represent-ing the case with the possibility of minimal load movement. As can be seen, the greatest difference in the amplitude of these spectra, and thus the area clearly describing the degree of attachment quality, is at the frequencies from 115 Hz to 132 Hz. At this frequency range, the variations within the amplitude of the load with the possibility of its minimal movement significantly outweigh the amplitude values for the spectrum characterizing the rigidly attached load.
The existence of a significant difference in the amplitude acceleration spectra within the fre-quency range from 115 Hz to 132 Hz with the same load with a different quality of its fixation when the robot moves in a y axis suggests that by means of vibrodiagnostic robot monitoring of the manipulated object and states of mounting the
handling object can be conducted. This fact can be used in practice to detect the reliability, cor-rectness and safety of gripping the manipulated object. Furthermore, such detection could also serve to detect the release of the effector link with the robot arm.
Comparison of partial movements of different lengths
Previous data analysis was performed over the entire area of uniform rectilinear recipro-cal motion, which represents one robot working cycle. In practice, however, such a working cycle typically takes a longer time than our simple ex-ample of the model cycle and, moreover, the indi-vidual work cycle segments in the normal opera-tion do not indicate as high periodicity as in our
case. However, this model shows that robot status monitoring with regard to the manipulation ob-ject or the end effector is meaningful by means of vibrodiagnostics, but in the case of practical use, it is only necessary to focus on certain important sections, such as a shifting section.
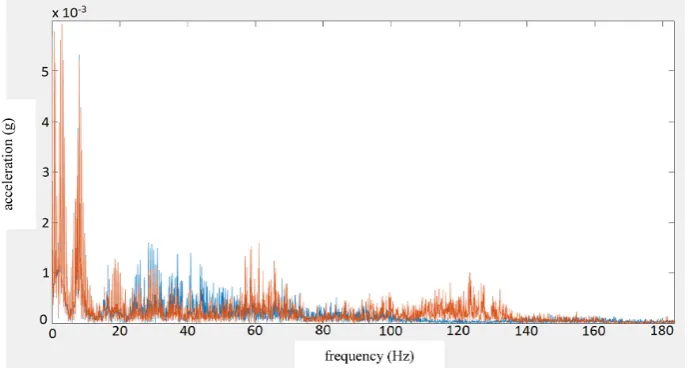
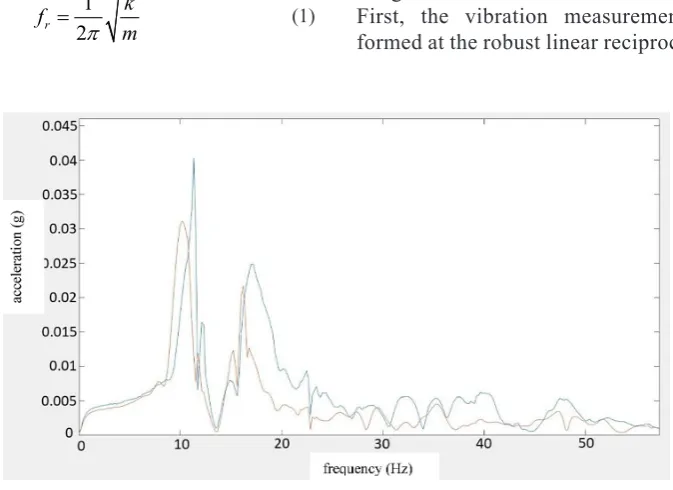
In Figure 8, there is a comparison of the se-lected section with a sudden change of direction of movement of the robot without load (blue), the same section with a sharp change of direction of motion and part of the constant speed section with the same load (orange) and the same section with a sharp change of direction of motion with a con-stant velocity (yellow).
From this chart, at lower frequencies, we can see that the longer the constant-velocity segment in the shift direction analysis we are considering, the more Fig. 8. Comparison of acceleration amplitude spectra for partial sections of different lengths
the amplitude decreases at significant frequencies, but they remain the same. From a practical point of view, it is therefore preferable to accurately separate the section with a sharp change of the direction of travel and the subsequent constant speed section in order to avoid undesirable distortion.
Custom robot arm frequencies
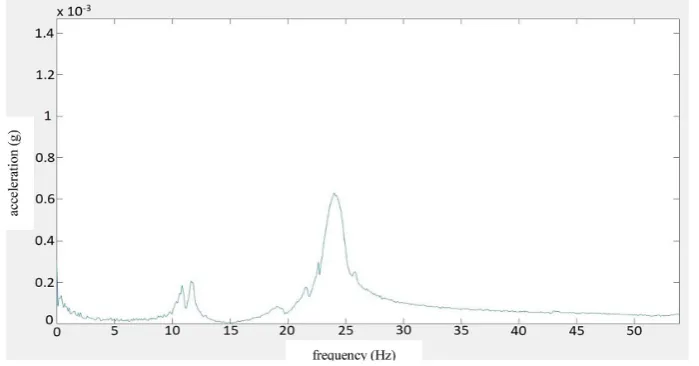
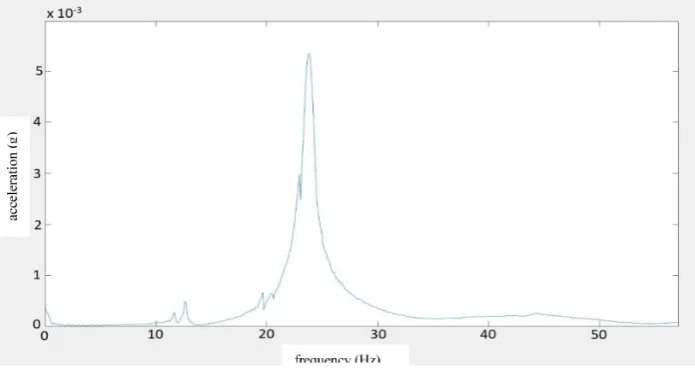
The principle of measuring own frequencies was to build vibration by striking the robot end effector in the direction of the axis of measure -ment and to record the response to that build. Sub-sequently, the recorded signal was transformed by means of a fast Fourier transform in order to obtain an acceleration amplitude spectrum, and these spectra for the axes x, y and z are shown in Figures 9, 10 and 11.
From the dependencies above if follows that the assumed assumption of the specific oscillation oscillation in the y axis was confirmed, because in measuring the vibration of the robot, oscillations in the x and z axes are similar while the oscilla-tion for the y axis is different. In this comparison, we neglect the magnitude of the acceleration am-plitudes, since they depend only on the size of the knock force of the robot end effector, and as this tap was performed manually, it is understandable that the measurements were not made in all three axes by the same force.
Impact of the load on the robot’s own frequency
In order to analyze this effect, a section of manual robot arrest was selected precisely be-Fig. 10. Custom y-axis robot frequencies
cause the inertia forces that cause the system to climb are most pronounced at this sharp stop. Comparison of the spectrum without load and the load in axes x, y, z is presented in Figures 12, 13 and 14, respectively. In all of these graphs, the unloaded spectrum is shown in blue and the 22 kg spectrum is shown in red.
From these dependencies, it is obvious that with increasing the load of the robot its own frequencies are shifted to lower values. This reduction in frequency values in increasing the load of the end effector can be clarified by reference to the calculation of the intrinsic frequencies:
1 2
r k
f
m π
= (1)
Where: fr is the (resonant) frequency, k is the stiffness of the system, m is the mass of the system.
Although the stiffness of the industrial robot system is unknown, measuring in accordance with the formula showed that with the weight in-crease on the robot arm the value of the custom frequencies has decreased.
CONCLUSION
The aim of the research was to assess the possibility of using vibrodiagnostics in evalu-ating the state of the robot during operation. First, the vibration measurement was per-formed at the robust linear reciprocal motion of Fig. 12. Comparison of the spectrum with and without load in the x-axis
the robot in its y-axis motion at the various end effector loads. On the basis of the measured data, it was found that the frequency spectra at different loads differed sufficiently and thus, by comparing the spectra at different loads, vari -ous robot states could be detected. Under such a condition, we can imagine, for example, the non-obliquity of the end effector manipulation object. Furthermore, measurements with fixed load and load with minimal movement were conducted. While comparing the spectra with a different fastening quality, this variation was demonstrated, which in practice means that we are able to detect mistakes in handling the ob-ject of manipulation, or to release the end ef-fector coupling with the robot arm flange by means of vibro-diagnostics. Since these initial measurements showed that sensing the perfor-mance of vibro-diagnostic measurements in the industrial robot condition can be used for moni-toring, we focused on examining sections with a sharp change in direction of motion. In this analysis, we came to the conclusion that the more accurately we can separate a segment with a sharp change of direction from the constant speed section, the less the frequency spectrum is distorted. Subsequently, we made a measure-ment of the custom frequencies of the industrial robot in its x, y and z motion axes, where it was found that the oscillation waveform in the y-axis of the robot differs from the movement axes of robot x and z. The reason for this is that vibration damping in the y-axis is not only a result of the brakes in the individual robot arm actuators but also the bearings in the individual
robot joints. The last measurement carried out was the measurement in the axes of the robot x, y, and z without the load of the end effector and the load of the end effector. In order to analyze this effect, a manual stop section was selected and it showed that by increasing the weight of the robot end effector load its own frequencies are shifted to lower values. From the initial measurements and their analyses, it was un-equivocally revealed that the vibro-diagnosis measurements can reveal different states of the industrial robot relative to the manipulated ob-ject or its end effector. These measurements, however, were always performed with the same configuration of the robot arm, and further re -search in this area would be necessary. It would also be required to carry out research even in the more complex movements of the robot arm and at higher speeds.
Acknowledgement
This work has been supported by the Scien-tific Grant Agency of the Ministry of Education of the Slovak Republic (VEGA 1/0376/17).
REFERENCES
1. Ján Petróci, Martin Mantič, Oskár Sloboda: Power
loss in a combustion engine of a prototype vehicle. Diagnostyka, 18(2), 2017, 59-64.
2. Ján Buša, Ján Buša Jr., Miroslav Dovica, Michal
Fabian, Peter Ižol: An algorithm of a freeform sur
Advances in Science and Technology Research Journal, 11(3), 2017, 223-232.
3. Jaroslava Janeková, Jana Fabianová, Michal
Fa-bian: Assessment of the economic efficiency of
the modernization of crushed stone manufacturing process: case study. Advances in Science and Tech-nology Research Journal, 12(2), 2018, 237-243. 4. Jozef Kuľka, Melichar Kopas, Eva Faltinová, Mar
-tin Mantič, Peter Bigoš: Kinematic linkages in the
hinged undercarriage of a mobile working machine.
Scientific Journal of Silesian University of Technol -ogy. Series Transport. Vol. 91, 2016, 81-88.
5. Naqib Daneshjo, Erika Dudaš Pajerská, Miroslav Klimek, Enayat danishjoo: Software Support for Optimizing Layout Solution in Lean Production.
TEM Journal, 7(1), 2018, 33-40, DOI: 10.18421/ TEM71-05.
6. Naqib Daneshjo, Milan Majernik: Logistics of experimenting with strengthening the surface lay-ers of machine parts. Modern Machinery Science Journal, October, 2016, 1178-1184.
7. Tomáš Stejskal, Tatiana Kelemenová, Miroslav
Dovica, Peter Demeč, Miroslav Štofa: Information
contents of a signal at repeated positioning mea-surements of the coordinate measuring machine (CMM) by laser interferometer. Measurement Sci-ence Review, 16(5), 2016, 273-279.
![Fig. 2. Measuring card National Instruments NI – 9234 [10]](https://thumb-us.123doks.com/thumbv2/123dok_us/8805698.1774442/2.595.72.289.633.745/fig-measuring-card-national-instruments-ni.webp)