O R I G I N A L R E S E A R C H
Open Access
Volume-of-interest-based supervised cluster
analysis for pseudo-reference region
selection in [
18
F]DPA-714 PET imaging of
the rat brain
Igor Fagner Vieira
1,2, Dieter Ory
3, Cindy Casteels
2, Fernando R. A. Lima
1, Koen Van Laere
2, Guy Bormans
3and
Michel Koole
2*Abstract
Method:Aim of this study was to automatically select a suitable pseudo-reference brain region for the accurate, non-invasive quantification of neuroinflammation in a rat brain using dynamic [18F]DPA-714 PET imaging.
Procedures:A supervised clustering analysis approach considering three kinetic classes (SVCA3) was used to select an appropriate pseudo-reference brain region. This pseudo-reference region was determined by selecting only brain regions with low specific tracer uptake (SVCA3low) or by taking into account all brain regions and weighting each brain region with the corresponding fraction of low specific binding (SVCA3wlow). Both SVCA3 approaches were evaluated in an animal model of neuro-inflammation induced by lipopolysaccharide injection in the right striatum of female Wistar rats. For this study setup, a population of 25 female Wistar rats received a dynamic PET scan after injection of ~ 60 MBq [18F]DPA-714. Animals were scanned at baseline (n= 3) and at different time points after inducing neuroinflammation: 1 day (n= 3), 3 days (n= 12), 7 days (n= 4), and 30 days (n= 3). Binding potential (BP) values using a simplified reference tissue model (SRTM) and the contralateral striatum as pseudo-reference region were considered as a reference method (BPL STR) and compared with SRTM BP values using a pseudo-reference region obtained by either the SVCA3lowor SVCA3wlowapproach for both a 90- and 120-min acquisition time interval.
Results:For the right striatum, SRTM BP values using a SVCA3low- or SVCA3wlow-based pseudo-reference region demonstrated a strong and highly significant correlation with SRTM BPL STRvalues (Spearmanr≥0.89,p< 0.001). For the SVCA3lowapproach, Friedman tests revealed no significant difference with SRTM BPL STRvalues for a 120-min acquisition time while small but signification differences were found for a 90-min acquisition time (p< 0.05). For the SVCA3wlowapproach, highly signification differences (p< 0.001) were found with SRTM BPL STRvalues for both a 90- and 120-min acquisition time interval.
Conclusions:A SVCA3 approach using three kinetic classes allowed the automatic selection of pseudo-reference brain regions with low specific tracer binding for accurate and non-invasive quantification of rat brain PET imaging using [18F]DPA-714. A shorter acquisition time interval of 90 min can be considered with only limited impact on the SVCA3-based selection of the pseudo-reference brain regions.
Keywords:Supervised clustering analysis, Pseudo-reference brain region, [18F]DPA-714 PET, Rat brain, Neuroinflammation
* Correspondence:[email protected]
2Nuclear Medicine and Molecular Imaging, Department of Imaging and
Pathology, University Hospital and KU Leuven, Herestraat 49, B-3000 Leuven, Belgium
Full list of author information is available at the end of the article
Introduction
PET imaging of neuroinflammation has proven to be a valuable tool for studying and quantifying microglial activation in brain tissue associated with both healthy aging and neurodegenerative disorders such as Alzhei-mer’s disease (AD), Parkinson’s disease (PD), amyo-trophic lateral sclerosis (ALS), and Huntington’s disease (HD) [1–3]. As an imaging biomarker, the translocator protein 18 kDa (TSPO), formerly known as peripheral benzodiazepine receptor (PBR), is a well-established tar-get for PET imaging of neuroinflammation; since under healthy conditions, TSPO expression in the central ner-vous system is low while in response of neuronal insults upregulation is mainly induced in microglia, astrocytes, and endothelial cells. The most frequently used TSPO PET ligand is (R)-[11C]PK11195 which has several limi-tations in terms of high non-specific binding and poor signal to noise ratio. Therefore, other TSPO PET ligands have been developed such as [18F]DPA-714 which pre-sented lower non-specific binding and higher affinity for TSPO compared to (R)-[11C]PK11195 [4]. [18F]DPA-714 has been used for clinical PET studies including both healthy volunteers and patients suffering from neurode-generative diseases such as AD and ALS [5, 6]. In terms of PET quantification, a reference tissue model is less in-vasive, less prone to errors, and logistically less challen-ging compared to plasma input models as it avoids the need for arterial blood sampling. As such, this approach is better suited for routine practice and for longitudinal PET studies. However, in case of pathology-induced neu-roinflammation, the pattern of microglial activation is generally unknown and therefore extracting an appropri-ate reference brain region without additional patho-logical or histopatho-logical information may be challenging. A supervised clustering algorithm, called supervised clus-tering analysis (SVCA), has been proposed to automat-ically extract reference tissue time activity curves (TACs) from dynamic brain PET scans. This SVCA ap-proach has mainly been developed and applied for PET imaging of neuroinflammation with (R)-[11C]PK11195, although a similar approach was successfully applied for other tracers such as [11C]PIB [7], [11C]TMSX [8], and [11C]PE2I [9]. In short, it classifies PET voxels based on the assumption that each voxel TAC is a weighted sum of normalized TACs representing differ-ent, predefined kinetic classes. Next, the value of each PET voxel is multiplied with the corresponding SVCA weight representing the fraction of non-displaceable tracer binding and the reference tissue TAC is approxi-mated by the sum of weighted TACs of all PET voxels with the sum of weights normalized to one. Specifically for human (R)-[11C]PK11195 PET imaging of neuroin-flammation, the number of predefined kinetic classes ranged from ten [10] over nine [11] and six [12] to four
classes [13]. The latter SVCA4 approach uses predefined kinetic classes for activity in the blood pool, white matter uptake, gray matter uptake with low high specific binding, and gray matter uptake with high specific binding respect-ively. A SVCA4 based pseudo-reference tissue approach was also considered for human [18F]DPA-714 imaging of neuroinflammation [14]. Instead of applying appropriate weighting and including all PET voxels, this approach used a minimal threshold for the SVCA weights repre-senting the fraction of non-displaceable tracer binding and took into account only PET voxels with low specific uptake. As such, it showed a high correlation with the val-idated two-tissue compartment plasma input model while being more robust and more accurate than a reference tis-sue model using only the cerebellar gray matter as refer-ence tissue. In terms of preclinical SVCA for dynamic [18F]DPA-714 PET imaging of neuroinflammation in the rat brain, Sridharan et al. [15] evaluated a SVCA implementation with three kinetic classes representing
“activated tissue,” “normal tissue,”and “tissue with inter-mediate binding,”respectively. However, they only consid-ered a SVCA approach which included the TACs of all PET voxels with appropriate SVCA weighting to generate a reference tissue TAC.
Therefore, the primary aim of this study was to fur-ther evaluate the SVCA approach for non-invasive, simplified, and robust quantification and longitudinal monitoring of neuroinflammation in a rat model using [18F]DPA-714 PET imaging. For the validation, we used a rat model with local, unilateral neuroinflamma-tion in the right striatum induced by intracerebral and unilateral stereotactic injection of lipopolysaccharide (LPS). For this animal model, quantification of [18F]DPA-714 PET imaging using a simplified refer-ence tissue model (SRTM) and the contralateral region as reference tissue has been validated for monitoring local neuroinflammation [15–17] and can therefore be used as reference method for the evaluation of the SVCA approach. The secondary aim of this study was to evaluate the impact of a reduced acquisition time on the performance of the SVCA approach and on the ac-curacy of the resulting quantitative parameters.
Materials and methods
[18F]DPA-714 synthesis
in [18F]DPA-714 of > 98% radiochemical purity, with a 45–60% yield (non-decay corrected relative to starting [18F]F−radioactivity). The specific activity at end of synthesis ranged from 56 to 251 GBq/μmol. The precursor and reference compound were kindly provided by Prof. Michael Kassiou (University of Sydney, Australia).
Animal model
Twenty-five female Wistar rats (weight 189–330 g, age 2–3 months) were used for the study. The animals were housed in groups of two, at an average temperature of 22 °C and a 12-h light/dark cycle. Food and water were given ad libitum. Three rats were used for baseline PET scanning while the other 22 rats were scanned 1 day (1D, n= 3), 3 days (3D, n= 12), 7 days (7D, n= 4), and 30 days (30D, n= 3) after inducing neuroinflammation [16]. All animals were sacrificed after PET scanning. The animals scanned 3 days after inducing neuroin-flammation, consisted of two groups. For one group (3DA,n= 7), dynamic PET imaging was combined with ar-terial blood sampling to validate modeling of [18F]DPA-714 kinetics [17] while another group of animals (3 dB,n= 5) was scanned for longitudinal monitoring of neuro inflam-mation [16].
To induce neuroinflammation, stereotactic surgery was performed under ketamine (60 mg/kg intraperito-neal (IP)) and medetomidine (0.4 mg/kg IP) anesthesia using aseptic procedures. All animals were positioned in a stereotactic head frame (Stoelting, Wood Dale, IL, USA). A small hole was drilled in the skull at the appropriate location using Bregma as reference. Neuro-inflammation was induced by injecting 50μg of lipo-polysaccharide (LPS; E. coli 055:B5; Sigma Aldrich, St. Louis, MO, USA) in 4μl of sterile 0.9% NaCl solution into the right striatum at the following coordinates: 0.5 mm antero-posterior, 3 mm lateral, 5.5/4.5 mm dorso-ventral. After injection of 2μl, the needle was retracted for 1 mm dorsoventrally and another 2μl was injected. The needle was left in place for an additional 10 min before being slowly withdrawn from the brain. The contralateral side was injected as a control with 4μl of sterile 0.9% NaCl solution using an identical procedure.
MicroPET imaging
PET imaging was performed on a lutetium oxyorthosili-cate detector-based tomograph (microPET FOCUS-220; Siemens Medical Solutions, Malvern, PA) which has a nominative transaxial resolution of 1.35 mm full-width at half-maximum in the center of the field of view [19]. For dynamic PET imaging without arterial blood sam-pling, we used a multiple animal setup to allow the sim-ultaneous acquisition of three rat brains. As such, animals were positioned off center, achieving a volumet-ric resolution of approximately 8 mm3 [20]. Data were
acquired in a 128 × 128 × 95 matrix with a pixel width of 0.475 mm and a slice thickness of 0.796 mm. The coinci-dence window width was set at 6 ns.
Rats were injected with about 60 MBq of [18F]DPA-714 via a tail vein. During scanning, animals were kept under gas anesthesia (2.5% isoflurane in O2at a flow rate of 1 L/ min). Dynamic PET scans were acquired for 120 min in listmode. Acquisition data were then Fourier rebinned in 27 time frames (4 × 15 s, 4 × 60s, 5 × 180 s, 8 × 300 s, 6 × 600 s) and reconstructed using maximum a posteriori it-erative reconstruction.
For the 7 animals of the 3DA group, dynamic PET imaging was combined with arterial blood sampling. For this purpose, an arterial cannula was placed in the femoral artery. After slow bolus injection of [18F]DPA-714, arterial blood was collected continuously for 1 min (15 samples, approximately one sample of 40μl every 4 s allowing detailed (peak) blood input function with high time resolution), followed by 100-μl samples at 90, 120, 150 s and 3, 5, 10, 40, 60, 120, and 180 min. To prevent possible effects of blood volume changes and to flush the cannula, 100μl of saline was reinjected for the 90-min sample and all subsequent samples. All blood samples were immediately stored on ice to stop tracer metabolism. The plasma time–activity curve was corrected for the fraction of unchanged radi-oligand that was quantified using reverse-phase (RP) HPLC (LaChrom Elite HPLC system; Hitachi, Darm-stadt, Germany; Chromolith C18, 3 mm × 100 mm; Merck, MA).
Supervised cluster analysis for preclinical [18F]DPA-714 brain PET
For this study, the SVCA approach for preclinical [18F]DPA-714 PET scanning of rat brains was limited to a volume-of-interest (VOI)-based approach and aimed at classifying rodent brain VOIs as either a pseudo-reference brain VOI or a brain VOI affected by neuroinflammation. For this purpose, spatial normalization of the dynamic PET data was done manually by adjusting translation, rotation, and scaling parameters while visually assessing the alignment to a T2-weighted rat brain template [21]. This way, the VOIs predefined on the template were projected onto the PET dynamic data to generate the corresponding TACs.
A SVCA3 approach was proposed which took into ac-count three separate, predefined kinetic classes: one kin-etic class representing brain tissue with low specific tracer binding (Klow), one kinetic class representing brain tissue with high specific tracer binding (Khigh), and one kinetic class representing extra cerebral tracer signal (Kext).
TACnVOI¼wlow;VOITACnlowþwhigh;VOITAC n
highþwext;VOITACnext ð1Þ
In Eq. (1), TACnVOIis the normalized TAC of a specific brain region while TACnext represents the extra cerebral kinetic classKext. TACnlowand TACnhigh are the represen-tative normalized TACs of the kinetic classes Klow and Khigh. The parameterswlow, VOI, whigh, VOI, and wext, VOI are the respective weight factors of the three different kinetic classes, estimated for each brain region by a re-gression procedure while constraining all weights to positive values and normalizing their sum to one.
To generate normalized TACs for the different brain VOIs, the mean uptake value of each frame of the dynamic PET scan was subtracted from all voxels within that frame after which all voxels within that frame were divided by the standard deviation of take values of the corresponding frame. The mean up-take value and standard deviation of upup-take values of each frame were determined by taking into account only voxels within a predefined brain mask, corresponding to the brain template.
Since TAC normalization was performed on a voxel level, the normalized TAC for a VOI ofNvoxels (Eq.1) can also be expressed as:
TACnVOI¼XNTAC
n i
N ¼TAC
n low
X
N
wlow;i
N
þTACnhighXNwhigh;i N
þTACnextXNwext;i N ð2Þ
Therefore, the weights of the different kinetic clas-ses on a VOI level are identical to the averages of the corresponding weights of all voxels included in the VOI. For our VOI-based approach, normalized TACs were generated for 16 brain regions using a prede-fined VOI map: the right and left striatum, cerebel-lum, right and left frontal cortex, right and left temporal cortex, right and left sensor motor cortex, right and left hippocampus, right and left thalamus, right and left hypothalamus, and midbrain. Next to
the these brain regions, a brain mask for
extra-cerebral PET signal was generated by dilating the brain mask corresponding to the brain template (IDL 8.4 dilate function with 2.0 × 2.0 × 2.0 mm struc-turing element) and subtracting this dilated brain mask from the non-dilated brain mask (“exBrain” mask). On the other hand, the brain mask corre-sponding to the brain template was eroded (IDL 8.4 erode function with 4.0 × 4.0 × 4.0 mm structuring element) to generate a brain mask with minimal contribution of the PET signal from extra cerebral
bone and soft tissue regions, surrounding the brain (“inBrain” mask).
Next, TACnlowwas obtained as the average normalized TAC of the three normalized, dynamic PET scans prior to LPS injection by applying the“inBrain”mask. For all animals except for the animals scanned at day 3 after LPS injection, TACnhigh was determined as the average of the normalized, right striatal TAC of all 12 normal-ized, dynamic PET scans at day 3 after LPS injection. In order to allow an objective analysis of the dynamic PET scans at day 3 after LPS injection, the normalized, right striatal TAC of the 3DA group, consisting of 7 animals with combined dynamic PET imaging and arterial blood sampling, was used as TACnhigh for the analysis of the 3 dB group, consisting of 5 animals with only dy-namic PET imaging and vice versa. TACnext was deter-mined on an individual basis by applying the“exBrain” mask to the normalized dynamic data of each animal separately.
Since 90 min dynamic PET data also provided stable BPNDestimates for the quantification of the [18F]DPA-714 binding using SRTM with the contralateral striatum as reference tissue, the regional SVCA3 weights of the kin-etic class Klow (wlow) were compared for a 90- and 120-min acquisition time interval. For this purpose, a re-peated measures two-way ANOVA with Bonferroni post hoc tests was performed with a significance level of 0.05 (SPSS version 24.0).
Two different strategies were evaluated to determine the pseudo-reference TAC (TACpREF). In a first ap-proach, a TACpREFwlow was calculated as the average of the non-normalized TACs of the 16 different brain regions weighted by their corresponding SVCA3 weighting fac-torwlow,iand volumevi:
TACpREFwlow ¼ P16
iP¼0wlow;iviTACi 16
i¼0wlow;ivi ð
3Þ
TACpREFlow ¼ P
wPlow;i>0:95viTACi
wlow;i>0:95vi
ð4Þ
Right striatal binding potential values obtained with SRTM and using TACREFL STR of the left striatum as refer-ence TAC (BPL Str) were compared with SRTM BPwlow, and BPlowof the right striatum calculated with TACpREFwlow and TACpREFlow as pseudo-reference TAC respectively. For this purpose, a non-parametric repeated measures one-way ANOVA (Friedman test) with Dunn’s multiple comparison post hoc tests was performed, together with a correlation analysis and linear regression analysis (Prism GraphPad version 5.01). For all statistical tests, a significance level of 0.05 was used.
Results
Normalized kinetics and kinetic classes for preclinical [18F]DPA-714 brain PET
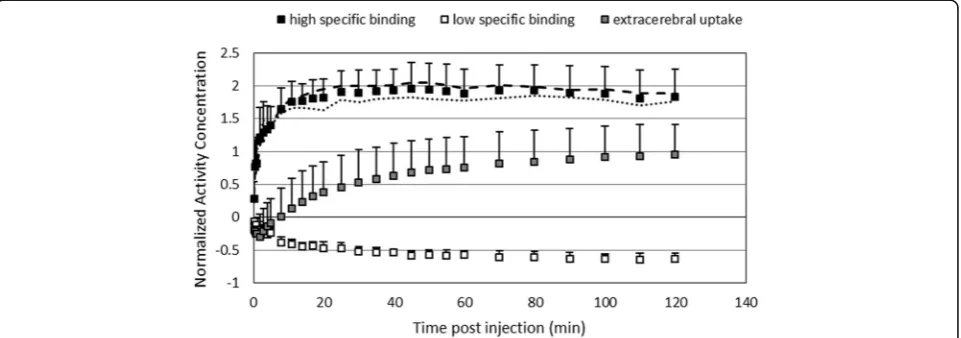
In terms of normalized kinetics, Figure 1 presents the average, normalized TACs, TACnlow , TACnhigh , and
TACnext, for the different kinetic classes Klow, Khigh, and Kext with TACnext being determined on an individual basis. Two TACnhigh curves, determined for two different groups of animals scans at day 3 after LPS injection, were also presented to demonstrate the excellent repro-ducibility of the normalized TACnhigh for high specific binding. More specifically, these two groups were a group of 7 animals with combined dynamic PET im-aging and arterial blood sampling and a group of 5 ani-mals with only dynamic PET imaging.
In Figure 2, average SVCA3 weighting coefficients whighdetermined for both a 90- and 120-min acquisition
time interval are presented for the different time points after LPS injection (day 1, (n= 3), day 3 (n= 12), day 7 (n= 4), and day 30 (n= 3)), demonstrating the laterality of the induced inflammation and the extensive inflam-mation in the right striatum which picks up at day 1, peaks at the day 3, and gradually decreases at day 7 and at day 30 after LPS injection. Figure 3 presents the resulting average weights wlow for the kinetic class Klow using SVCA3 and a 90-min and 120-min acquisition time interval. Repeated measures two-way ANOVA with Bonferroni multiple comparison post hoc tests demon-strated no significant interaction between brain regions and a reduction in acquisition time for the wlow tissue weights and revealed no significant differences between the regionalwlowtissue weights using a 90- and 120-min acquisition time interval.
In terms of animal specific brain regions represent-ing low specific bindrepresent-ing (individual, regional tissue weighting factors wlow greater than 0.95), the number of selections of a brain region as pseudo-reference re-gion for the different [18F]DPA-714 microPET brain scans is presented in Figure 4 for both a 90- and 120-min acquisition time interval while brain regions which were not selected as pseudo-reference region, were not mentioned.
In order to allow a visual comparison of the result-ing pseudo-reference TACs of the different SVCA ap-proaches, Figure 5 presents the average TAC of the left striatum as reference TAC, together with the average pseudo-reference TAC estimated by selecting brain regions with only low specific tracer uptake or by taking into account all brain regions and weighting each brain region with the corresponding fraction of low specific binding.
Fig. 1Average normalized time activity curves for the different kinetic classes representing high specific uptake (n= 12), low specific uptake (n=
3), and extra cerebral uptake (n= 25). Next to the normalized time activity curve for high specific uptake averaged over all 12 dynamic [18
F]DPA-714 PET scans at day 3 after LPS injection, the average normalized time activity curve for high specific uptake is presented for the two groups of
animals scans at day 3, a first group of 7 animals with combined dynamic [18F]DPA-714 PET scanning and arterial blood sampling (dashed line)
Fig. 2Overview of the average tissue weighting coefficientswhighof the kinetic class representing high specific tracer uptake of [18F]DPA-714 in
a rat brain at 1 day (1D,n= 3), 3 days (3D,n= 12), 7 days (7D,n= 4), and 30 days (30D,n= 3) after LPS injection in the right striatum. Values are
presented for both a 90-min and 120-min acquisition and for the right and left striatum (R-L STR, right and left frontal cortex (R-L FC), right and left temporal cortex (R-L TC), right and left sensor motor cortex (R-L SMC), right and left hippocampus (R-L HC), right and left thalamus (R-L TL), right and left hypothalamus (R-L HTL)), cerebellum (CBL), and midbrain (MB)
Fig. 3Overview of the average tissue weighting coefficientswlowof the kinetic class representing the low specific binding of [18F]DPA-714 in
healthy rat brain tissue, averaged over various time points (n= 22) after LPS injection in the right striatum. Values are presented for both a 90-min
Quantification of the [18F]DPA-714 brain PET using a pseudo-reference region
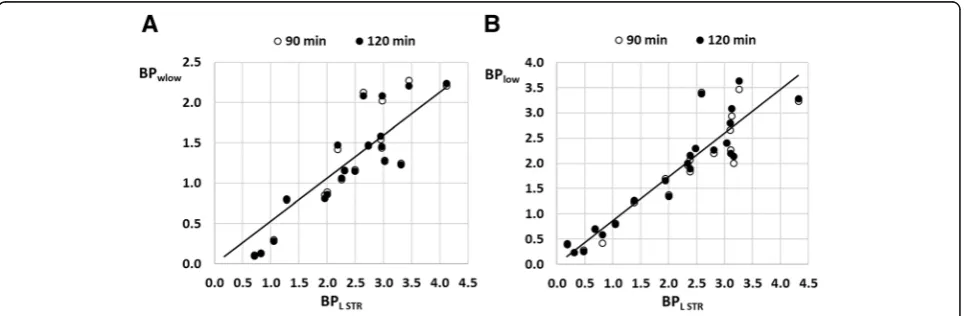
Spearman correlation coefficients between BPL STR and BPwlow, and between BPL STRand BPloware summarized in Table 1 for both a 90-min and 120-min acquisition time interval, together with the slope of the linear regres-sion. All correlations were highly significant (p< 0.001). Non-parametric repeated measures one-way ANOVA (Friedman test) demonstrated significant differences be-tween BP values of the different approaches. Dunn’s multiple comparison post hoc tests revealed significant differences between BPL STR and BPwlow for 120-min
acquisition time interval (p< 0.001) and between BPL STR and BPlow (p< 0.05) and between BPL STR and BPwlow (p< 0.001) for a 90-min acquisition time. On the other hand, no significant differences were found between BPL STR and BPlow for 120-min acquisition time interval. Figure 6 gives an graphical overview of the correspondence between BPL STR on the one hand and BPwlowand BPlowon the other hand for the SVCA3 approach using both a 90-min and 120-min acquisition time interval.
Discussion
The aim of this study was to translate an SVCA ap-proach to a preclinical setting and to enable the auto-matic selection of pseudo-reference brain regions with low specific [18F]DPA-714 binding in a rat brain. This way, non-invasive pseudo-reference tissue models can be applied for accurate quantification without prior know-ledge about the spatial distribution of neuroinflammation, therefore enabling longitudinal, intra-animal monitoring of neuroinflammation and reducing or refining animal PET studies.
For human PET imaging of neuroinflammation using [18F]DPA-714, four kinetic classes were considered based on the dynamic PET data of healthy controls, where the blood pool class was extracted from manually segmented carotid arteries, the white matter class from white mat-ter segmentations, the low specific binding class from cerebellar gray matter, and the high specific binding class from tracer uptake in the thalamus [14]. Since the volumetric resolution of our small animal PET system was around 8 mm3, it was not possible to resolve distinct gray and white matter kinetics in the rat brain. More-over, we were unable to extract a blood pool class from Fig. 4The number of selections as pseudo-reference region or
region representing low specific binding (tissue weightwlowof the
kinetic class representing the low specific binding greater than 0.95)
considering 22 [18F]DPA-714 brain microPET scans at different time
points after LPS injection in the right striatum (right thalamus (R TL R), left striatum (L ST), left frontal cortex (FC L), left temporal cortex (TC L), left sensor motor cortex (L SMC), left hippocampus (L HC), left thalamus (L TL), left hypothalamus (L HTL), cerebellum (CBL), and midbrain (MB)). Brain regions which were not selected as reference region are not mentioned
the dynamic brain PET data, and extraction from the left ventricle of the heart was not possible due to field of view limitations. Therefore, we reduced and reassigned the number of classes to three kinetic classes in line with the approach presented by Sridharan et al. [15]. How-ever, we only considered a class for low and high specific binding and did not consider an intermediate binding class, contrary to the approach of Sridharan et al., since it was hypothesized that SVCA mis-identified some
“intermediate” binding voxels as normal tissue [15], leading to lower and slightly more variable BP values and thus explaining the significant difference seen when estimating BP with the SVCA approach. Instead, we in-cluded a kinetic class representing PET signal in soft tis-sues surrounding the brain such as the Harderian glands and in the extra cerebral bone structures due to defluori-nation [22–24]. Since we did not have CT data to facili-tate the definition of the brain mask and the spatial normalization of the dynamic PET data [25], this extra-cerebral kinetic class allowed us to take into ac-count small normalization errors, especially in the cor-tical regions as these regions are more susceptible to suboptimal alignment.
Instead of a voxel-wise approach, we opted for a VOI-based approach to define the most appropriate pseudo-reference region from a set of predefined brain VOIs. Since the weights for the different kinetic classes on a VOI level correspond to the average of the corre-sponding weights of all voxels included in the VOI (see Eq.2), appropriate weighting of different TACs to define a pseudo-reference tissue TAC should be valid for both a VOI and voxel-based approach while the impact of noise is expected to be lower for a VOI-based approach. Moreover, a voxel-wise approach could require a vary-ing, animal-specific threshold in order to select a suffi-cient number of voxels and obtain adequate statistics. This could be challenging, especially since only a few hundred voxels are available when taking into account the volume of a rat brain (1.4 cm3) and the 8 mm3 vol-ume resolution of the our small animal PET system. The number of available voxels actually relates to the clinical setting by a ratio of 100 since the spatial resolution of current clinical PET systems is around 4.5 mm while the volume of the human brain is approximately 1400 cm3. On the other hand, considering predefined brain struc-tures for the selection of pseudo-reference regions
Table 1Spearman correlation and linear regression analysis between SRTM BP values for the right striatum at different time points
after LPS injection using a 90- and 120-min acquisition time interval, comparing BPL STRusing the left striatum as reference region with
BPwlowusing all brain regions weighted with the corresponding SVCA3wlowweights to generate a virtual pseudo-reference region and
with BPlowusing brain regions with corresponding SVCA3wlowweights greater than 0.95 to define a composite pseudo-reference region SVCA3 (90-min acquisition time) SVCA3 (120-min acquisition time)
BPL STRvs BPwlow BPlow BPwlow BPlow
Spearmanr 0.91 0.91 0.93 0.91
Slope linear regression 0.53 0.86 0.52 0.87
Fig. 6Linear correspondence between SRTM BP values for the right striatum at different time points after LPS injection using a 90- and 120-min
acquisition time interval, comparing BPL STRusing the left striatum as reference region with BPwlowusing all brain regions weighted with the
corresponding SVCA3wlowweights to generate a virtual pseudo-reference region (a) and with BPlowusing brain regions with SVCA3wlow
weights greater than 0.95 on an individual animal level to define a composite pseudo-reference region (b).The solid line represents the linear
allowed us to define a threshold which assured the selec-tion of at least one VOI as pseudo-reference region. However, we are aware that nowadays a better (sub-mil-limeter) spatial resolution and sensitivity can be achieved with the latest small-animal PET systems [26], therefore reducing the impact of noise and facilitating a voxel-wise approach.
In terms of regional classification, the time course and regional distribution of the SVCA3 weights representing brain regions with high specific uptake at different time points after LPS injection were in line with the time course and spatial distribution of neuroinflammation after LPS injection presented by previous findings [16] for both a 90- and 120-min scanning time interval. When reducing the acquisition time from 120 to 90 min, SVCA3 weights representing the fraction of brain regions with low specific uptake were not significantly different. Therefore, a SVCA3 approach using either a 90- or 120-min acquisition time interval can be used to determine which brain regions are involved in neuroin-flammation and to which extent brain regions are af-fected by neuroinflammation.
Based on the regional wlow tissue weights obtained with SVCA3, we used two different approaches to de-fine a pseudo-reference region. A first approach was presented for human PET imaging of neuroinflamma-tion with (R)-[11C]PK11195 [13] and generated a virtual pseudo-reference region by taking into account all brain regions and weighting each region with corre-sponding wlow tissue weight (SVCA3wlow). Next, we considered a SVCA approach similar to the one pre-sented for PET imaging of neuroinflammation in the human brain using [18F]DPA-714 [14]. For this ap-proach, we determined an animal-specific, composite pseudo-reference region by taking into account only those brain regions with corresponding regional wlow tissue weights greater than 0.95 (SVCA3low). As such, only brain regions with low specific uptake were in-cluded in a composite regional brain mask representing a pseudo-reference region. Visual assessment of the resulting pseudo-reference TACs of both approaches (see Figure 5) clearly showed that the SVCA3low ap-proach provided a much better approximation of the left striatal reference TAC, compared to the SVCA3wlow approach. Moreover, the SVCA3wlow approach clearly overestimated the left striatal reference TAC, indicating that scaling the TAC of each brain region with the cor-responding fraction of low specific binding does not completely eliminate the contribution of specific bind-ing from the regional PET signal.
Next, the pseudo-reference TACs generated by the two SVCA3 approaches were used as input function for SRTM to calculate the corresponding binding potential values for the right striatum (BPwlow and BPlow
respectively). These values were compared to the bind-ing potential values obtained with SRTM and the left striatum as reference region (BPL STR) since the contra-lateral brain region can be considered the most appro-priate pseudo-reference region from a physiological point of view. While BPwlow and BPlowdemonstrated a high and significant correlation with BPL STR (see Table 1), BPwlow underestimated BPL STR substantially while a composite pseudo-reference region including only brain regions with low specific tracer uptake sub-stantially reduced the underestimation of BPL STR to such extent that for a 120-min acquisition, no signifi-cant differences were observed between BPL STR and BPlow. These results confirmed previous findings which showed that combining all TACs with the appropriate SVCA3 weighting overestimated the pseudo-reference tissue uptake, thus causing an underestimation of BP values [15]. As such, brain regions with low specific tracer uptake are required to allow accurate quantifica-tion of neuroinflammaquantifica-tion in a rat brain using [18F]DPA-714 PET imaging. On the other hand, the re-gional SVCA3 weights of the different kinetic classes and more specifically of the class representing non-displaceable or low specific binding can facilitate a well-founded selection of candidate pseudo-reference regions across different animals without prior know-ledge about the spatial distribution of the induced neuroinflammation.
In terms of reducing the acquisition time, BP values de-termined by the two SVCA3 approaches were very similar for both a 90- and 120-min acquisition time interval, al-though a 90-min acquisition time resulted in a slightly dif-ferent selection of brain regions as pseudo-reference region (see Figure 4) compared to 120-min acquisition time. Therefore, a shorter 90-min acquisition time can be considered with only very limited impact on a SVCA3-based quantification. These results are in line with previ-ous findings that a 90-min dynamic acquisition still guar-anteed an accurate quantification [17].
brain regions. The good quantitative performance of the SVCA3low approach indicates that the regional SVCA3 weights representing the fraction of non-displaceable or low specific binding are comparable between animals and can be considered to some extent as a measure for the regional level of neuroinflammation or the fraction of un-affected tissue. Therefore, a SVCA3-based tissue classifica-tion can provide useful insights regarding the extent of neuroinflammation in the different brain regions and the bias that can be expected for a SVCA3-based pseudo-ref-erence tissue approach. Moreover, in rat models with a more widespread neuroinflammation across the brain, a SVCA3 approach could facilitate the selection of brain re-gions with low or stable levels of neuroinflammation as pseudo-reference regions to allow the longitudinal moni-toring of changes in levels of neuroinflammation in other brain regions of interest.
Conclusion
We presented an adapted, regional SVCA3 for automatic pseudo-reference tissue selection for [18F]DPA-714 PET imaging of neuroinflammation in the rat brain. This SVCA3 approach considered three kinetic classes to accur-ately identify brain regions with low specific [18F]DPA-714 binding. For the quantification of the increased binding in the right striatum at different time points after LPS injec-tion, a SVCA3-based pseudo-reference tissue model proved to be a valid alternative for the validated reference tissue model using the contralateral striatum as reference region. Therefore, this SVCA3 approach could facilitate ac-curate, longitudinal, and non-invasive PET quantification of neuroinflammation in the rat brain using [18F]DPA-714 PET. A shorter acquisition time interval of 90 min can be considered with only limited impact on the SVCA3-based selection of appropriate pseudo-reference brain regions.
Abbreviations
AD:Alzheimer’s disease; ALS: Amyotrophic lateral sclerosis; BP: Binding
potential; CBL: Cerebellum; HD: Huntington’s disease; HPLC:
High-performance liquid chromatography; IP: Intraperitoneal; L FC: Left frontal cortex; L HC: Left hippocampus; L HTL: Left hypothalamus; L SMC: Left sensor motor cortex; L STR: Left striatum; L TC: Left temporal cortex; L TL: Left thalamus; LPS: Lipopolysaccharide; MB: Midbrain; PBR: Peripheral
benzodiazepine receptor; PD: Parkinson’s disease; PET: Positron emission
tomography; R FC: Right frontal cortex; R HC: Right hippocampus; R HTL: Right hypothalamus; R SMC: Right sensor motor cortex; R STR: Right striatum; R TC: Right temporal cortex; R TL: Right thalamus; SRTM: Simplified reference tissue model; SVCA: Supervised clustering analysis;
SVCA3: Supervised clustering analysis using three kinetic classes; SVCA4: Supervised clustering analysis using four kinetic classes; TAC: Time activity curve; TSPO: Translocator protein; VOI: Volume of interest
Acknowledgements
The authors would like to thank he MoSAIC (Molecular Small Animal Imaging Centre) of the KU Leuven for the imaging support.
Funding
This work was supported by the Brazilian Science without Borders program (CNPq).
Availability of data and materials
Please contact the authors for data request.
Authors’contributions
IFV and MK jointly developed the concept of the manuscript, performed data analysis, and were highly involved in the writing of the manuscript. DO contributed extensively to the design of the study, tracer synthesis, and data acquisition and analysis of the microPET data. FRAL, CC, GB, and KVL contributed greatly to the design of the study and global revision of the manuscript, including reviewing the choice of references, tables, and figures and editing the initial and every subsequent draft. All authors read and approved the final manuscript.
Ethics approval and consent to participate
The research protocol was approved by the local Animal Ethics Committees (P223/2013) and was performed according to the European Ethics Committee guidelines (decree 86/609/EEC).
Consent for publication
Not applicable.
Competing interests
The authors declare that they have no competing interests.
Publisher’s Note
Springer Nature remains neutral with regard to jurisdictional claims in published maps and institutional affiliations.
Author details
1Department of Nuclear Energy, DEN-UFPE, Recife, Brazil.2Nuclear Medicine
and Molecular Imaging, Department of Imaging and Pathology, University Hospital and KU Leuven, Herestraat 49, B-3000 Leuven, Belgium.3Laboratory for Radiopharmacy, Department of Pharmaceutical and Pharmacological Sciences, KU Leuven, Leuven, Belgium.
Received: 16 August 2018 Accepted: 11 December 2018
References
1. Ory D, Celen S, Verbruggen A, Bormans G. PET radioligands for in vivo
visualization of neuroinflammation. Curr Pharm Des. 2014;20:5897–913.
2. Varley J, Brooks DJ, Edison P. Imaging neuroinflammation in Alzheimer’s
disease and other dementias: recent advances and future directions.
Alzheimers Dement. 2015;11:1110–20.https://doi.org/10.1016/j.jalz.2014.08.105.
3. Crotti A, Glass CK. The choreography of neuroinflammation in Huntington’s
disease. Trends Immunol. 2015;36:364–73.https://doi.org/10.1016/j.it.2015.04.007.
4. Chauveau F, Van Camp N, Dolle F, et al. Comparative evaluation of the
translocator protein radioligands DPA-713, 18F-DPA-714, and 11C-PK11195 in a rat model of acute neuroinflammation. J Nucl Med. 2009;50: 468–76.https://doi.org/10.2967/jnumed.108.058669.
5. Golla SSV, Boellaard R, Oikonen V, et al. Quantification of [18F]DPA-714
binding in the human brain: initial studies in healthy controls and
Alzheimer’s disease patients. J Cereb Blood Flow Metab. 2015;35:766–72.
https://doi.org/10.1038/jcbfm.2014.261.
6. Corcia P, Tauber C, Vercoullie J, et al. Molecular imaging of microglial
activation in amyotrophic lateral sclerosis. PLoS One. 2012;7:e52941.https://
doi.org/10.1371/journal.pone.0052941.
7. Ikoma Y, Edison P, Ramlackhansingh A, et al. Reference region automatic
extraction in dynamic [(11)C]PIB. J Cereb Blood Flow Metab. 2013;33:1725–31.
https://doi.org/10.1038/jcbfm.2013.133.
8. Rissanen E, Tuisku J, Luoto P, et al. Automated reference region extraction
and population-based input function for brain [(11)C]TMSX PET image
analyses. J Cereb Blood Flow Metab. 2015;35:157–65.https://doi.org/10.
1038/jcbfm.2014.194.
9. Jonasson M, Appel L, Danfors T, et al. Development of a clinically feasible
[11C]PE2I PET method for differential diagnosis of parkinsonism using reduced scan duration and automated reference region extraction. Am J
Nuc Med Mol Imag. 2017;7:263–74.
10. Banati RB, Newcombe J, Gunn RN, et al. The peripheral benzodiazepine
binding site in the brain in multiple sclerosis: quantitative in vivo imaging
11. Kumar A, Muzik O, Shandal V, et al. Evaluation of age-related changes in translocator protein (TSPO) in human brain using (11)C-[R]-PK11195 PET.
J Neuroinflammation. 2012;9:232.https://doi.org/10.1186/1742-2094-9-232.
12. Turkheimer FE, Edison P, Pavese N, et al. Reference and target region
modeling of [11C]-(R)-PK11195 brain studies. J Nuc Med. 2007;48:158–67.
13. Yaqub M, van Berckel BNM, Schuitemaker A, et al. Optimization of
supervised cluster analysis for extracting reference tissue input curves in
(R)-[(11)C]PK11195 brain PET studies. J Cereb Blood Flow Metab. 2012;32:1600–
8.https://doi.org/10.1038/jcbfm.2012.59.
14. García-Lorenzo D, Lavisse S, Leroy C, et al. Validation of an automatic
reference region extraction for the quantification of [18F]DPA-714 in
dynamic brain PET studies. J Cereb Blood Flow Metab. 2018;38:333–46.
https://doi.org/10.1177/0271678X17692599.
15. Sridharan S, Lepelletier F-X, Trigg W, et al. Comparative evaluation of three
TSPO PET radiotracers in a LPS-induced model of mild Neuroinflammation in
rats. Mol Imag Biol. 2017;19:77–89.https://doi.org/10.1007/s11307-016-0984-3.
16. Ory D, Planas A, Dresselaers T, et al. PET imaging of TSPO in a rat model of
local neuroinflammation induced by intracerebral injection of
lipopolysaccharide. Nucl Med Biol. 2015;42:753–61.https://doi.org/10.1016/j.
nucmedbio.2015.06.010.
17. Ory D, Postnov A, Koole M, et al. Quantification of TSPO overexpression in a
rat model of local neuroinflammation induced by intracerebral injection of LPS by the use of [(18)F]DPA-714 PET. Eur J Nucl Med Mol Imaging. 2015.
https://doi.org/10.1007/s00259-015-3172-9.
18. Damont A, Hinnen F, Kuhnast B, et al. Radiosynthesis of [ 18 F]DPA-714, a
selective radioligand for imaging the translocator protein (18 kDa) with PET.
J Label Compd Radiopharm. 2008;51:286–92.https://doi.org/10.1002/jlcr.1523.
19. Tai Y-C, Ruangma A, Rowland D, et al. Performance evaluation of the
microPET focus: a third-generation microPET scanner dedicated to animal
imaging. J Nuc Med. 2005;46:455–63.
20. Constantinescu CC, Mukherjee J. Performance evaluation of an Inveon PET
preclinical scanner. Phys Med Biol. 2009;54:2885–99.https://doi.org/10.1088/
0031-9155/54/9/020.
21. Casteels C, Vermaelen P, Nuyts J, et al. Construction and evaluation of
multitracer small-animal PET probabilistic atlases for voxel-based functional
mapping of the rat brain. J Nuc Med. 2006;47:1858–66.
22. James ML, Fulton RR, Vercoullie J, et al. DPA-714, a new translocator
protein-specific ligand: synthesis, radiofluorination, and pharmacologic
characterization. J Nucl Med. 2008;49:814–22.https://doi.org/10.2967/
jnumed.107.046151.
23. Peyronneau M-A, Saba W, Goutal S, et al. Metabolism and quantification of
[18F]DPA-714, a new TSPO positron emission tomography radioligand. Drug
Metab Dispos. 2013;41:122–31.https://doi.org/10.1124/dmd.112.046342.
24. Fookes CJR, Pham TQ, Mattner F, et al. Synthesis and biological evaluation
of substituted [ 18 F]Imidazo[1,2- a ]pyridines and [ 18 F]Pyrazolo[1,5- a ]pyrimidines for the study of the peripheral benzodiazepine receptor using
positron emission tomography. J Med Chem. 2008;51:3700–12.https://doi.
org/10.1021/jm7014556.
25. Verhaeghe J, Wyffels L, Wyckhuys T, et al. Rat brain normalization templates
for robust regional analysis of [11C]ABP688 positron emission tomography/
computed tomography. Mol Imaging. 2014;13:1–14.
26. Krishnamoorthy S, Blankemeyer E, Mollet P, et al. Performance evaluation of
the MOLECUBESβ-CUBE-a high spatial resolution and high sensitivity small
animal PET scanner utilizing monolithic LYSO scintillation detectors. Phys
![Fig. 2 Overview of the average tissue weighting coefficients whigh of the kinetic class representing high specific tracer uptake of [18F]DPA-714 ina rat brain at 1 day (1D, n = 3), 3 days (3D, n = 12), 7 days (7D, n = 4), and 30 days (30D, n = 3) after LPS](https://thumb-us.123doks.com/thumbv2/123dok_us/9620506.1944261/6.595.56.542.437.674/overview-average-tissue-weighting-coefficients-kinetic-representing-specific.webp)
![Fig. 4 The number of selections as pseudo-reference region orregion representing low specific binding (tissue weight wlow of thekinetic class representing the low specific binding greater than 0.95)considering 22 [18F]DPA-714 brain microPET scans at differ](https://thumb-us.123doks.com/thumbv2/123dok_us/9620506.1944261/7.595.58.541.508.694/selections-reference-orregion-representing-thekinetic-representing-considering-micropet.webp)