Feature Level Data Fusion of
Multiple Biometric Characteristics
Mark Abernethy
This thesis is presented for the degree of
Doctor of Philosophy
Declaration
I declare that this thesis is my own account of my research and contains as its main content work which has not previously been submitted for a degree at any tertiary education institution.
...
Abstract
This PhD research project developed and evaluated innovative approaches to computer system user authentication, using biometric characteristics. It involved experiments with a signicant number of participants and development of new approaches to biometric data representation and analysis.
The initial authentication procedure, that we all perform when we log onto a computer system, is considered to be the rst line of protection for computer systems. The password is the most common verication token used in initial authentication procedures. Unfortunately, passwords are subject to numerous attack vectors (loss, theft, guessing or cracking), and as a result unauthorised persons may gain access to the verication token and be incorrectly authenticated. This has led to password-based authentication procedures being responsible for a large proportion of computer network security breaches.
In recent years, the use of biometrics has been increasingly researched as an alternative to passwords in the initial authentication procedure. Biometrics concerns the physical traits and behavioural characteristics that make each individual unique. Biometric authentication involves the use of biometric technologies in authentication systems, with the aim to provide accurate verication (based on biometric characteristics).
Multi-modal biometrics requires consideration of various aspects of data integration, known to the eld of data fusion. Multi-modal biometric research has, until recently, focused on the fusion of data (from multi-ple sources) at the decision level or the condence score level. It has been proposed that fusion of data at the feature level will produce more accurate and reliable verication.
However, fusion of data at the feature level is a more dicult task than fusion at the other two levels. For decision level fusion, `accept' or `reject' results from the dierent data sources are fused. For condence score level fusion, condence scores (typically in the continuous interval[0,1])
from the dierent data sources are fused. That is, for the aforementioned levels, the data from the multiple sources are of the same nature. Feature level fusion combines feature vectors, where the data from the dierent sources are most likely to consist of dierent units of measurement.
Data fusion literature formally species that data may be combined ac-cording to three paradigms: competitive, complementary, and coopera-tive. Competitive data fusion assesses data from all available sources, and bases classication upon the `best' source. Complementary data fu-sion combines all available data from all sources, and bases classication upon this combined data. Cooperative data fusion involves the selection of the best features of each individual data source, and then combines the selected features prior to classication.
Whilst feature level data fusion was the primary objective, investigation of the two individual characteristics was conducted to enable comparison of results with the data fusion results. For the data fusion investigation, the complementary and cooperative paradigms were adopted, with the cooperative approach involving four stages.
The feature selection method chosen to lter keystroke dynamics data was based on normality statistics, and returned results comparable to many other research eorts. The ngerprint feature representation method developed for this experiment demonstrated an innovative and eective technique, which could be applicable in a uni-modal or a multi-modal context.
As the new ngerprint representation method resulted in a standard length feature vector for each ngerprint, data alignment and subsequent feature level data fusion was eciently and practicably facilitated.
The experiment recruited 90 participants to provide typing and nger-print samples. Of these, 140 keystroke dynamics samples and 140 n-gerprint samples (from each participant) were utilised for the rst two phases of the experiment. Phase three of the experiment involved the fusion of the samples from the rst two phases, and thus there were 140 combined samples. These quantities provided 100 samples for false negative testing and 10,500 samples for false positive testing (for each participant for each phase of the experiment). These gures are similar or better than virtually all previous research studies in this eld.
The results of the three phases of the experiment were calculated as the two performance variables, the false rejection rate (FRR)measuring the false negativesand the false acceptance rate (FAR)measuring the false positives.
The ngerprint recognition investigation returned an average FAR of 0.0 and an average FRR of 0.0022, which were as good as (or better than) other research in the eld.
The feature level data fusion adopting the complementary approach re-turned an average FAR of 0.0 and an average FRR of 0.0004. Feature level data fusion adopting the cooperative approach returned respective average FAR and FRR results of 0.00000381 and 0.0004 for stage 1, 0.0 and 0.0006 for stage 2, 0.0 and 0.001 for stage 3, and 0.0 and 0.001 for stage 4.
The research demonstrated that uni-modal biometric authentication sys-tems provide an accurate alternative to traditional password-based au-thentication methods. Additionally, the keystroke dynamics investiga-tion demonstrated that ltering `noisy' data from raw data improved ac-curacy for this biometric characteristic (though other ltering methods than that used in this research may improve accuracy further). Also, the newly developed ngerprint representation method demonstrated excel-lent results, and indicated that its use for future research (in represent-ing two dimensional data for classication by Articial Neural Networks) could be advantageous.
Contents
1 Introduction 1
1.1 Context Of The Study . . . 1
1.2 Motivation And Objectives For This Research . . . 6
1.2.1 Motivation For The Study . . . 6
1.2.2 Objectives of the Study . . . 10
1.2.3 Research Questions . . . 11
1.3 Signicance Of The Research . . . 12
1.4 Scope Of The Research . . . 14
1.5 Experimental Method And The Rationale For Its Selection . . . 16
1.6 Outline Of This Dissertation . . . 17
1.7 Conclusion . . . 18
2 Background 19 2.1 Introduction . . . 19
2.2 Biometrics . . . 20
2.2.1 Overview of Biometrics . . . 20
2.2.2 Biometric Authentication Systems . . . 22
2.2.3 Biometric Performance Variables and System Errors . . . 27
2.2.4 Biometric Characteristics . . . 30
2.2.4.1 Deoxyribonucleic Acid (DNA) . . . 32
2.2.4.2 Facial Recognition . . . 33
2.2.4.3 Iris Pattern Recognition . . . 34
2.2.4.4 Retinal Pattern Recognition . . . 35
2.2.4.5 Speaker Recognition . . . 36
2.2.4.6 Fingerprint Recognition . . . 37
2.2.4.7 Palmprint Recognition . . . 37
2.2.4.8 Hand Geometry . . . 38
2.2.4.9 Keystoke Dynamics . . . 39
2.2.4.10 Signature Recognition . . . 39
2.2.4.11 Gait Recognition . . . 40
2.2.4.12 Body Odor Recognition . . . 40
2.2.4.13 More Detailed Discussion . . . 41
2.3 Data Fusion And Multi-Modal Biometrics . . . 41
2.3.1 Data Fusion . . . 41
2.3.1.1 Paradigms of Data Fusion . . . 44
2.3.1.2 Formal Levels of Fusion . . . 48
2.3.1.3 Data Alignment . . . 49
2.3.2 Multi-Modal Biometrics . . . 50
2.3.2.1 Levels of Fusion In Multi-Modal Biometrics . . . 52
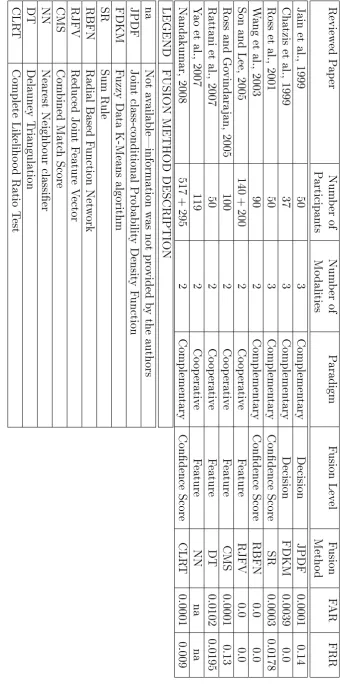
2.3.2.2 Review of Multi-Modal Biometrics Research . . . 61
2.4 Pattern Recognition And Articial Neural Networks . . . 78
2.4.1 Pattern Recognition . . . 79
2.4.1.1 Classication Schemes . . . 81
2.4.2 Articial Neural Networks . . . 84
2.4.2.1 Imitating The Biological Model . . . 85
2.4.2.2 ANN Architectures . . . 94
2.4.3 The Multi-Layer Perceptron As A Pattern Classier . . . 113
2.5 Conclusion . . . 116
3 Keystroke Dynamics 119 3.1 Introduction . . . 119
3.2 Overview of Keystroke Dynamics . . . 119
3.3 Metrics . . . 121
3.4.1 Static Verication . . . 125
3.4.2 Dynamic Verication . . . 146
3.5 Summary of Keystroke Dynamics . . . 150
3.6 Conclusion . . . 154
4 Fingerprint Recognition 155 4.1 Introduction . . . 155
4.2 Overview of Fingerprint Recognition . . . 156
4.2.1 The Uniqueness of Fingerprint . . . 160
4.3 Fingerprint Features . . . 162
4.3.1 Global Features . . . 162
4.3.2 Local Features . . . 164
4.4 Automated Fingerprint Identication Systems . . . 167
4.4.1 Fingerprint Acquisition . . . 169
4.4.1.1 O-Line Fingerprint Acquisition . . . 169
4.4.1.2 Latent Fingerprints . . . 170
4.4.1.3 Live-Scan Fingerprint Acquisition . . . 173
4.4.2 Fingerprint Representation . . . 175
4.4.3 Pre-processing . . . 177
4.4.4 Feature Extraction . . . 179
4.4.5 Fingerprint Classication . . . 183
4.4.5.1 Feature Extraction For Classication . . . 187
4.4.5.2 Classication Techniques . . . 188
4.4.6 Fingerprint Verication . . . 190
4.4.6.1 Feature Extraction For Verication . . . 192
4.4.6.2 Verication Techniques . . . 192
4.5 Minutiae-based Matching Related Research . . . 196
4.6 Summary Of Minutiae-Based Matching Techniques . . . 218
4.6.1 Approach Adopted By The Reviewed Research Eorts . . . . 219
4.6.2 Approach Adopted In The Current Experiment . . . 222
4.7 Conclusion . . . 224
5 Experimental Methods 225 5.1 Introduction . . . 225
5.2 Experimental Overview . . . 226
5.3 Participants . . . 227
5.4 Keystroke Dynamics . . . 229
5.4.1 Software . . . 229
5.4.2 Data Collection . . . 232
5.4.3 Metrics . . . 234
5.4.4 Pre-processing . . . 235
5.4.4.1 Keystroke Dynamics Feature Selection . . . 239
5.4.5 Final Analysis Procedure . . . 247
5.4.5.1 Training Phase . . . 248
5.4.5.2 Testing Phase . . . 251
5.5 Fingerprint Recognition . . . 252
5.5.1 Software . . . 252
5.5.2 Data Collection . . . 255
5.5.3 Fingerprint Feature Extraction . . . 257
5.5.4 Local Feature Registration . . . 258
5.5.4.1 Model Feature Set . . . 261
5.5.4.2 Scene Feature Set Alignment . . . 262
5.5.5 Feature Selection . . . 277
5.5.6 Final Analysis Procedure . . . 283
5.5.6.1 Training Phase . . . 283
5.5.6.2 Testing Phase . . . 285
5.6 Feature Level Data Fusion . . . 286
5.6.1 Introduction . . . 286
5.6.2 Complementary Data Fusion Approach . . . 287
5.6.2.1 Complementary Fusion of Feature Data . . . 288
5.6.3 Cooperative Data Fusion Approach . . . 291
5.6.3.1 Selection of Feature Metrics . . . 295
5.6.3.2 Cooperative Fusion of Feature Data . . . 305
5.6.3.3 Final Analysis Procedure . . . 307
5.7 Experimental Validity . . . 309
5.7.1 Internal Validity . . . 310
5.7.2 External Validity . . . 313
5.8 Conclusion . . . 314
6 Research Results And Analysis Method 317 6.1 Overview . . . 317
6.2 Classication of Authentication Outcomes . . . 317
6.2.1 Classication Measurement . . . 317
6.2.2 Receiver Operating Characteristics (ROC) Graphs . . . 323
6.2.2.1 ROC space . . . 323
6.2.2.2 Area Under The ROC Curve . . . 328
6.2.2.3 Optimal Operating Point . . . 330
6.3 Applying ROC In This Study . . . 333
6.3.1 Introduction . . . 333
6.3.2 Calculation of ROC Operating Points . . . 335
6.3.3 Calculation of The Area Under The ROC Curve . . . 337
6.3.4 Calculation of Decision Threshold . . . 338
6.4 Results . . . 343
6.4.1 Keystroke Dynamics (Phase 1) . . . 345
6.4.2 Fingerprint Recognition (Phase 2) . . . 351
6.4.3 Data Fusion (Phase 3) . . . 353
6.4.3.1 Complementary Data Fusion . . . 353
6.4.3.2 Cooperative Data Fusion . . . 355
7 Discussion Of Results 367
7.1 Introduction . . . 367
7.2 Discussion . . . 367
7.2.1 Discussion Of Keystroke Dynamics Results . . . 369
7.2.1.1 Summary of Keystroke Dynamics Results . . . 387
7.2.2 Discussion Of Fingerprint Recognition Results . . . 389
7.2.2.1 Summary of Fingerprint Recognition Results . . . . 401
7.2.3 Discussion Of Data Fusion Results . . . 404
7.2.3.1 Complementary Data Fusion . . . 404
7.2.3.2 Summary of Complementary Data Fusion Results . . 413
7.2.3.3 Cooperative Data Fusion . . . 414
7.2.3.4 Summary of Cooperative Data Fusion Results . . . . 432
7.3 Conclusion . . . 434
8 Conclusion 437 8.1 Research Purpose and Objectives . . . 437
8.2 Main Contribution of the Research . . . 441
8.3 Limitations of the Research . . . 444
8.4 Implications and Practical Application of the Research . . . 448
8.5 Future Research Directions . . . 451
8.6 Final Remarks . . . 453
Appendix A 455 A.1 Reported Security Breaches And Vulnerabilities . . . 456
Appendix B 461 B.1 Keystroke Dynamics Metrics Selection Worked Example . . . 461
Appendix C 467 C.1 Keystroke Dynamics Phase Software . . . 467
C.1.1 Pre-processing . . . 468
C.1.2 Experimental Procedure . . . 469
C.2.1 Pre-processing . . . 473
C.2.2 Experimental Procedure . . . 474
C.3 Data Fusion Phase Software . . . 476
C.3.1 Complementary Data Fusion Software . . . 477
C.3.2 Cooperative Data Fusion Software . . . 479
List of Tables
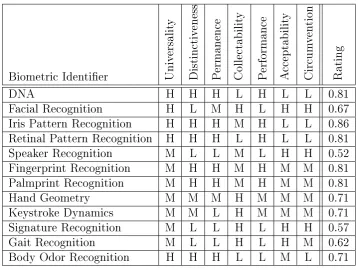
2.1 Summary of Biometric Characteristics for Authentication Systems . . 30
2.2 Summary of Reviewed Literature Involving Multi-Modal Biometics . 62 3.1 Metric Calculation for a Two-Key Combination . . . 124
3.2 Summary of Reviewed Literature Involving Static Verication . . . . 126
3.3 Summary of Reviewed Literature Involving Dynamic Verication . . . 147
4.1 FBI Latent Fingerprint Collection Procedures . . . 171
4.2 Correlation of Early Fingerprint Classes . . . 184
4.3 Proportion of Fingerprint Classes . . . 186
4.4 Fingerprint Classes and Their Singular Points . . . 189
4.5 Summary of Reviewed Literature Involving Minutiae-Based Matching 198 4.6 Performance Metrics Experiment by He et al., 2003 . . . 209
4.7 Performance Metrics Experiment by Tong et al., 2005 . . . 211
5.1 Priority Ratings . . . 241
5.2 Indices Of Selected Metrics For Participant One . . . 244
5.3 Indices Of Selected Metrics For Participant Three . . . 244
5.4 Example of Global and Selected Metrics for a Participants Input File 246 5.5 Example Registration Tables . . . 261
5.6 Local Area Alignment Coordinates . . . 265
5.7 Boundary Limits For Candidate Transformation Factors . . . 272
5.8 Global Adjustment Ranges . . . 274
5.9 Example Output From `.tab' File . . . 281
5.10 Participants with Unmatched Features After Selection . . . 282
5.11 Approximate Relative Local Gain for Keystroke Dynamics . . . 300
5.12 Average Local Gain Proportions . . . 301
5.13 Number of Metrics Per Percentage . . . 303
6.1 AUC Statistic Decriptions . . . 328
6.3 Comparison Between AUC and TPMean for Keystroke Dynamics . . 340
6.4 Condence Levels . . . 341
6.5 Keystroke Dynamics Statistics for Threshold Calculation . . . 345
6.6 Keystroke Dynamics Results . . . 346
6.7 Fingerprint Recognition Statistics for Threshold Calculation . . . 351
6.8 Fingerprint Recognition Results . . . 352
6.9 Complementary Data Fusion Statistics for Threshold Calculation . . 353
6.10 Complementary Data Fusion Results . . . 354
6.11 Cooperative Data Fusion (40%) Statistics for Threshold Calculation . 355 6.12 Cooperative Data Fusion (40%) Results . . . 356
6.13 Cooperative Data Fusion (50%) Statistics for Threshold Calculation . 357 6.14 Cooperative Data Fusion (50%) Results . . . 358
6.15 Cooperative Data Fusion (60%) Statistics for Threshold Calculation . 359 6.16 Cooperative Data Fusion (60%) Results . . . 360
6.17 Cooperative Data Fusion (70%) Statistics for Threshold Calculation . 361 6.18 Cooperative Data Fusion (70%) Results . . . 362
6.19 Summary Statistics of Experimental Results . . . 364
7.1 Corresponding Table Numbers . . . 368
7.2 Duplication of Keystroke Dynamics Statistics . . . 370
7.3 Duplication of Keystroke Dynamics Results . . . 371
7.4 Summary of Reviewed Papers Using Statistical Analysis Methods . . 375
7.5 Summary of Reviewed Papers Using Machine Learning Techniques . . 378
7.6 Summary of Reviewed Papers Using Articial Neural Networks . . . . 382
7.7 Duplication of Fingerprint Recognition Statistics . . . 390
7.8 Duplication of Fingerprint Recognition Results . . . 391
7.10 Duplication of Complementary Data Fusion Statistics . . . 405
7.11 Duplication of Complementary Data Fusion Results . . . 407
7.12 Summary of Reviewed Papers Using Complementary Data Fusion . . 408
7.13 Duplication of Cooperative Data Fusion (Stage 1 40%) Statistics . . 416
7.14 Duplication of Cooperative Data Fusion (Stage 1 40%) Results . . . 417
7.15 Duplication of Cooperative Data Fusion (Stage 2 50%) Statistics . . 419
7.16 Duplication of Cooperative Data Fusion (Stage 2 50%) Results . . . 420
7.17 Duplication of Cooperative Data Fusion (Stage 3 60%) Statistics . . 422
7.18 Duplication of Cooperative Data Fusion (Stage 3 60%) Results . . . 424
7.19 Duplication of Cooperative Data Fusion (Stage 4 70%) Statistics . . 425
7.20 Duplication of Cooperative Data Fusion (Stage 4 70%) Results . . . 427
7.21 Summary of Reviewed Papers Using Cooperative Data Fusion . . . . 429
A.1 Reported Security Breaches (1988-2003) . . . 456
A.2 Reported Vulnerabilities (1995-2008) . . . 457
A.3 Number of Internet Users (December 1995-June 2002) . . . 458
B.1 Coecient Values For Each Metric . . . 462
B.2 Sorted Coecient Values And Associated Metric Numbers . . . 463
B.3 Sorted Metrics With Rank Allocations . . . 464
B.4 Accumulated Rank Score For Metrics . . . 465
C.1 Keystroke Dynamics Directory Structure . . . 468
C.2 Fingerprint Recognition Directory Structure . . . 473
C.3 Complementary Data Fusion Directory Structure . . . 477
List of Figures
2.1 The Generic Biometric Authentication System . . . 24
2.2 Complementary Data Fusion Paradigm . . . 45
2.3 Competitive Data Fusion Paradigm . . . 46
2.4 Cooperative Data Fusion Paradigm . . . 47
2.5 Data Fusion Levels In Multi-Modal Biometrics . . . 53
2.6 Feature Level Data Fusion . . . 56
2.7 Condence Score Level Data Fusion . . . 58
2.8 Decision Level Data Fusion . . . 60
2.9 Components of a Biological Neuron . . . 85
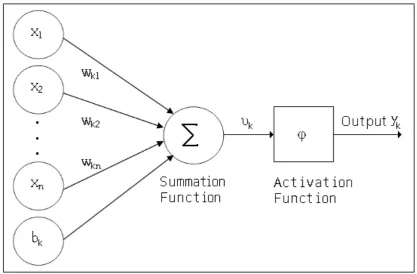
2.10 Simple Non-linear Model of a Neuron . . . 88
2.11 Illustrations of Step-wise, Piece-wise, And Sigmoid Functions . . . 89
2.12 The Single Layer Perceptron . . . 96
2.13 The Multi-Layer Perceptron . . . 98
2.14 The Hopeld Neural Network . . . 103
2.15 The Self-Organising Map (SOM) . . . 106
2.16 Adaptive Resonance Theory (ART) . . . 109
3.1 States of a Two-Key Combination . . . 123
3.2 Keystroke Durations and Digraph Latencies for the digraph th . . . 123
4.1 Fingerprint Impression Illustrating Ridges And Furrows . . . 156
4.2 Fingerprint Impression Illustrating Core And Delta Points . . . 163
4.3 Local Fingerprint Features Types . . . 165
4.4 Local Features Illustrating Minutiae Positions . . . 166
4.5 Captured Fingerprint And Its Orientation Field . . . 179 4.6 Captured Fingerprint, Binary, and Thinned Representations . . . 181 4.7 Fingerprint Classes dened by Henry . . . 184
5.1 Graphical User Interface for Keystroke Dynamics Capture Program . 230 5.2 Creation of Training and Testing Files For ANN Processing . . . 249 5.3 Graphical User Interface for Fingerprint Feature Capture Program . . 253 5.4 Alignment Example . . . 260 5.5 Local Area Alignment Example . . . 264 5.6 Filter Model . . . 296 5.7 Wrapper Model . . . 297
6.1 Contingency Table . . . 319 6.2 ROC Space . . . 324 6.3 Binary Classiers . . . 325 6.4 ROC Curve . . . 327 6.5 Comparison of AUC for Two Classiers . . . 330 6.6 ROC Curve for Participant 1 . . . 337 6.7 Example Demonstrating Best Classication . . . 347 6.8 Example Demonstrating Average Classication . . . 347 6.9 Example Demonstrating Worst Classication . . . 348 6.10 Keystroke Dynamics . . . 350
A.1 Reported Security Breaches (1988-2003) . . . 456 A.2 Reported Vulnerabilities (1995-2008) . . . 457 A.3 Number of Internet Users (December 1995-June 2002) . . . 459
Acknowledgments
I would like to express my sincere gratitude to my primary supervisor, Dr Andrew Turk, whose analytical skills proved most valuable and insightful during the course of this project. Dr Turk has been inspirational in encouraging me to strive for the highest standards, whilst undertaking rigorous and honest research. He has also been very helpful in regard to maintaining self-discipline (in relation to one's research work ethic), and a congenial and cooperative attitude with one's colleagues.
This research involved many technical aspects, and thanks are extended to my secondary supervisor Mr Shri M. Rai for his assistance with these matters. Shri Rai supervised my honours research and was therefore familiar with previous work in the area of keystroke dynamics. However, his prociency in mathematics and science became truly valuable when working with ngerprint data and data fusion issues.
My thanks to friend and colleague, Dr Christian Payne. Christian rst kindled my interest in computer security, and this area of research re-mains as interesting and challenging today as ever.
Thanks to Dr Lance Fung for suggesting the inclusion of ngerprint recognition for this project. His suggestion was inspirational and opened up new areas of investigation. Dr Fung also arranged for the purchase of the ngerprint scanner and the software development kit that were used for the experiment.
To my dear friend Dr R. (Chandra) Chandrashekhar of SwanLotus, thank you for your assistance with interpreting the point pattern match-ing algorithm used in the experiment to align ngerprint features. Your contribution was invaluable, and your friendship is priceless.
To my family and friends, thank you for the support that only loved ones can give.
Chapter 1
Introduction
1.1 Context Of The Study
The subject matter of this dissertation concerns the eld of computer security. There are many denitions for computer security suggested in the literature; some are essentially theoretical, whilst others are more practical. Eectively, a computer system should be available to work correctly and reliably under all circumstances, and thus be resistant to abuse of any description. In practice, this may be impossible to achieve. Therefore, the goal should be to make a computer system as secure as it can practicably be made.
To achieve this goal, conscious decisions need to be made about what data and/or resources are to be protected and from whom (Schneier, 2000). Some questions to be posed are: What preventative measures can be taken? Will the security system concentrate on prevention only, or will detection and recovery also be considered? That is, if preventative measures fail, can the intrusion be detected and what will be done to stop the attack and recover from it?
The answers to these questions (and others) need to be dened when planning the security policy. The policy should be tailored to the specic security requirements of the system under consideration. Once determined, the security policy can be implemented using appropriate mechanisms.
Bruce Schneier (2000) has stated that computer security is a process, not a product. That is, security can not be purchased in a box. Commercially available
security systems may not suit a specied security policy, and trying to adapt one could be seriously detrimental to both product and policy. Also, it should always be assumed that there will be someone who will attempt to circumvent any security mechanism, so a security system (policies and mechanisms) must undergo continual revision to try to stay ahead of would be attackers. Therefore, it is important to develop processes that allow for this evolution.
Adopting an evolutionary approach is unlikely to solve all computer security problems, but should reduce the incidents of security breaches. Failure to do so will lead to inadequate security, which will undoubtedly leave a computer system vulnerable to attack.
Historically, there are three basic aspects upon which a computer security system rests (Bishop, 2003; Garnkel et al., 2003):
1. Condentiality: ensuring that data can only be viewed, wholly or in part, by those authorised to do so. Condentiality therefore relates to the concealment of sensitive data, and concerns the ability to read or copy data.
2. Integrity: ensuring that data or resources cannot be modied by unauthorised persons. Those who are permitted to modify data or resources must only be able to do so according to their level of authorisation. Integrity therefore relates to the trustworthiness of data or resources, and involves ensuring the prevention of improper or unauthorised modication; it concerns the ability to write or delete data.
3. Availability: ensuring that a non-authorised user cannot prevent authorised users from access to the information or resources they require. This alludes to the maintenance of data or resources; protecting them from degradation.
In addition to the above points, Garnkel et al. (2003) recommend the following three aspects for practical implementation:
means ensuring that the system performs correctly and reliably day after day. It is therefore correlative to the integrity and availability of data and resources.
2. Access control: ensuring that authorised persons are able to do what they are authorised to do, and that everyone else is not (Schneier, 2000). Access control enforces data condentiality, integrity, and availability according to user authorisation levels, by restricting access to all data and resources to those authorised to access them. Mechanisms for implementing access control include access control lists, cryptography, and authentication.
3. Non-repudiation: preventing denial of abuse of the system. This involves providing undeniable proof that a user (legitimate or not) has performed an action they are not authorised to perform, and emphasizes the importance of logging and auditing.
Computer security has become a serious concern for companies, corporations, governments, academia, and private users. Though there may be numerous reasons for this concern, among them are the following:
• The seemingly limitless variety of tasks for which computer systems are being
used, which inevitably open up more avenues of attack.
• The exponential rate of increase in the incidents of reported breaches to
com-puter systems (CERT/CC, 2004). This is demonstrated by CERT/CC1 survey
gures for the number of reported breaches from 1988 to 2003 (refer Appendix A, Table A.1 and Figure A.1). It is reasonable to suspect that the number of security breaches is far greater than those reported, because companies and corporations are often reluctant to publicly acknowledge that they have security problems (CERT/CC, 2004).
• The number of reported vulnerabilities by which computer systems have been
compromised (CERT/CC, 2004). This is demonstrated by CERT/CC survey gures for the number of reported vulnerabilities from 1995 to 2008 (refer
1CERT/CC is an acronym for Computer Emergency Response Team/Coordination Center. It
Appendix A, Table A.2 and Figure A.2). Again, it is reasonable to suspect that there are an unknown number of vulnerabilities yet to be discovered and possibly exploited.
• Total company and corporate losses resulting from e-crime were estimated at
$666 million for 2003 (CSO, 2004). In a recent survey, average losses due to security breaches was $234,244 per respondent (CSI, 2009)2.
In the majority of cases, these problems result when computer systems are net-worked. A computer network is a collection of separate but interconnected comput-ers, where interconnection means that computers share an agreed upon method of communication and information exchange (Tanenbaum, 1996). A standalone com-puter system is a single, separate comcom-puter that is not connected to other comcom-puters, and can only be accessed if one is in physical proximity to it. Networked computers, however, can be accessed remotely and an attacker can remain relatively anonymous. Computer networks are complex systems which have several properties that im-pact on security (Schneier, 2000):
• They are complicated, with possibly thousands of components doing dierent
tasks; any one of which could malfunction or be subverted.
• They are interactive; individual components work together with any
combina-tion of other components.
• They evolve. That is, they do things that they were not originally designed to
do.
• They have bugs. That is, they misbehave in possibly unexplainable ways.
• They accept user input from a large number of people, sometimes all at the
same time. This property coupled with the above properties introduces the seemingly endless possibility of vulnerability.
Given these properties and the ability for remote access, securing a computer network is extremely dicult (if at all possible). It is reasonable to conclude that
the larger and more complex the network is, the more vulnerable it will be to attack and the more intractable the task of securing it becomes.
The network that most of us are aware of is the Internet. The Internet is a worldwide collection of interconnected networks that cooperate with each other using an agreed upon protocol suite (Tanenbaum, 1996).
The popularity of the Internet has dramatically increased since its inception, particularly since the introduction of the World Wide Web in 1993. An NUA3
survey reported that the number of Internet users in 2002 was 580,780,000 (Nua, 2002). Table A.3 and Figure A.3 (in Appendix A) present NUA survey gures from 1995 to 20024 to demonstrate the ever increasing number of Internet users.
As the Internet is a network of computer networks, it suers from all the prob-lems of any network. In fact, because the Internet is so large and complex, any individual network connected to the Internet is more at risk because there are so many users and points of access. CERT/CC (2004) stated that given the widespread use of automated attack tools, attacks against Internet-connected systems have be-come so commonplace that counts of the number of incidents reported provide little information with regard to assessing the scope and impact of attacks5.
It is therefore imperative that security policies and mechanisms continue to de-velop and evolve. Schneier (2000) believes that authentication across computer networks is the most important security problem to be solved. Inadequate user au-thentication is one of the major causes of security breaches, and is thus responsible for many intrusions to computer systems. Authentication is the major focus of the current study.
The next section 1.2 considers the motivation and objectives for the current study by discussing authentication and the weaknesses of existent traditional methods.
3NUA Internet Surveys is an organization that conducts surveys of Internet usage.
4NUA no longer conduct surveys on the number of Internet users; the numbers are now so large
that it seems the surveys provide little signicant information.
5As of 2004, CERT/CC no longer publish the number of reported computer system breaches.
1.2 Motivation And Objectives For This Research
1.2.1 Motivation For The Study
Authentication is required when it is necessary to know if a person is who they claim to be. It is a procedure that involves a person making a claim about their identity, and then providing evidence to prove it.
This study focuses on the initial authentication procedure that most computer users are accustomed to performing when they log onto a computer system. The initial authentication procedure is considered to be the rst line of protection for computer systems (Garnkel et al., 2003). It therefore stands to reason that this procedure should be made as accurate and reliable as feasibly possible.
Authentication is an access control mechanism that is based on user identity. It comprises two processes (Garnkel et al., 2003):
1. Identication: the naming or labeling of an identity, providing the means to distinguish that identity from among a set of similar identities. For example on a computer system, legitimate users are given a unique username by which the system dierentiates them from other legitimate users of the system.
2. Verication: the process of conrming the veracity of a claimed identity. For example on a computer system, a unique verication token (with direct corre-spondence to each username) is intended to verify the identity of a legitimate user. The verication process entails comparison of a stored or registered to-ken, for a legitimate user, with a query token provided by the claimant during the authentication procedure.
Only when identity is established and conrmedvia the verication processis authentication granted.
For the initial authentication procedure to be trusted, it must achieve both of the following goals (Schneier, 2000):
1. It must grant all authorised identities access to the system.
Traditional methods for the initial authentication procedure are based on (Umphress and Williams, 1985):
• What a user knows (i.e. knowledge of a verication token such as a password).
• What a user has (i.e. possession of a verication token such as a key or an ID
card).
The password is by far the most common verication token used in initial au-thentication procedures (Joyce and Gupta, 1990; Garnkel et al., 2003; Zhang et al., 2009), with many organisations widely adopting (and being heavily dependent upon) this method. This is because a password-based authentication procedure is cost ef-fective to implement, making use of the existing infrastructure of the computer system. Also, the verication process involved is a simple comparison between char-acter strings (more precisely, the hashed values of the passwords).
Unfortunately, passwords suer from the following major weaknesses:
1. Users typically choose passwords that are low in entropy (i.e. randomness), because they are easier to remember; high entropy passwords are dicult for users to remember (Schneier, 2000). Passwords that are low in entropy become more predictable, and thus more guessable. Also, if there are an insucient number of characters (of low entropy), the password may be easily cracked by brute force processing. Attackers using powerful computers and sophisticated cracking methods, might conduct oine attacks on stolen password les and crack weak passwords very quickly.
2. Even when users choose passwords that are higher in entropy, it is common for them to be written on paper and left in the vicinity of their computer desk. Though this makes it more convenient for users to remember high entropy passwords, it makes them vulnerable to loss or theft.
In the CSI Computer Crime and Security Survey (2009), password related vulner-abilities rated 6th, of 7 major types of attack experienced by respondents,
account-ing for 17.3%. Other types of attacks were malware infections (64.3%), laptop theft (42.2%), and insider abuse (29.7%) (CSI, 2009). Though not the largest percent-age, password related vulnerabilities remain a signicant cause of security system breaches.
Other verication tokens such as keys and ID cards can also be easily lost or stolen. Therefore, the token-based authentication procedure continues to be one of the most widely exploited methods of compromising computer systems (Garnkel et al., 2003). Once an attacker gains access to a computer system using a lost, stolen or cracked token, they will inevitably attempt to elevate their authorisation level. If successful, the condentiality and integrity of data on the system is open to compromise.
As demonstrated in the CSI Computer Crime and Security Survey (2009), cir-cumventing the initial authentication procedure is not the only way for an attacker to gain unauthorised access to a computer system. However, use of other methods to gain unauthorised access to computer systems is outside the scope of this discussion (refer section 1.4).
The limitations of the traditional initial authentication procedure mean that unauthorised persons may gain access to the verication token and be incorrectly authenticated. Therefore, there is no guarantee that knowledge or possession of the verication token truly conrms identity (Monrose and Rubin, 2000). So contrary to popular belief, initial authentication procedures do not actually verify identity; they only verify the holder of the token, who may or may not be the legitimate identity (Schneier, 2000).
To remedy the deciencies associated with the traditional initial authentication procedure, a method that is being increasingly researched is based on `what the user is' (Umphress and Williams, 1985). This method is referred to as biometrics, and may prove eective in improving upon the traditional authentication methods.
Biometrics are the physical traits and behavioural characteristics that are unique to each individual. Familiar examples of biometric characteristics are a person's signature, ngerprints, and DNA. Less familiar examples are retinal/iris patterns, voice/speech patterns, facial image patterns, hand geometry, and keystroke dynam-ics. A detailed discussion of biometrics is presented in Chapter 2 section 2.2.
Human beings use biometrics for person recognition every day. When we meet someone we know, we automatically assess features about the person. Firstly, we identify them according to our recollection of certain features, then we verify by closer scrutiny of those features. When we meet someone we have not met before, we memorise features about the person, so that when we next meet them we have information with which to make the comparison.
A computer based system using biometrics can only simulate, or model, human capabilities for person recognition, and may not attain the same accuracy as a human being does. The reason for this is that human beings have learned brain and memory functions, and can easily integrate information from multiple senses. Computers are limited in these capabilities.
In computer terms, the integration of information from multiple sources belongs to the eld of study known as data fusion. There are three paradigms and three major level of fusion available for the integration of data from multiple sources. The issues surrounding data fusion, including the paradigms and fusion levels, are discussed in detail in Chapter 2 section 2.3.
The intention of this study is to fuse multi-modal biometric data at the feature level. It has been proposed in the literature that feature level data is richer in meaningful information, and should provide a more accurate and robust verication process. However, there are certain operational issues associated with this level of fusion that require careful consideration and further research.
This study attempts to oer some solutions to some of these operational issues, in order to improve the accuracy and robustness of both uni-modal and mutli-modal biometric authentication. It must be stated though, that there may be other viable methods for dealing with these issues.
1.2.2 Objectives of the Study
As traditional authentication methods are responsible for a signicant proportion of computer security breaches, this study attempts to improve the initial authentication procedure by utilising biometrics in the verication process.
Three research objectives were identied:
1. To investigate the eective use of the biometric characteristic keystroke dy-namics (refer Chapter 3 and Chapter 5 section 5.4), and to assess the results in comparison to previous research in this eld. To achieve this objective, raw data are pre-processed to reduce the high degree of variability associated with this biometric characteristic.
3. To investigate the feature level fusion of data from the previously stated two sources (refer Chapter 2 section 2.3 and Chapter 5 section 5.6), and to assess the results in comparison to previous research in this eld. To achieve this objective, data alignment of the two data sets was necessary, as they have dif-ferent units of measurement. A simple data alignment method was applied to the ngerprint data, to bring them into alignment with the keystroke dynamics data.
These three objectives became the three phases of the experiment, as discussed in section 1.5.
1.2.3 Research Questions
The research objectives outlined in section 1.2.2 give rise to the following research questions:
1. Can the biometric characteristic keystroke dynamics (using feature selection to remove noisy data) demonstrate enough accuracyin comparison to previous research in this eldto be considered an eective verication token in a uni-modal biometric authentication system?
2. Can the biometric characteristic ngerprint recognition (using a new feature representation method to provide standard length feature vectors) demonstrate enough accuracyin comparison to previous research in this eldto be con-sidered an eective verication token in a uni-modal biometric authentication system?
3. Can feature level data fusion (using the feature vectors gained from points 1 and 2) demonstrate enough accuracyin comparison to previous research in this eldto be considered a better alternative in a multi-modal biometric authentication system compared to such a system where decision or condence score level fusion is utilised.
1.3 Signicance Of The Research
This study is one of many into biometrics for authentication. The many biometric characteristics achieve varying degrees of accuracy because of variations in instru-ment accuracy, raw data format, data pre-processing, software accuracy, and the uniqueness (between dierent people) of the biometric characteristic under consid-eration. Though some standards for data collection methods and verication pro-cesses have been introduced in recent years6, these eorts are taking some time to
lter into the biometric community (research and commercial).
As discussed in Chapter 2 section 2.2, biometric verication systems rarely indi-cate that two samples, taken from the same person at dierent times, are a perfect match. Instead the system only indicates the probability that two samples are from the same person; that is, there is seldom absolute certainty. When making the nal verication decision, it is crucial that the biometric verication system attains the most accurate probability score possible. This is particularly true when multiple characteristics are being used.
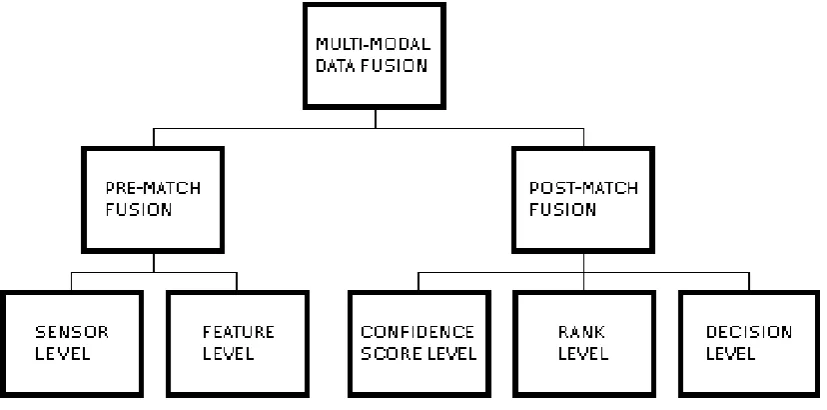
Early studies involving multiple characteristics focused on fusing data at the decision or condence score levels. More recent studies have attempted data fusion at the feature level. The concepts of decision, condence score and feature level fusion are discussed in Chapter 2 section 2.3.2.1.
Fusion at the feature level uses data closest to the raw data, and therefore is richer in feature information (compared with the other levels). To attain the best probability score, and thus take full advantage of the uniqueness of the biometric characteristics, it stands to reason that utilising the richness of these features would be advantageous. The experiment attempts to demonstrate this, and to develop a methodology which is ecient and scalable.
At the commencement of the current study, relatively little work had been done on data fusion at the feature level. Fusion of data at this level requires combining data from dierent biometric characteristics in a way that the individual features of
6Refer to The Biometrics Resource Center Website sponsored by the National Institute of
Standards and Technology (NIST). Available at:
each characteristic are truly represented. From an operational perspective, this poses diculties in relation to the additional processing required because of dierences in data format between the characteristics.
The signicance of the current investigation to the eld of biometrics generally, and multi-modal biometrics specically, is as follows:
• It investigates two biometric characteristics (keystroke dynamics and
nger-print recognition) independently of each other, to demonstrate that they can provide an accurate alternative to traditional authentication methods. In or-der to rigorously investigate these two biometric characteristics, the following issues need attention:
1. A feature selection method should be employed to lter `noise' from the collected data, because of the known high variability of keystroke dynam-ics raw data.
2. To facilitate classication of ngerprint feature data by Articial Neural Networks, a new ngerprint representation method needs development; this would also facilitate fusion of this data with keystroke dynamics data.
• It investigates multi-modal biometric authentication to demonstrate that it
provides additional accuracy improvements as well as a perceived robustness to the verication process.
• It investigates feature level data fusion to demonstrate that fusion at this level
oers improvement in accuracy over condence score level and decision level data fusion, and thus the importance of using feature rich data.
The methodology proposed in the current study should be generically applicable to any number (and any type) of biometric characteristics, provided that the pre-processing of raw datato obtain the feature datamaintains data integrity.
1.4 Scope Of The Research
The scope of the research is restricted to biometric authentication. That is, to improve the initial authentication procedure and thus reduce the probability of suc-cessful attack via this mechanism. Other possible authentication procedures are not investigated.
The choice of the two biometric characteristics used in the experiment was made for demonstration of the rationale behind the experiment, and for convenience of implementation. As discussed in Chapter 2 section 2.2 there are many biometric characteristics available for this type of experiment. The results of this experiment are claimed only for those characteristics implemented, though it could reasonably be expected that other biometric characteristics may be used for the same purpose (with the accuracy attained dependent on the actual characteristics chosen).
Feature level data fusion was investigated because researchers in this eld have long suspected that using feature level data would improve both accuracy and ro-bustness. Again, the results of this experiment are claimed only for feature level data fusion of the two biometric characteristics utilised, though it could reasonably be expected that other biometric characteristics may be used for the same purpose (with the accuracy attained dependent on the actual characteristics chosen).
As mentioned previously, there exist other avenues of attack for those attempting to gain unauthorised access to computer systems. Some attack possibilities may be due to:
• Exploitable vulnerabilities. As mentioned in section 1.1, vulnerabilities exist
on most computers and computer networks. In the case of computer networks, these vulnerabilities are exploitable remotely and with a degree of anonymity. As evident from the seemingly endless number posted on vulnerability web-sites7, these vulnerabilities aect computers with dierent operating systems
7Such as: US-CERT available at http://www.kb.cert.org/vuls/ and Security Focus available at
and many dierent components and applications. Very often patches are avail-able to x vulnerabilities, but users or system administrators are often not diligent in applying those patches.
• Human fallibility:
Social engineering remains one of the most prevalent means of informa-tion leakage. The celebrated case involving the hacker Kevin Mitnick provides a very good example of social engineering. Mr Mitnick attributes the majority of his success to social engineering skills rather than com-puter hacking skills (Mitnick and Simon, 2002). For example, he was able to obtain passwords and other secret information by impersonating someone else and just asking for it (Schneier, 2000).
Careless employees. Often employees do not realise the sensitivity of the data or resources that they are working with each day. Many have a lax attitude toward computer security because they are unaware of the importance of their actions in relation to the protection of their em-ployers physical and intellectual property. Also, middle and higher level managerial sta may not be as careful as they should be with technolog-ical secrets, and leak important information to unauthorised employees in order to `get the job done'. In a recent survey, 51% of respondents attributed security events to internal sources (CSO, 2010).
Disgruntled or mischievous employees (either current or past) can often be in possession of information about an employers sensitive property. If they believe they have cause, they could either attempt disruption themselves or pass on information to others who might have a vested interest in doing so.
The experiment performed for this dissertation makes no attempt to solve or discuss these issues beyond that already mentioned.
1.5 Experimental Method And The Rationale For
Its Selection
The research began with a thorough literature review to identify the most appropri-ate way to carry out a set of practical experiments testing biometric authentication approaches, with a relatively large number of participants.
The methodology adopted for all three phases of the experiment was strongly inuenced by the intention to utilise Articial Neural Networks (ANNs) for pattern recognition. ANNs and their suitability for pattern recognition are discussed in Chapter 2 sections 2.4.2 and 2.4.3 respectively. ANNs require input vectors of a consistent length, so for each phase feature vectors were required to be of a consistent length.
With this requirement in mind, feature selection was applied to the keystroke dynamics raw data to obtain feature vectors of the same length. Feature selection was employed to reduce the eects of the known variability that exists in keystroke dynamics raw data. Therefore, all keystroke dynamics feature vectors (for all sam-ples for all participants) were processed to a length of 24 elements. The process is described in detail in Chapter 5 section 5.4.
For the ngerprint recognition phase, a new representation method for nger-print features was developed to meet the requirement for consistent length feature vectors. This new representation method was also required to facilitate the data fusion phase, where the combined feature vectors (composed of the feature vectors from the previous 2 phases) needed to be of the same length.
By simple normalisation, data alignment was achieved between the keystroke dynamics feature vectors and the ngerprint feature vectors. The combined feature vectors were then used in the data fusion phase of the experiment. Two approaches for the data fusion phase were investigated: the complementary paradigm and the cooperative paradigm.
The complementary approach utilised 100% of data in the combined feature vec-tors (i.e. all of the features from both biometrics). Therefore, all data fusion feature vectors (for all samples for all participants using the complementary paradigm) were processed to a length of 76 elements. The process is described in detail in Chapter 5 section 5.6.2.
The cooperative approach utilised the `best' features from the combined feature vectors (i.e. selected features from both biometrics). This raises three questions (keeping in mind the requirement of a consistent length for the nal combined feature vector):
1. What percentage of the 100% of data in the combined feature vector should be used?
2. What proportion of features from the original feature vectors of each biometric characteristic should be used?
3. What feature selection method should be used?
The processes involved in developing solutions to these questions are described in detail in Chapter 5 section 5.6.3.
The experiments were designed on this basis and successfully carried out using 90 participants (see Chapters 5 and 6), producing very satisfactory results (see Chapters 7 and 8).
1.6 Outline Of This Dissertation
section 2.3.2.2). Pattern recognition and Articial Neural Networks (ANNs) are discussed in Chapter 2 section 2.4.
Chapter 3 provides a detailed discussion of the biometric characteristic keystroke dynamics (including a review of literature related to keystroke dynamics in section 3.4). Chapter 4 provides a detailed discussion of the biometric characteristic nger-print recognition (including a review of literature related to ngernger-print verication in section 4.5).
Chapter 5 describes in detail the research methodology and the implementation of the three phases of the experiment. Section 5.4 discusses the keystroke dynam-ics phase, section 5.5 discusses the ngerprint recognition phase, and section 5.6 discusses the feature level data fusion phase.
In Chapter 6 the method used to classify the outputs from ANN testing is dis-cussed, and the results are then presented in section 6.4. Chapter 7 then discusses these results in depth, comparing each phase with the other and with other research eorts in their respective elds.
Chapter 8 provides a conclusion to the dissertation, including discussion of the key ndings, limitations of the research, and potential future research directions.
1.7 Conclusion
In this chapter, some important aspects of computer security were highlighted in section 1.1. One of these aspects was authentication, and improving the initial authentication procedure was the overall focus of this dissertation.
Section 1.2.1 introduced the motivation for the research, which is related to problems associated with the traditional authentication procedure. Biometrics was introduced as oering a possible alternative to the traditional authentication pro-cedure. The objectives of the study were then outlined in section 1.2.2, and the research questions were posed in section 1.2.3.
The signicance or relevance of the study was discussed in section 1.3. Section 1.4 discussed the scope of the research, and section 1.5 summarised the research method.
Chapter 2
Background
2.1 Introduction
A number of associated areas of study impact on, or are utilised in, the work de-scribed in this thesis. These areas include biometrics, data fusion and multi-modal biometrics, and pattern recognition and Articial Neural Networks (ANNs). This chapter discusses these areas of study, and provides background on them to help understand why certain choices were made during the experimental stage of the study.
Consequently, background will be given on the following topics:
• Biometrics: the personal characteristics used for authentication (section 2.2).
This section discusses the following topics:
An overview of biometrics (section 2.2.1), where denitions for biometrics and biometric technologies are given.
The components of a biometric authentication system; what a biometric authentication system is intended to achieve; the requirements that it should meet; and how it operates (section 2.2.2).
Biometric system errors and performance variables used to present ex-perimental results (section 2.2.3).
A description of well known biometric characteristics for possible use in a biometric authentication system is also given in section 2.2.4.
• Data Fusion and Multi-Modal Biometrics (section 2.3):
Data Fusion: the integration or merging of data from multiple sources (section 2.3.1).
Multi-Modal Biometrics: the use of multiple personal characteristics used for authentication (section 2.3.2).
• Pattern Recognition and Articial Neural Networks (section 2.4):
Pattern Recognition: techniques for classifying data based on extracted information (section 2.4.1).
Articial Neural Networks: a particular pattern recognition technique used in the experiment of the current study (section 2.4.2).
2.2 Biometrics
2.2.1 Overview of Biometrics
According to Webster's dictionary (Websters, 2010a), there are two denitions for biometrics. In biology, biometrics refers to the science and technology of measuring and statistically analysing biological data. In information technology, biometrics refers to measuring and analysing human body characteristics for authentication purposes. In this latter context, biometrics is often termed biometric authentication. Rening this denition, biometric authentication concerns using the physical traits and behavioural characteristics that make each individual unique for authen-tication purposes, and encompasses any personal characteristic that can be used to uniquely verify a person's identity (Monrose and Rubin, 2000).
In information technology, verifying a person's claimed identity is the aim of the initial authentication procedure (Wayman et al., 2005). Traditionally, this proce-dure requires all legitimate users of a system to have possession or knowledge of a verication token. The token (for example, username and password) is presented to the system at the time of attempted authentication (that is, logon), and the system makes a comparison between the supplied token and a registered token for that user. If they match, the user is authenticated; if not, access is denied.
In order to use biometrics for authentication, biometric technologies have evolved to incorporate automated methods (usually performed by a computer) and the tech-nical apparatus used to verify the identity of a person based on physiological and/or behavioural characteristics (Wayman et al., 2005).
Biometrics technologies involve (Liu and Silverman, 2001):
• The capture of biological data from an individual.
• The extraction of uniquely identiable features from that data.
• The processing of these features into a format that can be stored and later
retrieved. This format is referred to as the `registered template' or `reference template' for that individual.
• The comparison or matching of the registered template with a template
pro-cessed from a sample provided at the time of authentication (referred to as a `query sample').
Uni-modal biometrics based on a single personal characteristic normally make it dicult for an impostor to impersonate a legitimate user. Logically, multi-modal biometrics should make it even more dicult for an impostor to impersonate a legitimate user, as it requires impersonation of two or more characteristics.
The next section discusses biometric authentication systems.
2.2.2 Biometric Authentication Systems
A biometric authentication system is intended to authenticate people based on cer-tain biometric characteristics. So, biometric authentication systems essentially op-erate as a pattern recognition system (Jain et al., 2004). That is, features of a biometric characteristic determine a distinct pattern for each person. Authentica-tion is granted or denied on the basis of recogniAuthentica-tion of this pattern, in the data supplied at the authentication stage.
It should be noted, that there are two broad categories of biometric characteris-tics (Revett et al., 2007):
1. The physiological category pertains to physical attributes or traits that allow for the measurement of a person's physiological features. Examples of such biometric characteristics are local ngerprint conguration, retinal blood vessel pattern, and iris pattern. The measurements of the physical attributes are used to formulate quantiable feature vectors.
2. The behavioural category pertains to a person's behavioural attributes or traits, that again require measurement and quantication. Examples of be-havioural biometric characteristics are speech pattern, signature, and typing pattern.
• Measuring devices for physical biometric characteristics are subject to
electro-magnetic interference (noise), and natural wear and tear. This could reduce the eciency and accuracy of their use.
• The measuring devices, and the software to interact with them, are typically
costly to deploy. This makes it dicult to utilise physiological biometric char-acteristics for general remote transactions (for example, in web based applica-tions such as online purchasing or banking).
• Some physiological biometric characteristics would be considered by users as
intrusive. For example, to use iris and retinal patterns, photographing or scanning the eye in very close proximity is required, and users may nd this uncomfortable and inconvenient.
Though the behavioural biometric characteristics have an advantage in that they do not suer from the limitations associated with the physiological biometric char-acteristics, they do suer from the following disadvantages (Revett et al., 2007):
• Their attributes or traits are more dicult to precisely measure and quantify
than the physiological biometric characteristics. Thus they typically demon-strate much more variability.
• Their attributes or traits are not as enduring. That is, they are more subject to
change over short periods of time, for example because of attitude or tiredness.
• Because of the two previous points, behavioural biometric characteristics are
considered less accurate, reliable, and robust in comparison to the physiological biometric characteristics.
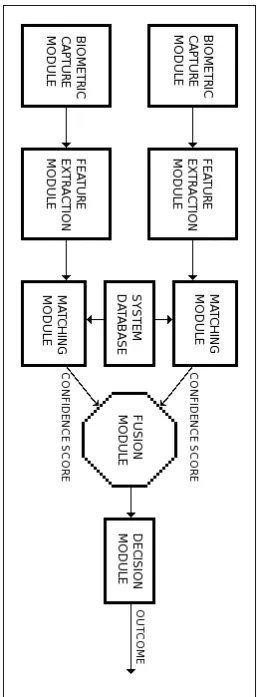
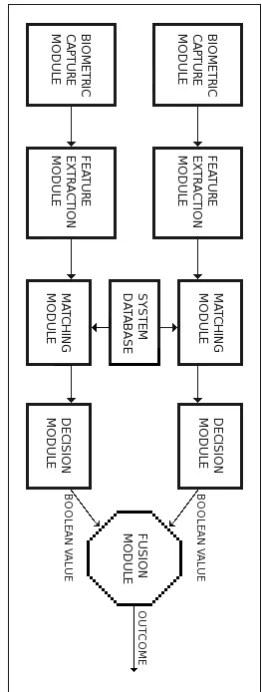
A generic uni-modal biometric authentication system (illustrated in Figure 2.1) consists of four modules (Ross and Jain, 2004; Faundez-Zanuy, 2009):
1. The sensor or biometric capture module. This is the module responsible for capturing the physical or behavioural traits of the particular biometric char-acteristic under observation.
2. The feature extraction module. This module processes the raw captured data by extracting the features that represent the traits of the biometric charac-teristic. The extraction of features forms the feature vector that is output by this module.
3. The matching module. This module utilises a classier to ascertain if the extracted features, of the biometric characteristic under observation, match those of the registered template in the database. The module typically outputs a match condence score, being the likelihood or probability that the two samples match.
4. The decision module. This module uses the condence score to determine the nal classication decision. As biometric samples rarely match exactly, a threshold is typically applied in this module to make the nal decision.
Figure 2.1: The Generic Biometric Authentication System The image was sourced from Faundez-Zanuy, 2009.
• Universality: each person (in the target user group) should have the
character-istic. Some characteristics may be encumbered by physical disabilities, such as muteness or eye disease.
• Uniqueness or Distinctiveness: any two persons should be suciently dierent
in terms of the characteristic. For example, identical twins each have unique ngerprints, yet they cannot be distinguished by their DNA.
• Permanence: the characteristic should be suciently invariant (with respect
to the matching criterion) over a relevant period of time. For example, iris features remain stable for decades, whereas facial features change signicantly with age and ngerprint features can be degraded by scaring, abrasion or prolonged use of cleaning chemicals.
• Collectability: obtaining the characteristics should be easy, and they must be
quantitatively measurable. For example, retinal scanning requires the use of expensive apparatus and the collection process requires precise positioning of the eye. This makes collectability cumbersome, whereas keystroke dynamics only requires that the user has the ability to type (even with only one nger) on a standard computer keyboard.
The following are also required for a practical implementation of an authentica-tion system:
• Performance: the system must have the resources needed to attain an
achiev-able recognition accuracy and speed for the intended number of user proles. The system must also compensate for operational and environmental factors that may aect accuracy and speed.
• Acceptability: the extent to which people are willing to accept the use of a
bio-metric characteristic (for authentication purposes) in their daily lives. Facial recognition is considered an acceptable biometric because people are accus-tomed to having their photographs taken, and the process in non-intrusive.
Most people would nd this highly intrusive, and others would not want laser beams red into their eyes.
• Circumvention: the system must be suciently robust to withstand various
fraudulent methods of attack. From a security perspective, low circumvention would be considered highly desirable.
A biometric authentication system typically incorporates two phases (Jain et al., 2004):
• Enrolment phase: This phase involves the capture, feature extraction, and
formation and storage of a registered template for each legitimate user of the system. Quality checks must be performed during the enrolment phase, to ensure that the acquired samples can be accurately and reliably processed.
• Validation phase: This phase has two modes:
Verication mode: the system validates a person's claimed identity, by comparing their pre-stored registered template with a template derived from a sample provided by the claimant at the time of attempted authen-tication (termed a `query' or `test' sample). The process of obtaining the query template must be the same as that employed in the formation of the registered template (during the enrolment phase). Verication is a one-to-one operation, aimed at preventing multiple people from using the same identity.
Identication mode: the system identies an individual by searching a database of registered templates, and comparing their query template with all templates in the database. Identication is a one-to-many oper-ation, aimed at preventing a single person from using multiple identities.
2.2.3 Biometric Performance Variables and System Errors
In an empirical study where classication is being assessed (in the case of biometrics, verication accuracy), there are four possible outcomes1 (Bradley, 1997; Fawcett,
2006; Flach, 2004):
1. True positive. The sample of a valid user is correctly accepted as belonging to that user.
2. False positive. The sample of a non-valid user, is incorrectly accepted as belonging to a valid user. This is referred to as a Type I error.
3. True negative. The sample of a non-valid user, is correctly rejected as not belonging to a valid user.
4. False negative. The sample of a valid user, is incorrectly rejected as not be-longing to that user. This is referred to as a Type II error.
In experiments related to authentication, it is the error in classication that is of interest. Therefore, classication outcomes 2 and 4 above (i.e. Type I and II errors) are measured by the following rates:
• The rate at which non-valid users are falsely accepted as valid users. That is,
false positives or Type I errors.
• The rate at which valid users are falsely rejected. That is, false negatives or
Type II errors.
The two performance variables used to express these rates are generally termed the False Acceptance Rate (FAR) and the False Rejection Rate (FRR) respectively2.
Thus, the FAR is expressed as the ratio of samples from non-valid users that are falsely accepted, and the FRR is expressed as the ratio of samples from valid users that are falsely rejected.
1These classication outcomes are discussed in greater detail in Chapter 6 section 6.2.1. 2In some literature, these are termed the False Match Rate (FMR) and the False Non-Match
In a typical authentication system, the primary concern is to minimise access to the system by non-valid users. The degree of minimisation will be dependent on the nature of the information being protected. For example, the military may have top secret information to be protected, and would insist on eliminating any unauthorised access. However, in achieving zero tolerance access, valid users may be inconvenienced by being falsely rejected numerous times.
In the case of a top secret system, this may be considered an acceptable trade-o. In contrast, a home computer used by family members would not necessarily require the same level of restriction, and numerous false rejections may be considered an unreasonable inconvenience.
In an experiment, the ultimate goal when evaluating verication accuracy is to achieve a FAR of 0%. Such a rate means that no non-valid user has been accepted as a valid user, and indicates that the experiment performed to the highest expec-tations. The goal for the FRR is to achieve a rate that is appropriately low without negatively impacting on the FAR. Previous research has shown that a FRR of 0% is dicult to attain without having some detrimental eect on the FAR (Maltoni et al., 2003; Qi and Wang, 2005).
As an example, a FAR of 0.4% and a FRR of 5% indicates that four in one thou-sand non-valid users could expect to be successful in gaining unauthorised access, while a valid user could expect to be rejected once in twenty attempts. Reducing the FRR to 1% would mean a valid user could expect to be rejected only once in one hundred attempts. However, this may, for instance, increase the FAR to about 2.5%, which means that twenty ve in one thoudand non-valid users could expect to be successful in gaining unauthorised access. This would not generally be considered a wise trade-o.