Enhanced antioxidant system reprogrammes oxidative
stress through hypersensitive response in leaves of rice plant
challenged with Aspergillus species
Padmanabh Dwivedi*, Asha Kumari and Bansh Narayan Singh
Department of Plant Physiology, Institute of Agricultural Sciences, Banaras Hindu University, Varanasi 221005, India *Corresponding author: [email protected]
Paper No. 429 Received: 15-2-2016 Accepted: 10-4-2016
Abstract
Nitric Oxide (NO) is involved in diverse physiological processes in plants. As a developmental regulator, it promotes germination, leaf extension and root growth, and also delays leaf senescence and fruit maturation. As modulator of disease resistance, it triggers hypersensitive cell death or Hypersensitivity Response (HR) and activates the expression of several defense genes. This wide variety of effects reflects the basic signaling mechanisms that are utilized by virtually all living organisms. The ubiquity of NO reactions as well as the finding that the biochemical and molecular mechanisms underlying many physiological processes are well conserved between diverse species has opened the exploration of NO chemistry in different organisms. Experiments were conducted in Department of Plant Physiology, Institute of Agricultural Sciences, Banaras Hindu University to study the NO mediated HR during interaction of Aspergillus sp. with rice plants. The pathogen (Aspergillus sp) was infiltrated in leaves of rice plants (Oryzasativa), and the responses were observed after 6, 12, 24 and 48 h of infection. The experiment was laid out in Factorial Complete Randomized Design which consisted of 8 treatments, 3 replications. Different biochemical parameters like Nitrite content, Proline, H2O2, SOD, Ascorbate Peroxidase (APX), Total Phenol Content (TPC), Phenyl ammonia lyase (PAL) were measured. PAL and TPC measures the quantity of Systemic Acquired Resistance (SAR) developed in plants against pathogen attack. Among the above mentioned parameters except nitrite, proline and H2O2, all other parameters showed maximum activity at 48 h treatment. The results indicate that HR was developed during rice-Aspergillus interaction through enhanced anti-oxidant system, possibly mediated through NO, thereby restricting pathogen’s spread after 12 to 48 h of infection of rice leaves with Aspergillus sp.
Highlights
• Nitrite content regulates hypersensitive response during rice plants – Aspergillus sp. interaction, indicating for participation of nitric oxide signaling in the process
• Increased anti-oxidant system and SystemicAcquired Resistance facilitated development of hypersensitive response in rice plants against Aspergillus infection
• The results have significant bearing on disease management in rice against fungal pathogen. It also demonstrated, for the first time, the participation of anti-oxidants system in plants during hypersensitive response triggered by nitric oxide through enhanced nitrite production in rice plants upon interaction with plant pathogen, thus facilitating defense response against the pathogen
Keywords: Aspergillus, infiltration, griess reagent, hypersensitive response, nitric oxide, oryza sativa, pathogen
DOI Number: 10.5958/2230-732X.2016.00027.9 ©2016 New Delhi Publishers. All rights reserved
Rice is a monocotyledonous angiosperm. The
genus, to which it belongs, Oryza, contains more than 20 species, only two of which are referred to as cultivated rice as Oryza sativa, cultivated in
South -East Asian countries and Japan, and Oryza glaberrima cultivated in West Africa. Rice was originally cultivated in tropical Asia, the oldest
record dating 5000 years BC, but then extended also to temperate regions. More than 90% of the world’s rice is grown and consumed in Asia, where 60% of the world’s population lives. With the world population estimated to increase to about 8.2 billion in the year 2030, the global rice demand will rise to about 765 million tonnes, or 533 million tons of milled rice (FAO 2002). For almost three decades
since the Green Revolution, the rice yield growth
rate was approximately 2.5% per year. During the 1990s, however, this has decreased to 1.1%. The reason for this decline is attributed partly to the fact
that it has served as a host for a number of diseases
and insect-pests, 54 in the temperate zone and about 500 in tropical countries. Of the major diseases, 45 are fungal, 10 bacterial, 15 viral (Ou 1985) while 75 are insect-pests and nematodes. Realizing the
economic losses caused by them, efforts have been directed to understand the genetic basis of resistance and susceptibility.
But, in nature, plants have unique quality to develop defense mechanism against biotic and abiotic stress i.e. through Hypersensitivity Response (HR)
or oxidative burst (Apel and Hirt 2004). The HR apparently protects plant against attack by various
pathogens and might enhance plant immunity in different ways. Nitric oxide (NO) has been considered as potential signaling molecule involved in triggering defense against various pathogenic
attack in plants (Dwivedi and Choudhury 2012)). It
has been demonstrated that NO can be produced by nitrite via plasma membrane bound nitrite: NO reductase either by plant roots or cells (Stohr
et al. 2001; Dwivedi, and Choudhury 2012) and through mitochondrial electron transport (Planchet et al. 2005; Dwivedi and Singh); it participates in HR mediated defense response. Both reactive nitrogen species and reactive oxygen species are primarily involved in signal cascade leading to HR
(Delledonne et al. 1998; Durner and Klessig 1999; Klessig et al. 2000; Neill et al. 2002; Lamotte et al. 2004; Wendehenne, Durner and Klessig 2004).
Oxidative burst situation is created by invasion of pathogens generated by highly reactive oxygen
species (ROS). Depending on level, ROS may be beneficial or harmful. At low level it works as
secondary messenger (Williams and others 2011),
and at high level, decreases seed viability, root growth, and causes leaf abscission and desiccation,
breakdown of lipids, proteins, carbohydrates, chloroplasts or carotenoids (Philosoph-Hadas et al. 1994). To remove from system, plants have
acquired antioxidant machinery system such
as ascorbate peroxidase (APX), catalase (CAT), superoxide dismutase (SOD), guaiacol peroxidase (GPX), glutathione reductase (GR), glutathione-Stransferase (GST), peroxidases (POX) as well as certain non-enzymatic plant antioxidants such
as carotenoids, tocopherols, phenolics, ascorbate,
glutathione, flavonoids and proline (Nizamuddin 1987; Wojtaszek 1997; Kang and Saltveit 2002; Jain et al. 2011,12). Each plant has its own general
strategies to improve self immunity under stresses
(El-Zahaby and others 1995). Susceptibility of
pathogens to a plant depends on biotic factors to generate cellular antioxidant capability and signal
cascade like systemic acquired resistance (SAR). A s p e rg i l l u s s p e c i e s i s a c o s m o p o l i t a n , highly aerobic fungus found in almost all
oxygen-rich environments. It is commonly found in soil and causes serious disease not only in animals but highly
affected in number of crops (Klich 2002). Aspergillus
is commonly powdery masses of brown color on the lower surface. In grains and legumes, infection area
is often appearing downy or powdery. Hyphae are rapidly grown and produce a thread like mycelium.
After successful establishment of mycelium, it secretes degradative enzymes or proteins which
can break down complex nutrients. Therefore, keeping the overall mechanisms of plant defense
responses against this pathogen, experiments were conducted to understand various events involved
in intra-cellular defense mechanisms in rice plants
against Apergillus infection.
Materials and methods
Isolation, multiplication and suspension culture preparation of pathogen
An isolate of Aspergillus species was obtained from
Department of Mycology and Plant Pathology,
Institute of Agricultural Sciences, Banaras Hindu
the mycelia with the help of an inoculation needle
and incubated at 28 ± 2oC. After two weeks, spores carefully transferred into 10 mM MgCl2 solution.
Density of suspension culture was kept around 1.41 OD600. MgCl2 solution without spore culture served as control for each experiment.
Experimental designing
Rice seeds (Oryza sativa L.) was procured from Department of Genetic and Plant Breeding,
Institute of Agricultural Sciences, Banaras Hindu University, Varanasi. Surface sterilization of seeds
was performed with the help of 0.1% HgCl2 for 30
sec and washed three times with distilled water.
Seeds (15-20) were sown in plastic pots (20x20 cm) containing sterilized soil:sand:FYM (2:1:1). Whole
set up was transferred into plant growth chamber
provided with 8h/16h (light/dark) condition, 24oC temperature, 75% relative humidity for 21 days.
Biochemical measurements
Estimation of nitrite content
Nitrite content was estimated by Griess regent as
per method described by Planchet et al. (2005), which is based on two-step diazotization reaction. Leaf samples (100 mg) was added in 300 µl Griess reagent (5% phosphoric acid containing 0.1% NED in 1% sulfanilamide), 50 µl 0.5 M zinc acetate and volume made up to 3 mL with distilled water, incubated in dark for 30 min at room
temperature. Then the absorbance of the reaction
mixture was measured at 540 nm.
Qualitative assessment of H2O2 production
HR lesions developed in leaves were kept in 2 mL of DAB staining solution as described by Thordal-Christensen et al. (1997). Tubes were kept in shaker for 4-5 h at 80-100 rpm in dark at 25oC. De-chlorophylization was performed by placing lesion samples in bleaching solution (ethanol/ acetic acid/glycerol; 3:1:1) for 15 min at 90oC in water bath. Replaced the bleaching solution with fresh bleaching solution and allowed to stand for
30 min. At last leaf samples were placed on slides
and observed under microscope.
Hydrogen peroxide estimation
Hydrogen peroxide was determined by the method
described by Mukherjee and Choudhary (1983). Leaf
samples (100 mg) were homogenized in 10 mL cold acetone and filtered through Whatman No.1 filter paper. Reaction mixture containing filtrate and 4 mL of titanium reagent was added followed by 5 mL
of concentrated ammonium solution to precipitate
peroxide- titanium complex. The contents were centrifuged for 5 min at 10,000 rpm and precipitate dissolved in 10 mL 2 N H2SO4. It was centrifuged to remove undissolved material and absorbance
was recorded at 415 nm against blank (2 N H2SO4).
Estimation of Ascorbate Peroxidase (APX) activity
Ascorbate peroxidase activity was estimated in the
first fully expanded leaf of rice according to the method proposed by Nakano and Asada (1981). It is based on the decrease in absorbance at 290 nm as
ascorbate is oxidized. The reaction mixture for the
peroxidase contained 0.1 mL of 100 mM potassium phosphate buffer (pH 7.5), 0.1 mL of 1.5 mM H2O2,
0.40 mL of 3 mM ascorbic acid, 0.1 mL of 3 mM EDTA and 1 mL of enzyme extract in a total volume of 3 mL. In blank, ascorbic acid was not added. The
reaction was started by adding the enzyme and
decrease in absorbance was recorded 30 sec after this addition at 430 nm.
Estimation of superoxide dismutase (SOD) activity SOD activity was estimated by the method proposed by Dhindsa et al. (1981). Leaf samples (100 mg) homogenized in 1 mL of 0.1 M potassium phosphate
buffer on ice chilled mortar and pestle and
centrifuged at 16000 rpm for 20 min at 4oC. Three mL of the reaction mixture containing 0.1 mL of 1.5 M sodium carbonate, 0.2 mL of 200 mM methionine, 0.1 mL of 2.25 mM NBT, 0.1 mL of 3 mM EDTA, 1.5 mL of 100 mM potassium phosphate buffer, 1 mL of DW and 0.1 mL of enzyme extract were taken in
test tubes in replicates from each enzyme sample.
Two tubes without enzyme extract were taken as control. The reaction was started by adding 0.1 mL riboflavin (60 µM) and placing the tubes below a light source of two 15 W florescent lamps for 15 min. Reaction was stopped by switching off the light and covering the tubes by black cloth. Tubes without
enzyme extract developed maximum colour. A non irradiated complete mixture that did not develop
colour served as blank. Absorbance was recorded at 560 nm and one unit of enzyme was taken as the
reading of sample to 50 per cent in comparison to the tubes lacking enzyme.
Determination of total phenol content (TPC)
Total phenolic contents in the extracts were
determined by the modified Folin-Ciocalteu
method as described earlier (Wolfe et al. 2003). An aliquot (100 µl) of the extracts was mixed with 5 ml Folin-Ciocalteu reagent (previously diluted with water 1:10, v/v) and 4 ml (75 g/l) of sodium carbonate. The tubes were vortexed for 15 sec and allowed to stand for 30 min at 40°C for color
development. Absorbance was recorded against
reagent blank at 765 nm using the Simadzu
UV-VIS spectrophotometer. Samples of extract were
evaluated at a final concentration of 0.1 mg/mL.
Total phenolic content was expressed as mg per gram gallic acid equivalent.
Determination of Phenyl Ammonia Lyase (PAL) HR samples (0.5 mg) were crushed with borate buffer, 1.3 mL of distilled water were mixed with
the extracted sample then finally reaction was
started by adding 1mL phenylalanine solution and incubated for 30-60 min at 32oC, according to the method described by Brueske (1980). Reaction was
stopped by using 0.5 mL of 1 mL TCA. Absorbance was taken at 290 nm. Standard curve was prepared using trans-cinnamic acid.
Free proline content
HR samples (0.5 g) were homogenized in 5 mL of sulphosalicylic acid (3 per cent) using pre-chilled mortar and pestle and centrifuged at 10,000 g for 10 min. Residue was again extracted twice with 5 mL of 3% aqueous sulphosalicylic acid. All the supernatant fractions were pooled and final volume was made to 15 mL. Two mL of the extract was taken in the test tube and 2 mL each of glacial
acetic acid and ninhydrin reagent were added. The reaction mixture was boiled in water bath at
100oC for 30 min till brick red colour developed. After cooling the reaction mixture, 5 mL of toluene
was added and then transferred to separating
funnel and the absorbance was read at 520 nm using spectrophotometer against toluene blank, as
described by Bates et al. (1973). Concentration of
proline in the samples was estimated by referring to a standard curve of proline.
Statisticalanalysis
Values from different experiments represented mean and SEM of at least three replications from each
experiment. The analysis of variance was carried out separately for each experiment for various time intervals according to the procedure of Factorial
Completely Randomized Design.
Results and discussion
Effect of Nitrite content in hypersensitive response development
Plants have several cellular defense mechanisms to
protect themselves against pathogens. In the present
experiments, we studied the interaction of different
molecules involved in plant defense mechanisms mediated through hypersensitive response. HR is the first line of immune response developed by
plant after elicitation of any foreign agent, serving as innate immune local response. During infiltration
of Aspergillus pathogen in the rice leaves, the HR
developed (Figure 1A); in the HR lesion samples
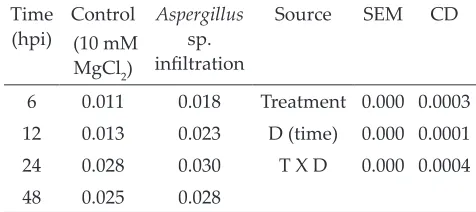
production of nitrite continuously increased up to
24 h, but maximum nitrite content obtained after the leaves were challenged with pathogen was 0.030 (µmol g-1h-1FW) as compared to control 0.028 (µmol
g-1h-1FW) (Table 1). It is not governed by a single
molecule, but has complex molecular interactions of nitrogen generating species and reactive oxygen generating species (ROS).
Nitrite production is an indication of NO emission during infection which gets converted into a toxic
compound peroxinitrite (ONOO) after interaction
with ROS generating molecules, which causes local
cell death (Delledonne et al. 2001; Radi et al. 2005; Gerardo Ferrer-Sueta and Rafael Radi, 2009). In this
experiment, production of H2O2 along with nitrite content was increased. Qualitative and quantitative analysis of hydrogen peroxide production was
estimated by DAB staining and a procedure
described in materials and methods, respectively.
Reddish brown stain by DAB was more prominent
in Aspergillus infiltrated rice leaves as compared to control (Figure 1 B & C). Quantitative measurement
of H2O2 content indicated maximum production
after 24 h of infection with pathogen (0.003 µmol
g-1 FW), but HR in control rice leaves (0.001 µmol
Production of H2O2 leads to HR mediated program
cell death (Dat et al. 2003). If they are not removed from system cause cell damage to host by non-
host pathogens. Therefore, several antioxidant s are involved in removing ROS molecules (Vacca
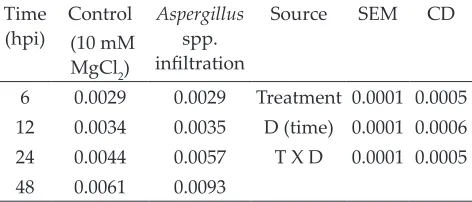
et al. 2004; Baxter et al. 2014). In this experiment, APX activity in HR lesion samples continuously increased up to 48 h (Table 3). The maximum APX content in control was 0.0061 (nmol Ascorbic
acid oxidized min-1 mg-1 protein) while in those
challenged with Aspergillus (HR samples) was
0.0093 (nmol Ascorbic acid oxidized min-1 mg-1
protein). Another antioxidant scavenger enzyme,
SOD was produced continuously in rice leaves after infiltration of Aspergillus. In infiltrated rice leaves, the maximum 11.0 (EU g-1 FW) SOD activity while 7.6 (EU g-1FW) in control were observed at 48 h (Table 4). They work together to promote
scavenging of free radicals. A similar result was reported in cultivars of Phaseolus vulgaris treated with Uromyces phaseoli (Buonaurio et al. 1987).
Increase in antioxidant enzymatic machinery may lead to improvement in stress tolerance (Murgia
et al. 2004; Lee et al. 2007). Infection of Erysiphe graminis f. sp. hordei leads to increased antioxidant
metabolism in barley (El-Zahaby et al. 1995). Phenol production is a positive indicator of plant’s resistance which plays key role as antimicrobial
defense arsenal of plants (Shoresh and Harman
2008; Abo-Elyousr et al. 2009). In this experiment, total phenol content (TPC) increased significantly higher compared to un-infiltrated (10 mM MgCl2)
after being challenged with Aspergillus (Table 5). Small quantity of phenol changes was also detected
in control i.e. 1.3 (mM gallic acid-1g-1 FW); however, in leaf samples infiltrated with pathogen, it was slightly higher i.e., 1.7 (mM gallic acid-1g-1 FW) at 48 h. Moreover, induction of phenol content is correlated with induced PAL activity, which is a key enzyme of phenyl- propanoid biosynthesis pathway,
in the synthesis of phenols or phytoalexins. These are involved in reinforcement of plant cell wall and salicylic acid signaling molecules (Nicholson
and Hammerschmidt, 1992; Wen et al. 2005). In the present study, maximum PAL activity was detected in the rice plants infiltrated with Aspergillus compared to control at the end of 48 h infection
(Table 6). After infiltration, PAL activity increased at all the time intervals and maximum (25.0 µM TCA
g-1FW) was recorded at 48 h; however, in control it was less (15.5 µM TCA g-1FW) as compared to infiltrated regions of leaves. Increased TPC and PAL
activity in this experiment may, thus, be correlated with accelerated defense response against fungal pathogen, Aspergillus species in rice plants.
Apart from activation of defense molecules as described above, some other molecules are involved
in stress tolerance such as proline, flavonoids and terpenes. Proline is an amino acid which takes
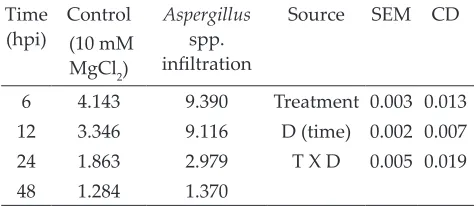
part in maintaining membrane stability. It can increase several folds under stress conditions. In the present study, proline accumulation increased
at early stage i.e., 6 h thereafter declined up to 48 h in Aspergillus infiltrated and non- infiltrated
rice leaves. Maximum proline accumulation in
Aspergillus infiltrated rice leaves was found to be 9.39 (mg g-1 fresh weight) while minimum in control 4.14 (mg g-1 fresh weight) at 6 h (Table 7). A similar
result was observed in Arabidopsis challenged with races of Pseudomonas syringae pv tomato (Pst),
which triggered proline accumulation indicating an association with development of the hypersensitive response (Fabro et al. 2004). It may be correlated with induced defense response along with TPC and PAL activation.
Table 1: Analysis of nitrite content (µmol g-1h-1FW) in
HR induced by Aspergillus species in rice leaves (hpi)
Time
(hpi) (10 mM Control MgCl2)
Aspergillus
sp.
infiltration
Source SEM CD
6 0.011 0.018 Treatment 0.000 0.0003
12 0.013 0.023 D (time) 0.000 0.0001
24 0.028 0.030 T X D 0.000 0.0004
48 0.025 0.028
Mean and standard error of mean (SEM) were
calculated for estimation of nitrite from leaf area
of 0.75 cm2. Rice leaves were infiltrated with the Aspergillus sp. Data were collected from three leaves in each experiment. Data were significantly different at P < 0.05 in all experiments. Hpi, hours
Fig. 1: Infiltration of suspension culture of Aspergillusin
rice leaves. Black spot in upper yellow circle indicated the spores and HR- like symptom developed in lower
circle (A). H2O2 staining with DAB in rice leaves (C) but were absent in control (B), upon rice leaf infiltration
withAspergillus. After 24 h, the Aspergillus induced HR response. Brown color indicates the H2O2 productions whereas faint color developed indicated for less production of H2O2. Similar results were obtained in three independent experiments.
Table 2: Analysis of H2O2 content (µmol g-1 FW) in rice
plants after infiltration of fungal pathogen Aspergillus sp. at different time intervals (hpi).
Time
(hpi) (10 mM Control MgCl2)
Aspergillus
sp.
infiltration
Source SEM CD
6 0.000 0.001 Treatment 0.0006 0.0025
12 0.001 0.001 D (time) 0.0001 0.0004
24 0.001 0.003 TX D 0.0003 0.0012
48 0.001 0.001
Mean and standard error of mean (SEM) were
calculated for estimation of H2O2 content from a leaf
area of 0.75 cm2. Rice leaves were infiltrated with
the Aspergillus sp. Data were collected from three leaves in each experiment and were significantly different at P < 0.05 in all experiments. Hpi, hours
post infection.
Table 3: APX activity (nmol Ascorbic acid oxidized min -1 mg-1 protein) in rice plants after infiltration of fungal
pathogen Aspergillussp. at different time intervals (hpi)
Time
(hpi) (10 mM Control MgCl2)
Aspergillus
spp.
infiltration
Source SEM CD
6 0.0029 0.0029 Treatment 0.0001 0.0005
12 0.0034 0.0035 D (time) 0.0001 0.0006
24 0.0044 0.0057 T X D 0.0001 0.0005
48 0.0061 0.0093
Mean and standard error of mean (SEM) were
calculated. Rice leaves were infiltrated with the
Aspergillus sp. Data were collected from three leaves in each experiment. Data were significantly
different at P < 0.05 in all experiments. Hpi, hours
post infection.
Table 4: SOD activity (EU g-1FW) in rice plants after
infiltration of fungal pathogen Aspergillussp. at different
time intervals (hpi)
Time
(hpi) (10 mM Control MgCl2)
Aspergillus
spp.
infiltration
Source SEM CD
6 6.3 8.1 Treatment 0.070 0.287
12 6.7 9.1 D (time) 0.035 0.144
24 7.1 10.1 T X D 0.098 0.406
48 7.6 11.0
Mean and standard error of mean (SEM) were
calculated. Rice leaves were infiltrated with the
Aspergillussp. Data were collected from three leaves
in each experiment and data were significantly
different at P < 0.05 in all experiments. Hpi, hours
post infection.
Table 5: Total phenol content (mM gallic acid-1g-1FW)
in rice plants after infiltration of fungal pathogen Aspergillussp. at different time intervals (hpi)
Time
(hpi) (10 mM Control MgCl2)
Aspergillus
spp.
infiltration
Source SEM CD
6 0.7 1.3 Treatment 0.008 0.032
12 0.8 1.3 D (time) 0.004 0.016
24 1.0 1.5 T X D 0.011 0.045
48 1.3 1.7
Mean and standard error of mean (SEM) were
calculated. Rice leaves were infiltrated with the
Aspergillus sp. Data were collected from three leaves in each experiment. Data were significantly different at P < 0.05 in all experiments. Hpi, hours
post infection.
Table 6: PAL activity (µM TCA g-1fresh weight) in rice
plants after infiltration of fungal pathogen Aspergillus sp. at different time intervals (hpi)
Time
(hpi) (10 mM Control MgCl2)
Aspergillus
spp.
infiltration
Source SEM CD
6 7.9 17.4 Treatment 0.053 0.220
12 11.4 21.8 D (time) 0.027 0.110
24 13.7 23.0 T X D 0.075 0.311
Mean and standard error of mean (SEM) were
calculated. Rice leaves were infiltrated with the
Aspergillussp. Data were collected from three leaves
in each experiment. The data were significantly
different at P < 0.05 in all experiments. Hpi, hours
post infection.
Table 7: Free proline content (mg g-1 fresh weight) in rice
plants after infiltration of fungal pathogen Aspergillus sp. at different time intervals (hpi)
Time
(hpi) (10 mM Control MgCl2)
Aspergillus
spp.
infiltration
Source SEM CD
6 4.143 9.390 Treatment 0.003 0.013
12 3.346 9.116 D (time) 0.002 0.007
24 1.863 2.979 T X D 0.005 0.019
48 1.284 1.370
Mean and standard error of mean (SEM) were
calculated. Rice leaves were infiltrated with the
Aspergillussp. Data were collected from three leaves
in each experiment. The data were significantly
different at P < 0.05 in all experiments. Hpi, hours
post infection.
Conclusion
In the present study we investigated that host plant
has intra-cellular defense mechanisms to counteract the oxidative stress induced by pathogens. Enhanced antioxidant enzymatic system, TPC content and PAL
activity mitigated oxidative burst, mediated through increased nitrite content, thus possibly involving
nitric oxide signaling; this explained the protection
from pathogen stress. Additional investigations
related to nitric oxide mediated HR in plant-fungal
pathogen interaction need to be strengthened.
Acknowledgments
Authors thank SERB-DST, Govt. of India, New Delhi for financial assistance sanctioned to corresponding author; the study made in this paper was a part of the project proposal granted to the corresponding
author.
References
Abo-Elyousr, K.A.M., M. Hashem and E.H. Ali. 2009. Integrated control of cotton root rot disease by mixing fungal biocontrol agents and resistance inducers. Crop Protection28: 295–301.
Apel, K. and H. Hirt. 2004. Reactive oxygen species: metabolism, oxidative stress, and signal transduction. Annual Review of Plant Biology55:373–399.
Bates, L., R.P. Waldren and I.D. Teare. 1973. Rapid determination of free proline for water stress studies. Plant Soil39:205–207.
Baxter, A., R. Mittler and N. Suzuki. 2014. ROS as key players in plant stress signaling. Journal of Experimental Botany
65 (5):1229–1240.
Brueske, C.H. 1980. Phenylalanine ammonia-lyase in tomato roots infected and resistant to the root knot nematode, Melidogyne incognita. Journalof Physiology and Plant Pathology16:409–414.
Buonaurio, R., G. Della Torre and P. Montalbini. 1987. Soluble superoxide dismutase (SOD) in susceptible and resistant host-parasite complex of Phaseolus vulgaris and Uromyces phaseoli. Physiological and Molecular Plant Pathology31:173-184.
Dat, J.F., R. Pellinen, T. Beeckman, B. Van De Cotte, C. Langebartels, J. Kangasjarvi, D. Inze and F. Van Breusegem. 2003. Changes in hydrogen peroxide homeostasis trigger an active cell death. Plant Journal
33 (4): 621-32.
Delledonne, M., J. Zeier, A. Marocco and C. Lamb. 2001. Signal interactions between nitric oxide and reactive oxygen intermediates in the plant hypersensitive disease resistance response. Proceedings of the National Academy of Sciences USA 98: 13454–13459.
Delledonne, M., Y. Xia, R.A. Dixon and C. Lamb. 1998. Nitric oxide functions as a signal in plant disease resistance. Nature394: 585–588.
Dhindsa, R.S., P. Plumb-Dhindsa and T.A. Thorpe. 1981. Leaf senescence: correlated with increased levels of membrane permeability and lipid peroxidation, and decreased levels of superoxide dismutase and Catalase. Journal of Experimental Botany 32:93-101. doi. org/10.1111/j.1365-313X.2005.02335.x
Durner, J. and D.F. Klessig. 1999. Nitric oxide as a signal in plants. Current Opinion in Plant Biology2: 369–374. Dwivedi, Padmanabh and Singh. B.N. 2014. Nitric oxide
in plants: Sources, methods of detection and role assignaling agent in plant responses to biotic stresses. In: Advances in Crop Physiology (ed. A L Singh). Daya Publishing House, New Delhi, pp 261-278.
Dwivedi, Padmanabh and Choudhury, S.R. 2012. Nitric oxide as a signaling molecule in plants. International Journal of Agriculture, Environment and Biotechnology 5(3): 303-308. El-Zahaby, H.B., Gullner, G. and Kiraly, Z. 1995. Effects of
powdery mildew infection of barley on the ascorbate– glutathione cycle and other antioxidants in different host-pathogen interactions. Biochemistry and Cell Biology85(10): 1225–1230.
Jain. A., Singh, S., Sarma, B.K. and Singh, H.B. 2011. Microbial consortium–mediated reprogramming of defence network in pea to enhance tolerance against Sclerotinia sclerotiorum. Journal of Applied Microbiology
112: 537–550.
Jain. A., Singh, S., Sarma, B.K. and Singh, H.B. 2012. Microbial Consortium-Induced Changes in Oxidative Stress Markers in Pea Plants Challenged with Sclerotinia sclerotiorum. Journal of Plant Growth Regulator 12: 9306-3. Kang, K.M. and Saltveit, M.E. 2002. Chilling tolerance of
corn, cucumber and rice seedling leaves and roots are differentially affected by salicylic acid. Plant Physiology
115: 571–576.
Klessig, D.F., Durner, J., Noad, R. et al. 2000. Nitric oxide and salicylic acid signaling in plant defense. Proceedings of the National Academy of Sciences USA 97: 8849–8855. Klich, M.A. 2002. Biogeography of Aspergillus species in soil
and litter. Mycologia94: 21–27.
Lamotte, O., Gould, K., Lecourieux, D., Sequiera-Legrand, A., Lebrun-Garcia, A., Durner, J. Pugin, A. and Wendehenne, D. 2004. Analysis of nitric oxide signaling functions in tobacco cells challenged by the elicitor cryptogein. Plant Physiology135: 1–14. Lee, K.P., Kim, C., Landgraf, F. and Apel, K. 2007. EXECUTER1-
and EXECUTER2-dependent transfer of stress-related signals from the plastid to the nucleus of Arabidopsis thaliana. Proceedings of the National Academy of Sciences USA 104 (24): 10270-5.
Mukherjee, S.P. and M.A. Choudhari. 1983. Implications of water stress induced changes in the levels of endogenous ascorbic acid and hydrogen peroxide in Vigna seedlings. Physiol Planta58: 116-170.
Murgia, I., Tarantino, D., Vannini, C., Bracale, M., Carrabvieri, S. and Soave, C. 2004. Arabidopsis thaliana plants over expressing thylakoidal ascorbate peroxidase show resistance to paraquat-induced photooxidative stress and to nitric oxide-induced cell death. Plant Journal
38: 940–995.
Nakano, Y., and Asada, K. 1981. Hydrogen peroxide is scavenged byascorbate-specific peroxidase in spinach chloroplasts. Plant Cell and Physiology22: 867–880. Neill, S.J., Desikan, R., Clarke, A., Hurst, R.D. and Hancock,
J.T. 2002. Hydrogen peroxide and nitric oxide as signalling molecules in plants. Journal of Experimental Botany53: 1237–1247
Nicholson, R.L. and Hammerschmidt, R. 1992. Phenolic compounds and their role in disease resistance. Annual Review of Phytopathology30: 369–389.
Nizamuddin, A. 1987. NADPH-dependent and O2- dependent lipid peroxidation. Biochemical Education15(2): 58–62.
Philosoph-Hadas, S., Meir, S. Akiri, B. and Kanner, J. 1994. Oxidative defense systems in leaves of three edible herb species in relation to their senescence rates. Journal of Agriculture and Food Chemistry42(11): 2376–2381. Planchet, E., Gupta, K.J., Sonoda, M. and Kaiser, W.M. 2005.
Nitric oxide emission from tobacco leaves and cell suspensions: Rate limiting factors and evidence for the involvement of mitochondrial electron transport. Plant Journal41: 732-743.
Radi, R., Cassina, A. and Hodara, R. 2005. Nitric oxide and peroxynitrite interactions with mitochondria. Biological Chemistry383: 401–409.
Shoresh, M. and Harman, G.E. 2008. The molecular basis of shoot responses of maize seedlings to Trichoderma harzianum T22 inoculation of the root: a proteomic approach. Plant Physiology147: 2147–2163.
Stöhr, C., Strube Marx, F. G., Ullrich, W.R. and Rockel, P. 2001. A plasma membrane-bound enzyme of tobacco roots catalyses the formation of nitric oxide from nitrite. Planta212: 835–841.
Thordal-Christensen, H., Zhang, Z., Wei, Y. and Collinge, D.B. 1997. Subcellular localization of H2O2 in plants. H2O2 accumulation in papillae and hypersensitive response during the barley-powdery mildew interaction. Plant Journal11: 1187–1194.
Vacca, R.A., de Pinto, M.C., Valenti, D., Passerella, S., Marra, E. and De Gara, L. 2004. Reactive oxygen species production, impairment of glucose oxidation and cytosolic ascorbate peroxidase are early events in heat-shock induced programmed cell death in tobacco BY-2 cells. Plant Physiology134: 1100–1112.
Wen, P.F., Chen, J.Y. Kong, W.F., Pan, Q.H., Wan, S.B. and Huang, W.D. 2005. Salicylic acid induced the expression of phenylalanine ammonia-lyase gene in grape berry. Plant Science169: 928–934.
Wendehenne D., Durner, J. and Klessig, D. 2004. Nitric oxide: a new player in plant signaling and defence responses. Current Opinion in Plant Biology7: 1–14.
Williams, R., Rohr, A.M., Wang, W.T., Choi, I.Y., Lee, P., Berman, N.E.J., Lynch, S.G. and Levine, S.M. 2011. Iron deposition is independent of cellular inflammation in a cerebral model of multiple sclerosis. BMC Neuroscience
12: 59.
Wojtaszek, P. 1997. Oxidative burst: an early plant response to pathogen infection. Journal of Biochemistry322: 681–692. Wolfe, K., Wu, X. and Liu, R.H. 2003. Antioxidant activity of
apple peels. Journal of Agricultural and Food Chemistry