Organized by C.O.E.T, Akola & IWWA, Amravati Center. Available Online at www.ijpret.com40
INTERNATIONAL JOURNAL OF PURE AND
APPLIED RESEARCH IN ENGINEERING AND
TECHNOLOGY
A PATH FOR HORIZING YOUR INNOVATIVE WORK
SPECIAL ISSUE FOR
NATIONAL LEVEL CONFERENCE
"SUSTAINABLE TECHNOLOGIES IN
CIVIL ENGINEERING"
MODAL PUSHOVER ANALYSIS TO ESTIMATE THE SEISMIC DEMAND OF
VERTICALLY IRREGULAR STRUCTURES
ASHISH AKHARE1, SNEHA BHENDE2
1. Assistant Professor, Applied Mechanics Department, Government College of Engineering Amravati, Amravati, Maharashtra, India. 2. P. G. Student, Applied Mechanics Department, Government College of Engineering Amravati, Amravati, Maharashtra, India.
Accepted Date: 13/03/2015; Published Date: 01/04/2015
Abstract: In the present scenario many buildings have irregular configurations, this in future may subject to devastating earthquake. As the world move to the accomplishment of Performance Based Engineering philosophies in seismic design of civil engineering structures, new seismic design procédures require Structural Engineers to perform both static and dynamic analysis for the design of highrise structures. A performance based seismic analysis can be used for various purposes such as assessment of large structures, design verification of new construction, evaluation of an existing structures to identify damage states for various amplitudes of ground motions. Performance based seismic design is an elastic design methodology done on probable performance of building under different ground motions.In order to evaluate the seismic demand of building, a twenty storey irregular building was modeled in ETABS(Version 9.7) and the displacement demand of model have been obtained using Modal Pushover analysis. Performance and hinge formation pattern of irregular buildings without shear walls are studied and compared the results The performance of Modal Pushover Analysis (MPA) in predicting the inelastic seismic response of multistory high-rise building is investigated. Performance and hinge formation pattern of irregular buildings are studied. Nonlinear static pushover analysis of (G+19) RCC regular and irregular building had been done to obtain inelastic deformation capability.
Keywords: Performance Based Seismic Design, Modal pushover analysis, Seismic demand.
Corresponding Author: MR. ASHISH AKHARE
Co Author: MS. SNEHA BHENDE
Access Online On:
www.ijpret.com
How to Cite This Article:
Ashish Akhare, IJPRET, 2015; Volume 3 (8): 40-50
Organized by C.O.E.T, Akola & IWWA, Amravati Center. Available Online at www.ijpret.com41 INTRODUCTION
The performance based seismic design (PBSD) is to give a practical assessment of how a structure will perform when subjected to either particular or generalized earthquake ground motion. While the code design provides a pseudo-capacity to resist a prescribed lateral force, this force level is significantly less than that to which a building may be subjected during a postulated major earthquake. It is assumed that the structure will be able to withstand the major earthquake ground motion by components yielding into the inelastic range, engrossing energy and acting in a ductile manner as well as by multiplied of other actions and effects. Although the code required elastic detailing, it does not present a way to determine how the structure will actually perform under severe earthquake situation. This is the part of Performance Based Seismic Design. Pushover analysis is the tool used in performance based seismic design. A superior static procedure termed as modal pushover analysis (MPA), the MPA procedure assume the separation of modal responses for a building is still applicable in its elastic range. The seismic response of each mode is determined from pushing the structure to its modal target displacements with an invariant modal lateral forces distribution. In general building peak response is obtained by combining the seismic response of each mode per suitable modal grouping rule.
Organized by C.O.E.T, Akola & IWWA, Amravati Center. Available Online at www.ijpret.com42 reduce in story drift. The base model having the shape irregular to know the effects of mass irregularity on the shape of vertical geometric configuration of building compared the regular shape of building with four different types of irregularities. A.RHabibi and K.Asadi [6]evaluated the seismic performance of reinforced concrete moment resisting frames with setback based on Iranian code, results shows that when setback occurs in elevation the requirement of life safety level are not fulfilled. The elements near the setbacks experience the maximum damage. Therefore it is essential to make stronger these elements by proper method to satisfy the life safety. A.R.Akhare and S.S.Bhende [7] studied the seismic performance of setback structures by pushover analysis and concluded that, due to higher modes effects setback buildings needs advanced non linear static pushover analysis i.e. modal pushover analysis. This is because, if number of storey increases, the higher mode effects will become important part in analysis.
Objective of the study to Obtained the Seismic performance of regular and irregular buildings located in severe earthquake zone(v) of India and to identify the most vulnerable building among them and to compare the results of MPA.
1. Modal Pushover Analysis
Modal Pushover Analysis (MPA), developed by chopra and Goel (2002), is an improved procedure to calculate target displacement. This procedure is developed based on the differential equations governing the response of a multi-storey building subjected to an
earthquake ground motion with acceleration, :
(1)
Where, { } is the floor displacement relative to the ground, [m], [c], and [k] are the mass
classical damping and lateral stiffness matrices of the system. The right side of above equation (Eq. 1) can be interpreted as the effective earthquake force vector:
(2)
Thus, the height wise distribution of these forces can be defined by And their time
variation by .This force distribution can be expanded as a combination of modal
contributions :
Organized by C.O.E.T, Akola & IWWA, Amravati Center. Available Online at www.ijpret.com43
Where, is the nth mode of structure an N is the number of modes to be considered. The
modal pushover analysis method recommends to carryout pushover analysis separately for first few modes satisfying response spectrum using load pattern as given in above equation (Eq. 3).
By utilizing the orthogonality property and decoupling of modes the solution of the differential equation (Eq. 1) can be written as:
(4)
Where, is the modal coordinate, is modal participation factor of the nth mode and
is governed by the equation of motion for a SDOF system, with nth mode natural frequency
and damping ratio subjected to :
(5)
Now, the displacement at the roof due to nth mode can be expressed as:
(6)
Where, is the value of the nth mode shape at the roof level.
The peak value of the roof displacement due to nth mode can be expressed as:
(7)
Where, , the peak value of can be determined by solving equation (Eq.5) or from the
inelastic response spectrum. is the target displacement of the building at the roof due to
nth mode. The peak modal responses from all the modes considered are combined to
appropriate modal combination rule such as SRSS, CQC, etc. However, it seems reasonable because it provides results for elastic buildings that are identical to the well known RSA procedure. The lateral force distribution (Eq. 3) and target displacement (Eq. 7) suggested for modal pushover analysis possesses two properties: (a) it keeps the invariant distribution of forces and (b) it provides the exact modal response for elastic systems. The steps in MPA procedure to estimate target displacement of a multi-storeyed building are summarized as below:
i.Compute the natural frequencies and modes shapes for linear elastic vibration of the
Organized by C.O.E.T, Akola & IWWA, Amravati Center. Available Online at www.ijpret.com44
ii. For the nth mode, develop the base shear versus roof displacement curve i.e. pushover curve
for force distribution, or .
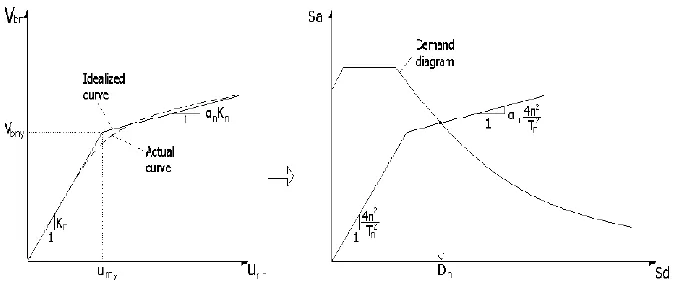
iii.Idealise the pushover curve as a bilinear curve. Convert the idealized base shear versus roof
displacement curve for the multi storeyed building to force displacement relation for nth mode inelastic SDOF system using the following relations:
and (8)
Where, and are the force and displacement for equivalent SDOF system
corresponding on the mode.
and are base shear and roof displacement obtained from pushover analysis with nth
mode shape as lateral load pattern. The purpose of this step is to obtain the properties of nth mode equivalent inelastic SDOF system.
iv.Compute the peak deformation of nth mode inelastic equivalent SDOF system defined in
the previous step, either design spectrum or from the empirical equations.
v. Calculate the peak roof displacement associated with nth mode using the relation
(9)
vi. Repeat the process for as many modes required for sufficient accuracy.
vii. Determine the total response by combining the peak modal responses using SRSS
combinations rule.
Organized by C.O.E.T, Akola & IWWA, Amravati Center. Available Online at www.ijpret.com45 Figure 1. Idealized Pushover Curve of the nth Mode of the MDOF System and Corresponding
Capacity Curve for the nth Mode of the Equivalent Inelastic SDOF System.
2. Analytical Investigation
2.1Building Geometry
At present work regular and vertically irregular (G+19) multi-story buildings are modeled using ETABS(Version 9.7), having 4 bays in both directions and storey’s on the ground storey having 4 m storey height and the bay width is 3.5m and Modal pushover analysis is carried out to check out the results. M-25 grade of concrete and Fe-415 grade of reinforcing steel are used for all members of the building. Building is located in seismic zone V, Zone factor 0.36,Response spectra =As per IS 1893:2002(part1) 5% damping, Importance factor=1, Size of all columns upto
bottom 5th story 1200mmx1200mm, over 5th story up to 10th story 1000mmx1000mm, over 10th
story upto 20th story 750mmx750mm. Size of beam =250mm×500mm longitudinal beam and
transverse beam respectively. Imposed load 3 KN/m2, Depth of slab =150mm, Modeling of the
Organized by C.O.E.T, Akola & IWWA, Amravati Center. Available Online at www.ijpret.com46 described in FEMA 356. From structural analysis program, ETABs (Version 9.7) 3D Computer models of regular building and irregular building is as below:
Figure 2. 3D View and Elevation of Regular 20 story Building Modeling in ETABS
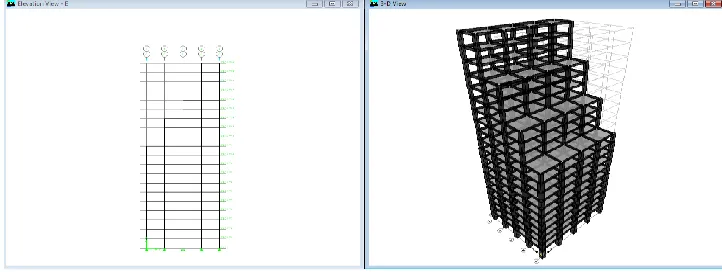
Figure 3: 3D View and Elevation of Irregular 20 story Building Modeling in ETABS
3. performance Analysis
4.1. Pushover Curves
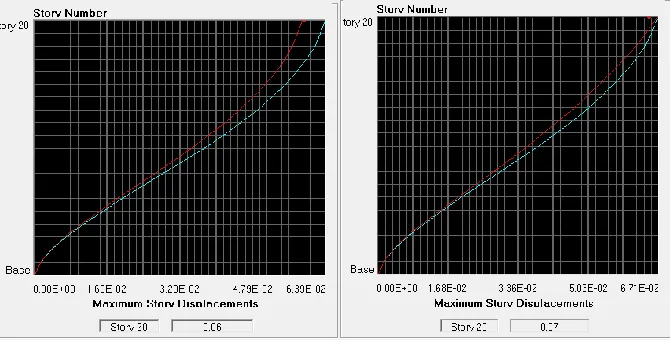
Analysis of (G+19) storied frame Model, regular and vertically irregular has been done using ETABS (Version 9.7) from the analysis following results are obtained. Modal Pushover analysis results from Model frame indicates analyzed structure in ETABS (Version 9.7) the graph shows the performance point which is intersection of capacity curve and demand curve. From the
graph, it is clear that maximun story displacement changes as the vertical irregularity changes,
Organized by C.O.E.T, Akola & IWWA, Amravati Center. Available Online at www.ijpret.com47 Figure 4. Maximum Story shears Plot for 20 story regular and irregular buildings.
Figure 5. Maximum Story drift Plot for 20 story regular and irregular buildings.
Organized by C.O.E.T, Akola & IWWA, Amravati Center. Available Online at www.ijpret.com48 4.2 Demand capacity curve
The resulting demand- capacity curve for the regular building and irregular building are shown in Fig. 7. From the following curve the performance point i.e. the point at which capacity curve and demand curve intersects is at performance level of Life safety and collapse prevention.
Figure 7 Performance Point for 20 story regular and irregular buildings
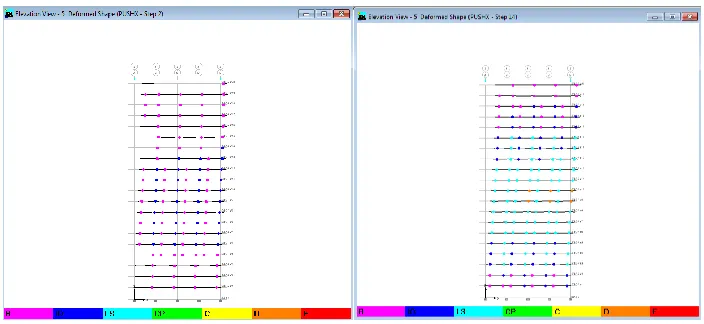
4.1.3 Plastic Hinge Mechanism
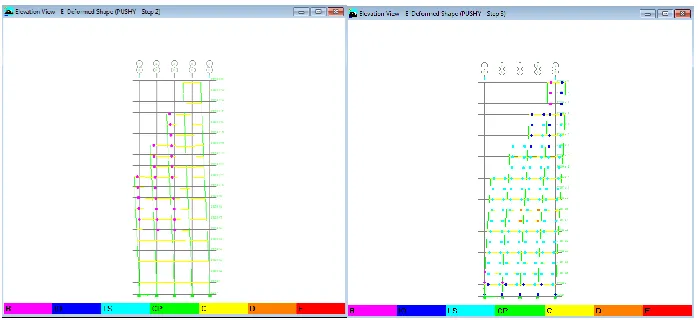
From Modal pushover analysis where in performance levels and location of plastic hinges are observed in regular and irregular building models, it has been observed that, on subsequent push to building, hinges started forming in beams first. Initially hinges were in B-IO stage and subsequently proceeding to IO-LS and LS-CP stage. The hinging patterns are plotted in Fig. 8 for regular building and Fig. 9 for irregular building respectively.
Organized by C.O.E.T, Akola & IWWA, Amravati Center. Available Online at www.ijpret.com49 Figure 9 Plastic hinge pattern formation for (G+19) storey irregular building at step 2, step 3
5. CONCLUSION
In this work, Performance based seismic design of a (G+19) storey regular and irregular building has been done by evaluating their performance using Modal pushover analysis. From the performed analysis, it is concluded that,
1)The higher modes significantly contribute to the response quantities of vertically irregular
structures. Also conventional pushover analysis seems to be underestimating the response quantities in the top most floors of the irregular frames.
2)The maximum and minimum values of story shear of regular building was 2507.57 at base
and 327.07 at top, while for irregular building it decreases to 2349.92 kN at base and 166.48 kN at top. As the percentage of vertical irregularity increases the maximum story drift increases.
3)Initially maximum story displacement was 0.06m for regular building further it changes to
0.07m for irregular building
4)The structure with vertical irregularity is more critical than a structure with plan irregularity,
the MPA procedure introduced was found to yield better results when the level of earthquake excitation was increased and more inelastically developed in the structure.
5)The results obtained in terms of pushover demand, capacity spectrum and plastic hinges
Organized by C.O.E.T, Akola & IWWA, Amravati Center. Available Online at www.ijpret.com50 REFERENCES
1. Goel, R.K. and Chopra A. K. (1997) Period formulas for moment resisting frame buildings.
ASCE. 123(11), 1454-1461.
2. Chopra, A.K. and Goel, R. K. (2002). A modal pushover analysis procedure for estimating
seismic demands for buildings. Earthquake Engineering and Structural Dynamics 31, 561-582.
3. Chopra A.K and Chintanapakdee .C.”Evaluation of Modal Pushover Analysis Using Irregular
Frame” paper no.2139, 2004 ASCE.
4. Kumar Anil and Gupta Ashok K, Study of Response of Structural Irregular Building Frames to
Seismic Excitations, International Journal of Civil, Structural, Environmental and Infrastructure Engineering Research and Development (IJCSEIERD), ISSN 2249-6866 Vol.2, Issue 2 (2012) 25-31
5. Mohommed Anwaruddin Md. Et al.(2013)”Pushover Analysis of Medium Rise Muli-Story
RCC Frame With and Without vertical Irregularity ”, International Journal of Engineering Research and Applications, Vol.3, Issue 5, pp 540-546.ssss
6. A. R. Habibi and K. Asadi (2013)”Seismic performance of reinforced concrete moment
resisting frames with setback based on Iranian seismic code”, International Journal of Civil Engineering, Vol. 12, No.1,41-54.
7. A. R. Akhare and S. S. Bhende (2014)” Seismic Performance Evaluation of Setback Structures