3649
UV SPECTROPHOTOMETRIC METHOD DEVELOPMENT AND VALIDATION
FOR ESTIMATION OF ETODOLAC IN BULK
Samson Israel*, N. Anusha, K. Hari Krishna
Department of Pharmaceutical Analysis, St. Ann’s College of Pharmacy,
Vetapalem Mandal,
Chirala-523155,
Prakasam District, Andhra Pradesh.
*Corresponding author E-Mail:
[email protected]ARTICLE INFO
ABSTRACT
Key words
:Etodolac ,
UV Spectrophotometer, Cuvettes,
Sandell’s sensivitity, Molar Absopitivity
Sample, cost effective, accurate, precise and rapid UV Spectrophotometric method was developed for the estimation of etodolac in pure form. Absorbance maximum of etodolac was estimated at 279.5 nm in methanol and water (1:9V/V).The recovery studies ascertained the accuracy of the proposed method and the results were validated as per ICH guidelines. The drug exhibited the linearity in the concentration range of 10-60µg/ml with correlation coefficient of R2 0.999.The % recovery of the drug for the
proposed method was found to be 100.6% . The limit of detection (LOD) and limit of quantification (LOQ) were found to be 0.21µg/ml and 0.65µg/ml respectively. The apparent molar absorptivity and sandll’s sensitivity were found to be 2.16 mol-1cm-1 and 0.143µg/cm2 respectively.
INTRODUCTION:
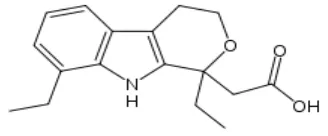
Etodolac is chemically 2-{1,8-diethyl-1,h,3h,4h,9h-pyrano[3,4b]indol-1-yl}acetic acid. it is non steroidal anti inflammatory drug used for the management of mild to moderate pain, fever, and inflammation. it is licensed for the treatment of inflammation and pain caused by osteoarthritis and rheumatoid arthritis. etodolac blocks the cyclo-oxygenase enzyme (cox) which form prostanoids, it lower the concentration of prostaglandins. which results in inflammation , pain fever are reduced. etodolac is generally avoided during
pregnancy and nursing methods. nasid’s may
cause adverse cardiovascular effects in foetus during pregnancy. . a survey of the literature reveals that there is no method available for the determination of etd in pure form and pharmaceutical formulations by oxidation-reduction reactions. a survey of the literature reveals that there are very few reported methods for the determination of etd in biological fluids, pharmaceutical formulations
and in presence of its enantiomer. the aim of the present study was to develop a simple , accurate and validated uv spectrophotometric method for etodolac.
Fig 1: Structure of Etodolac
MATERIALS AND METHODS
Elico SL-159, UV-Visible spectrophotometer with matched cuvettes were used for the estimation. Ultrasonicator and electronic balance (Wensar ISO 9001-2000 certified) used for the experiment. Glass ware and filter paper (Whatmann No: 1) were used for the experiment.
3650 Methodology:
Selection of solvent
The solubility of etodolac was determained in various solvent as pharmacopeia standard. Solubility test was carried out in different solvent like distilled water, methanol, chloroform, dimethyl sulfoxide and aqueous polyethylene glycol. From the solubility studies it was found that Etodolac was soluble in methanol and distilled water (1:9).
PREPARATION OF STANDARD SAMPLE:
The standard stock solution of etodolac was prepared by transferring accurately weighed 30mg of drug to 50ml volumetric flask and dissolving it with water and methanol (1:9) to get a concentration of 3000μg/ml. The solution was diluted accordingly to a concentration of 300μg/ml and was kept as the stock solution. The prepared stock solution was diluted with water and methanol to get working standard solutions of concentration 10-70μg/ml.
Determination of λ max:
The standard solution of etodolac (30μg/ml) was scanned in the wavelength region of 190 to 370 nm and the spectrum was recorded. Solvent methanol and water (1:9) was used as blank. It was observed that λ max was to be 279.5 nm by plotting a graph between absorbance vs.wavelength.
VALIDATION:
The objective of method validation is to demonstrate from the method is suitable for its intended purpose. The method was validated for linearity, precision, accuracy, LOD, LOQ, molar absorptivity and sandell’s sensitivity as per ICH guidelines.
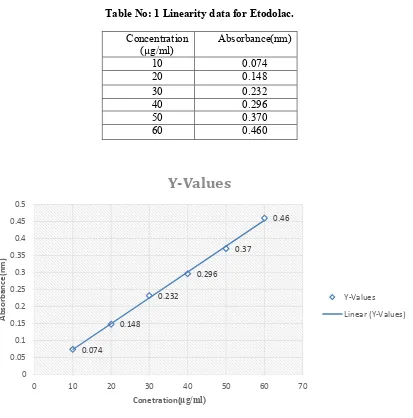
LINEARITY:
The sandared stock solution, the various dilutions in the conc. Of 10µg/ml, 20µg/ml, 30µg/ml, 40µg/ml, 50µg/ml &60µg/ml were prepared. The solution was scanned at 279.5nm and absorbance was recorded.
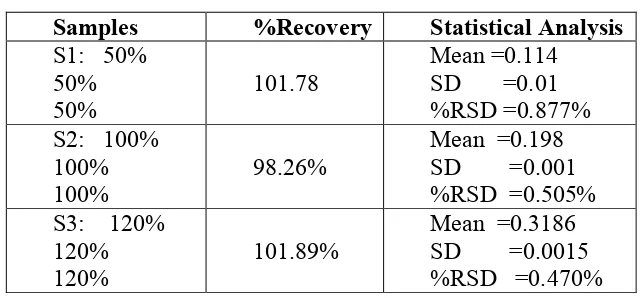
ACCURACY:
The accuracy of the proposed method was tested by recovery studies at 80%, 100% and 120% according to ICH guidelines by adding a known amount of pure drug to the
pre-analysed formulation of concentration 15μg/ml. from above solution the mean was calculated according to the formula. From the
mean, the standard deviation was calculated. The Mean value = The sum of the
absorbance/total absorbance
The Standard deviation Value =
From standard deviation percent relative standard deviation was also calculated.
%RSD=SD/MEAN*100
The % recovery also calculated according to the below formula.
%Recovery=Amount formula/Amount found*100 PRECISION:
Precision was calculated by preparing six solutions of same concentration which is the middle concentration level among the linearity range mean, S.D was calculated for these 6 concentrations. The precision value was found to be 1.014%, which was found to be with in limits i.e < 2 .
Methanol and Water (1:9) was taken as blank and 6 readings were recorded at wavelength of 279.5nm then LOD, LOQ was calculated by following formula.
Limit of detection (LOD) = 3.3×SD\S Limit of quantification (LOQ) = 10×SD\S LOD of ETODOLAC = 0.212
LOQ of ETODOLAC = 0.657 SANDELL’S SENSIVITITY:
3651 Fig 2: Absorption maximum of Etodolac by UV-Spectrophotometer
Table No: 1 Linearity data for Etodolac.
Concentration
(µg/ml) Absorbance(nm)
10 0.074
20 0.148
30 0.232
40 0.296
50 0.370
60 0.460
Fig 3: Linearity plot of Etodolac
00.05 0.1 0.15 0.2 0.25 0.3
0 100 200 300 400
A
b
so
rb
an
ce
Wavelength
absorbance
0.074
0.148
0.232
0.296
0.37
0.46
0 0.05 0.1 0.15 0.2 0.25 0.3 0.35 0.4 0.45 0.5
0 10 20 30 40 50 60 70
Ab
so
rb
an
ce
(n
m)
Conetration(µg/ml)
Y-Values
Y-Values
3652
Table no 2: ACCURACY DATA
Samples
%Recovery
Statistical Analysis
S1: 50%
50%
50%
101.78
Mean =0.114
SD =0.01
%RSD =0.877%
S2: 100%
100%
100%
98.26%
Mean =0.198
SD =0.001
%RSD =0.505%
S3: 120%
120%
120%
101.89%
Mean =0.3186
SD =0.0015
%RSD =0.470%
Table No 3: Precession Data
Concentration
Absorbance
Amount present
Statistical Analysis
30
30
30
30
30
30
0.135
0.137
0.135
0.134
0.134
0.133
10.0036
10.0310
10.0036
10.0310
10.0036
10.0588
Mean=0.134667
SD =0.001366
%RSD=1.014%
Table No: 3 Sandell’s Sensitivity Data
Sandell’s Sensitivity (л) = Conc. (µg/100 ml) x 0.001/D
1.S.no
Concentration(µg/ml)absorbance
Sensivity
Mean sensivity
1
2
3
4
5
6
10
20
30
40
50
60
0.074
0.148
0.232
0.296
0.37
0.46
0.144
0.139
0.131
0.137
0.161
0.146
0.143
MOLAR ABSORPITIVITY:
Molar Absorpitivity was calculated by using the following formula.
𝑠𝑙𝑜𝑝𝑒
𝑝𝑎𝑡ℎ 𝑙𝑒𝑛𝑔𝑡ℎ
⁄ ,
Where slope = log (y2_y1/x2_x1)
Slope/path length =2.16/1 =2.16 mol-1cm-1
Where slope is taken from the linearity plot, where X1 =0.232, X2 =0.37, Y1 =30, Y2 =50and
path length is taken as the cuvetts width i.e.. 1 cm.
RESULTS AND DISCUSSION:
The method developed and valied as per ICH guidelines. The method was validated in terms of linearity, precision, accuracy, LOD, LOQ, sandell’s sensitivity and molar absorpitity. Detection wavelength was selectedat 279.5 nm linearity in response was observed in 10-60µg/ml having R2=0.999. (R2
3653
sensitivity of the method. The sandell’s sensitivity for the developed method was found to be 0.143 and the moler asorpitivity was found to be 2.16 mol-1cm-1.
CONCLUSION:
A validation UV spectrophotometric method has been developed for the estimation of etodolac in bulk as well as pharmaceutical dosage form.In this proposed method the linearity was observed in the concentration range of 10-60µg/ml with correlation coefficient R2 =0.99 for ETODOLAC at 279.5
nm. The developed was found to be simple, accurate, precise, specific, reprodouicible and linear over the concentration range studies. The proposed method can be used for routine analysis of etodolac. The method was validated as per ICH guidelines.
ACKNOWLEDEGMENT:
We express thankfulness to our respected guide, Dr. Samson Israel. Department of pharmaceutical analysis, St.Ann’s College of Pharmacy, for his guidance and extending his support and when needed. Our sincere thanks to the Management of St.Ann’s college of pharmacy, Chirala for providing excellent facilities and enabling us to the work of this magnitude. It gives us immense pleasure to thank our beloved principal, Dr.V.V.Nageswara Rao for providing all the facilities and extending his cooperation whenever required. We are very thankful to Mr. Srinivas Rao, we also submit our sincere thanks to Mr. Vinay kumar for their timely help and suggestions.
REFERENCES:
1. Omud home Ogbru,. "etodolac,
Lodine (Discontinued): Drug Facts,
Side Effects and
Dosing". MedicineNet.
2. Gouda: Spectrophotometric and spectrofluorimetric methods for the determination of non-steroidal anti-inflammatory drugs, A review. Arabian Journal of Chemistry, 2011; Article in press
3. Garcia JB, Saraiva MLMFS and Lima JLFC: Determination and antioxidant activity evaluation of etodolac, an anti-inflammatory drug, by sequential
injection analysis. Analytica Chimica Acta 2006; 573: 371-375.
4. Strickmann: Isolation of an unknown metabolite of the non-steroidal anti-inflammatory drug etodolac and its identification as 5-hydroxy etodolac. Journal of Pharmaceutical and Biomedical Analysis. 2001; 25: 977-984.
5. Yılmaz S: Anodic oxidation of etodolac and its square wave and differential pulse voltammetric determination in pharmaceuticals and human serum. Talanta 2001; 54: 351-360.
6. Dogrukol-Ak D: Capillary electrophoretic method for the determination of etodolac in pharmaceutical tablet formulation. Journal of Liquid Chromatography & Related Technologies 2001; 24: 773-780.
7. Dung: Determination of enantiometric Impurity of etodolac by capillary electrophoresis using (2-Hyrdoxypropyl)-β-cylclodextrin. Archives of Pharmacal Research 2008; 31: 1218-1223.
8. De Pablos: Separation of etodolac enantiomers by capillary electrophoresis, validation and application of the chiral method to the analysis of commercial formulations. Electrophoresis 2005; 26: 1106-1113. 9. Pharmaceutical formulations and
human samples: HPTLC vs HPLC. Indian Drugs 1999; 36: 115-118. 10. Sane RT: High-performance thin-layer
chromatographic determination of etodolac in pharmaceutical preparations. Journal of Planar Chromatography-Modern TLC 1998; 11: 211-213.
11. Saleh OA: Development and validation of stability-indicating high performance liquid chromatographic (HPLC) and DD1-spectrophotometric assays for etodolac in bulk form and in pharmaceutical dosage form.Journal of Liquid Chromatography & Related Technologies 2009; 32: 2584-2599. 12. Pirkle WH and Murray PG: The
3654 anilide derivatives using a chiral
stationary phase. Journal of Liquid Chromatography 1990; 13: 2123-2134.
13. Caccamese S: Direct high-performance liquid chromatography (HPLC) separation of etodolac enantiomers using chiral stationary phases. Chirality 1992; 5. 164-167. 14. Lee YJ, Padula J and Lee H-K:
Kinetics and mechanisms of etodolac degradation in aqueous solutions. Journal of Pharmaceutical Sciences 1988; 77: 81-86.
15. Patel MJ, Badmanaban R and Patel CN: Reversed phase-high performance liquid chromatographic method for simultaneous estimation of tolperisone hydrochloride and etodolac in a combined fixed dose oral formulations. Pharmaceutical Methods 2011; 2: 124-129.
16. Ammar A and Surmann P: Improvement of etodolac purity test by reversed phase high-performance liquid chromatography. Die Pharmazie 2008; 12: 913- 914.
17. Ficarra R, Ficarra P, Calabro ML and Costantino D: Quantitative high-performance liquid chromatographic determination of etodolac in pharmaceutical formulations. Farmaco 1991; 46: 403–407. The United States Pharmacopeia XXVII The United States Pharmacopoeial Convention, Inc., Rockville, MD, 2004; pp 770-772.
18. European Pharmacopoeia, 4th Ed., Council of Europe, Strasburg, France, 2002; pp 1153-1155.
19. British Pharmacopoeia, Her Majesty’s Stationery Office, London, UK, 2001; pp 690-692, 2069-2070.
20. Pharco Pharmaceuticals personal communications, February 2004 21. El Kousy NM: Spectrophotometric
and spectrofluorimetric determination of etodolac and aceclofenac. Journal of Pharmaceutical and Biomedical Analysis 1999; 20: 185-194.
22. Gouda AA, Hassan WS. Spectrophotometric determination of etodolac in pure form and pharmaceutical formulations.
Chemistry Central Journal 2008; 2: 1-8.
23. Hu Q, Li Y, Yang X, Wei Q and Huang Z: Study on spectrophotometric determination of etodolac. Chemistry Journal on Internet 2008; 10: 31-33. 24. Ye Y, Yinke L and Huang Y:
Spectrophotometric determination of etodolac. Asian Journal of Chemistry 2009; 21: 649-654.
25. Duymus H, Arslan M,
Kucukislamoglu M and Zengin M: Charge transfer complex studies between some non-steroidal anti-inflammatory drugs and π-electron acceptors. Spectrochimica Acta A 2006; 65: 1120–1124.
26. Amer SM, El-Saharty YS, Metwally FH and Younes : Spectrophotometric study of etodolac complexes with copper (II) and iron (III). Journal of AOAC International 2005; 88: 1637-1643.
27. Validation of analytical procedures, Proceedings of the International Conference on Harmonization (ICH). Commission of the European Communities, (1996). Maslov LG, Evtushenko NS and Schavlınskıı AN: Structure of chemical compounds, methods of analysis and process control. Pharmaceutical Chemistry Journal 1998; 32: 217-225.
28. British Pharmacopiea. 2004
29. Becker SU, Blaschke G: Evaluation of the stereoselective metabolism of the chiral analgesic drug etodolac by high-performance liquid chromatography. J Chromatogr. 1993, 621: 199-207. 30. Wright MR, Jamali F: Limited extent
of stereochemical conversion of chiral non-steroidal anti-inflammatory drugs induced by derivatization methods employing ethyl chloroformate. J Chromatogr. 1993, 616: 59-65. 31. Jamali F, Application of a
stereospecific high-performance liquid chromatography assay to a pharmacokinetic study of etodolac enantiomers in humans. J Pharm Sci. 1988, 77: 963-966.
3655 pharmaceutical formulations.
Farmaco. 1991, 46: 403-407
33. Singh NN, Jamali F, Pasutto FM, Coutts RT, Russell AS: Stereoselective gas chromatographic analysis of etodolac enantiomers in human plasma and urine. J Chromatogr. 1986, 382: 331-337. 34. Giachetti C, Gas
chromatography-mass spectrometry determination of etodolac in human plasma following single epicutaneous administration. Biomed Chromatogr. 1994, 8: 180- 35. Srinivas, Barbhaiya H: Gas
chromatographic determination of enantiomers as diastereomers following pre-column derivatization and applications to pharmacokinetic studies: A review. Biomed Chromatogr. 1995, 9: 1-9.
36. El Kousy NM: Spectrophotometric and spectrofluorimetric determination of etodolac and aceclofenac. J Pharm Biomed Anal. 1999, 20: 185-194. 37. Duymus: Charge transfer complex
studies between some non-steroidal anti-inflammatory drugs and π -electron acceptors. Spectrochimica Acta Part A. 2006, 65: 1120-1124. 38. Amer SM, Spectrophotometric study
of etodolac complexes with copper (II) and iron (III). J AOAC Int. 2005, 88: 1637-1643.
39. Rahman N, Singh M, Hoda MN: Application of oxidants to the spectrophotometric determination of amlodipine besylate in pharmaceutical formulations. IL Farmaco. 2004, 59: 913-919.