http://dx.doi.org/10.19104/jfnd.2016.107
Open Access
Research Article
Journal of Food Nutrition and Dietetics
Poor Validity of Dietary Recall in Low-Income Hispanic Children using
Digital Food Imaging Analysis as the Reference
Trevino RP1*, Ravelo AV2, Senne-Duff B3, Murad M3, Diaz JF3 and Birkenfeld E4
1Social and Health Research Center, San Antonio, Texas, USA 2Promotion Llc, Miami, Florida, USA
3Department of Nutrition, University of the Incarnate Word, San Antonio, Texas, USA 4Data Management, Social and Health Research Center, San Antonio, Texas, USA
Abstract
Background: The prevalence of obesity among all U.S. children continues to increase but among Hispanic children the increase is more pronounced. With childhood obesity and technology on the rise, conventional methods of assessing dietary intake through memory recall might need to be complemented with newer technologies.
Objective: To test the sensitivity and specificity of self-reported dietary recall using Digital Food Imaging Analysis as the reference.
Design: The study was observational where a cohort of students was followed prospectively for three consecutive days.
Participants: Third and fourth grade students ages eight to nine years from six elementary schools of two school districts (n = 213) of which most were Hispanic and economically disadvantaged.
Main outcome measures: Three day, 24 hour dietary recalls were collected during three consecutive days of meals they consumed the day before. On the same day of the analysis two stationary Internet Protocol cameras were taking images of pre- and post-meals. In this study only school breakfast and lunch meals were analyzed.
Statistical analyses performed: This study used a 2 × 2 contingency table to analyze the dietary recall for specificity, sensitivity, positive predictive value (PPV), and negative predictive value (NPV). Sensitivity = TP/(TP +FN), Specificity = TN/(TN + FP), PPV = TP/(TP + FP), and NPV = TN/(TN + FN); where TP = true positive, TN = true negative, FP = false positive, and FN = false negative. These then were tested for mean, standard deviation and 95% confidence.
Results: The sensitivity, specificity, PPV and NPV for the three days of dietary recall were 56%, 35%, 64%, and 27% respectively.
Conclusions: This study showed that self-reported dietary recalls were inaccurate assessing dietary intake in Hispanic children, ages eight to nine years, living in economically disadvantaged households. Methods using new technologies such as digital photography to complement memory recall should be explored.
Keywords: Validity; 24 Hour Dietary Recalls; Low-Income; Hispanic children; Digital Photography
List of Abbreviations
SAHRC: Social and Health Research Center; DFIA: Food Imaging Analysis; NSLP: National School Breakfast and School Lunch Programs; ELL: English Language Learners; USDA: United States Department of Agriculture; IP: Internet Protocol; TP: True Positive; TN: True Negative; FP = False Positive; FN: False; BMI: Body Mass Index; IPSAS: Interactive Portion Size Assessment System; PPV: Positive Predictive Value; NPV: Negative Predictive Value.
Introduction
The prevalence of obesity, Body Mass Index (BMI) ≥ 95th
Received Date: March 11, 2016, Accepted Date: May 30, 2016, Published Date: June 8, 2016.
*Corresponding author: Roberto P. Trevino, Social and Health Research Center, San Antonio, Texas, USA, 78210, Tel: 210-533-8886; Fax: 210-533-4107; E-mail: [email protected]
percentile, among all U.S. children continues to increase but among Hispanic children the increase is more pronounced. The prevalence
of obesity among Hispanic children age 6-11 years was 23.4% in 1999-2000; 20.1% in 2001-2002; and 22.5% in 2003-2004 [1].
During the same time periods and with the same age groups, the
prevalence of obesity among non-Hispanic white children was 11.7%, 14.8% and 17.7%, respectively. A more recent study
(2011-2012) showed that the prevalence of obesity among Hispanic
and non-Hispanic white children the same age group was 26.1% and 13.1%, respectively [2]. Because of the relationship between
unhealthy behaviors and obesity, better tools are needed to detect unhealthy behaviors and to measure correlations between these and obesity when changes occur. Given that dietary intake is a key component of intervention for childhood obesity prevention;
studies are needed to assess the validity of self-reported dietary recalls in children most at-risk.
A systematic review of dietary intake instruments in children
showed that self-reported dietary recalls provide good quality
dietary intake as assessed by the standardized critical appraisal
tool from the American Dietetic Association [3]. But Social and
Health Research Center (SAHRC) investigators showed that this
was not the case with low-income Hispanic children [4]. They
conducted an evaluation of three day, 24 hour dietary recalls and
used an established prediction equation based on self-reported energy intake as a percentage of predicted energy requirement to identify under-, plausible-, and over-reporters. Only 39% of self-reported dietary recalls were assessed to be plausible-reporters.
Because the studies with positive results that were cited above did not include Hispanic children and to our knowledge there are no
other validity studies of self-reported dietary recalls in low-income
Hispanic children, the purpose of the present study was to evaluate this method in this particular population of children. The reference
used to assess self-reported dietary recalls was Digital Food Imaging Analysis (DFIA; patent pending). Consuming insufficient
amounts of minerals, consuming excessive amounts of calories,
and being vitamin deficient are disorders. Like mental health,
eating disorders, need to be diagnosed with valid instruments.
We considered the self-reported dietary recalls as the diagnostic instrument and DFIA as the “gold standard” to measure specifically sensitivity and specificity. DFIA uses digital photography to identify
food consumed. For this study only photographs of meals taken before and after being consumed were used as the reference to
evaluate the validity of self-reported dietary recalls.
Materials and Methods
Participating Schools
followed prospectively for three consecutive days. Dietary data was collected from third and fourth grade children from six elementary schools of two school districts in San Antonio, TX. The participating school districts are urban, inner city, and 92 percent of the students enrolled were Hispanic and 89 percent participated in the National School Breakfast and School Lunch Programs (NSLP). All third and fourth grade students, regardless of race and ethnicity, were invited to participate. English and Spanish consent forms were either sent to parents by mail or carried by students in a folder schools use to inform parents of school activities. In addition, several dates
were scheduled for face-to-face meetings with parents to explain
the study and the consent forms. Only children who returned written informed consent forms signed by their parent/guardian and who assented to the study participated in data collection. The recruitment was conducted and data collected during the fall of 2012. The Institutional Review Board of the University of Texas Health Science Center at San Antonio approved the study protocol.
Measures
Student and school characteristics were collected from the
school’s administrative offices, and from children and parents.
These included age, gender, and race/ethnicity, English Language Learners (ELL), and NSLP eligibility. ELL is students who are unable
to communicate fluently or learn effectively in English and NSLP
eligibility was used as a proxy for economic disadvantage.
Three day, 24-hour dietary recalls were collected during three
consecutive days according to the following schedule: Tuesday interview recorded what the child ate on Monday, Wednesday interview recorded what the child ate on Tuesday, and Thursday interview recorded what the child ate on Wednesday. The dietary intake data were all collected in the morning before breakfast on three different visits to the school so the child only had to recall one day’s food intake at a time. The dietary recalls were collected
in either English or Spanish from children individually and face-to-face by 12 trained bilingual interviewers. The interviewers,
undergraduate nutrition students, were trained by a registered
dietitian who had been certified through Nutrition Data System
for Research. An extensive two day training and a third day of
certification was required for all interviewers.
A multiple pass approach, modeled on the USDA method, was used to identify, describe, estimate serving size, and measure
consumption of food [5]. Four passes were used. Identification – The first pass began with the interviewer prompting the participant
using a script to recall food intake over the previous day. The interviewer wrote down each item with notations of times and
meal types (breakfast, lunch, dinner and snack); Describe – The second pass was used to describe each food item listed in the first
pass, particularly food preparation, branding, and cooking styles
used; Serving size (food volume); – The third pass was used to ask
the serving size or food portion size. In this phase, various types of visual aids and measuring devices (cups, spoons, ruler, and food models or pictures) were used to help guide the participants about
the amounts of each food item served; and Consumption – The fourth pass was used to quantify the amount of food consumed.
We approached self-reported dietary recalls as diagnostic tools to detect nutrition-related disorders and used the Digital
Food Imaging Analysis (DFIA) and school food service menus as the reference. The DFIA technology is being developed by SAHRC
with a grant from the USDA (award no. 2011: 67001-30071). This technology uses digital photography, image-processing software,
and the USDA National Nutrient Database for Standard Reference to identify food and nutritional value of food consumed. School food
service menus were further used to confirm the food identified
with the DFIA.
In addition to the undergraduate nutrition students stated above, there were two research assistants and one camera technician. The role of the research assistants was to observe students during meal times to document food brought from home and food exchanges that occurred during meals; the role of the technician was to snap
photographs of bar codes and meals (before-after) and review the quality of the visual images before being streamlined to SAHRC.
Consented children were given placards with bar codes that
identified them. The placard was placed as a necklace and when
the child went through the cameras they were instructed to place the placard under the camera so that the technician can snap photographs of the bar code and food that was served and food that was left over.
Two stationary Internet Protocol (IP) cameras (H.264) equipped with CCTV High-Definition lenses (Planet Technology, Taiwan) were
placed in the six participating elementary school cafeterias. One set was positioned above the cash register to represent school meal servings and another set was placed above the disposal window to capture food waste. The cameras were assigned with a static IP address to send live streaming video via the internet to SAHRC for storage and image processing. Photographs of food and beverages, before and after meals, were taken on the same day of the data analysis. The school food service menus of meals served during the dates of dietary collection were obtained from school food service administrators to validate the foods shown in the photographs.
Data Analysis
Because of the controlled environment in schools, where research staff managed the operation of the DFIA technology and school food service administrators provided menus; and because of the unknown compliance of parents to follow the DFIA protocol at
home - only school breakfast and lunch were used for this analysis. Sensitivity, specificity, Positive Predictive Value (PPV), and
Negative Predictive Value (NPV) were calculated as follows:
Sensitivity = TP/(TP + FN), Specificity = TN/(TN + FP), PPV = TP/
(TP + FP), and NPV = TN/(TN + FN); where TP = True Positive, TN = True Negative, FP = False Positive, and FN = False. TP was considered if the child reported consuming the food in the dietary recall and the food was observed in the before and not in the after photograph (reported and consumed); FP if the child reported consuming a food in the dietary recall but it was not observed in the before photograph or it was observed in the before and after photographs (reported but not consumed); TN if the child did not report consuming a food in the dietary recall and the food was not observed in the before photograph or observed in the before and after photographs (not reported and not consumed); and FN if the child reported not consuming a food in the dietary recall but it was observed in the before and not in the after photograph (an item observed to have been eaten but not reported). PPV is, for any particular positive test result, what is the probability that it is a TP; and NPV is, for any particular negative test result, what is the probability that it is a TN. In this paper intrusion and omission were used interchangeably with FP and FN, respectively. Table 1 depicts
how sensitivity and specificity were assessed according to the
self-reported dietary recall and the before and after photographs of meals.
The frequencies for all the categories were analyzed in a 2 × 2
contingency table. The 2 × 2 table provided the estimated values for
prevalence, sensitivity, and specificity of the self-reported dietary recall method with its corresponding confidence interval. Moreover
answer and the probability for TN and FN (omission) for any negative answer.
The food items with higher counts for intrusion and omission
were stratified by breakfast and lunch and ranked one through ten. The ranking of their frequency shows a visual understanding
of which items are the best remembered and which are the most forgotten.
Results
Of a total of 1119 third and fourth grade students enrolled in the six elementary schools, 455 consented to participate in this study. Of these, 213 had complete dietary data. See Table 2 for participant characteristics. Children’s age was eight to nine years, most were Hispanic and economically disadvantaged and one fourth were ELL. When characteristics of participating students were compared
to non-participating students, age, race/ethnicity, economic
disadvantage and ELL were very similar except for gender (not shown). There were more girls (60%) in the participating group
than in the non-participating (50%).
The meals in the photographs correlated 100% with those
listed in school menus for each study day. The frequency values for
TP and intrusions; and TN and omissions for each day were plotted
in Figure 1. The graph shows that the higher frequencies were for omissions and TP and the lower frequencies for intrusions and TN values. These results reflect that children have a tendency to not
report food that they consumed.
Table 3 shows the frequencies of TP, FP, TN, and FN for each day. Sensitivity, specificity, PPV and NPV for each of the three days
are shown in Table 4. The results are almost identical for the three
days and the confidence interval is small, which indicates a high
precision of the analysis.
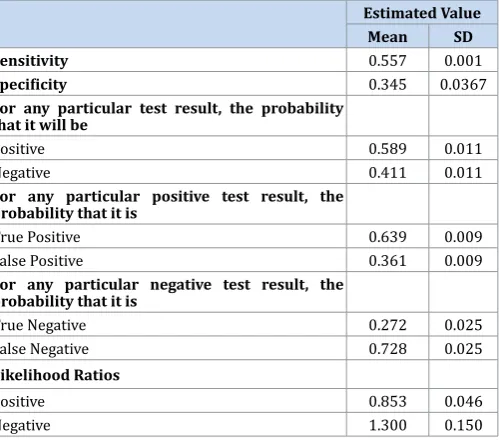
Because the self-reported dietary recalls were collected
for three days, we calculated the aggregate mean and standard
deviations for sensitivity and specificity (see Table 5). The results show small standard deviation values which reflect that sensitivity, specificity, TP, TN, omissions and intrusions and the likelihood ratios are very close to the mean value and the mean values were close to the values obtained each day. The positive and negative likelihood ratios of 0.85 and 1.3, respectively, were small and
question the utility of self-reported dietary recalls in low-income
Hispanic children.
There was an interest to determine if there were certain foods items that children reported as intrusions or omissions. Other than beverages commonly being falsely reported for breakfast, there
were no specific patterns in their reporting.
Discussion
The results of this study show the poor validity of self-reported dietary recalls in low-income school-aged Hispanic children. The sensitivity, specificity, positive predictive value and negative
predictive value for the three days of dietary recall were 56%, 35%, 64%, and 27% respectively. The sensitivity of 56% means that only
56% of what the children ate was reported. Our findings are not
surprising knowing the challenges of memory recall, the cognitive
Figure 1: Frequency values for True Positive, False Positive, True Negative, and False Negative by day
Dietary Recall DFIA1 Category
Before After
Food Consumed
Yes Yes No True Positive
Yes No - False Positive
Yes Yes Yes False Positive
No No - True Negative
No Yes Yes True Negative
No Yes No False Negative
Table 1: Categories according to how the children self-reported consumption in the dietary recall and the photographs taken before and after the meals. (1Digital food imaging analysis)
Total consented students 213
Third grade 105
Fourth grade 108
Boys 40%
Girls 60%
Age (mean ± SD) 8.69 ± 2.22
African American 2%
Hispanic 95%
Non-Hispanic White 2%
Other 1%
Economically Disadvantage 96%
English Language Learners 26%
Table 2: Third and fourth grade student characteristics.
Day 1
DFIA
Absent Present Total
Dietary
Recall Test PositiveTest Negative 422175 708564 1130739
Total 597 1272 1869
Day 2
DFIA
Absent Present Total
Dietary
Recall Test PositiveTest Negative 400234 728576 1128810
Total 634 1304 1938
Day 3
DFIA
Absent Present Total
Dietary
Recall Test PositiveTest Negative 399237 724578 1123815
Total 636 1302 1938
development of children, and purposely under-reporting or over-reporting to fit with social desirability or fear of negative evaluation. Baxter [6] summarized 12 diet-reporting methodological studies using 24-hour dietary recalls and observation of school
lunch and school breakfast of children nine to ten years of age. Accuracy was poor overall in children reporting their food intake.
Children improved in accuracy over three 24-hour dietary recalls
but individual accuracy was still inconsistent from one interview to
the next. Baranowski and colleagues [7] found a 17% intrusion rate
and a 30% omission rate with a dietitian administered interview for school lunch in fourth grade students.
The explanations for the inaccurate reporting in children are several. Children’s recall accuracy was related to their age, gender and BMI percentile. The percentage of accurate recall was higher in children in second grade (age six to seven years) compared to
first grade (age five to six years) of school [8]. Younger children
(ages Five to seven years) failed to report leftover food (77%) or
incompletely reported leftover food (10%) and 11% of children
reported phantom foods (intrusion). Garcia-Dominic et al [4]
reported that caloric intake in a cohort of mostly Mexican American children was negatively associated with BMI and percent body fat.
Baxter and colleagues [9] evaluated the effect of recency on accuracy of fourth-graders’ dietary reports. They found that
children’s dietary reporting accuracy highly depended on the interview time. Others have also found that when the time between the interview and the meal is prolonged, the rate of intrusions,
omissions, and temporal dating increases [6,9-11] Moreover, Arab and colleagues [12] found that children report less accurately when they report more than one meal. Thus, time and meal frequency are
factors that can affect the accuracy of the dietary recalls.
Other explanations given for inaccurate reporting is the type
and quantity of food consumed and cognitive ability. Memory
recall of meals is such that if an unusual meal is consumed from a daily routine it is more likely to be recalled with better accuracy
[13] and the difficulty children have estimating the amount of
food consumed compared to the amount served has also been
documented [14]. Lastly, a frequent explanation given to the inaccuracy is cognitive ability, which Smith and colleagues [15]
found was negatively correlated with omission rates (in girls and boys) and intrusion rates (in girls). Many studies, thus, have shown
the difficulty children have self-reporting dietary recalls.
But not all studies have shown the inaccuracy of dietary recalls in children. Swedish children six to eight years of age were able to
accurately recall their school lunch intake for one meal [16]. This finding suggested that children as young as six years of age may be
more able to report on dietary intake than previously reported, at least for one main meal at school. However, only one overweight child participated in the study and overweight children have been shown to under report energy intake to a larger degree than normal
weight subjects [17]. The findings of this study, therefore, should
not be generalized to larger more diverse populations.
Researchers [18] generally agree that children’s ability to recall
food eaten improves in children after Seven to eight years of age such that by the age of 12 years children can accurately recall previously
eaten food. But Rothausen and colleagues [19] found that 93% of
Seven to Eight year old children were acceptable recallers of energy
intake versus only 70% of 12-13 year old children.
Estimated Value 95% Confidence Interval
Day 1 Day 2 Day 3 Lower Limit Upper Limit
Sensitivity 0.557 0.558 0.556 0.529 0.584
Specificity 0.293 0.369 0.373 0.257 0.412
For any particular test result, the probability that it will be
Positive 0.605 0.582 0.579 0.557 0.627
Negative 0.395 0.418 0.421 0.373 0.443
For any particular positive test result, the probability that it is
True Positive 0.627 0.645 0.645 0.598 0.673
False Positive 0.373 0.355 0.355 0.327 0.402
For any particular negative test result, the probability that it is
True Negative 0.237 0.2889 0.291 0.207 0.324
False Negative 0.763 0.711 0.709 0.676 0.793
Likelihood Ratios
Positive 0.787 0.885 0.886 0.733 0.957
Negative 1.513 1.197 1.191 1.120 1.621
Table 4: Sensitivity, specificity, positive predictive values and negative predictive values for day one, two and three.
Estimated Value
Mean SD
Sensitivity 0.557 0.001
Specificity 0.345 0.0367
For any particular test result, the probability that it will be
Positive 0.589 0.011
Negative 0.411 0.011
For any particular positive test result, the probability that it is
True Positive 0.639 0.009
False Positive 0.361 0.009
For any particular negative test result, the probability that it is
True Negative 0.272 0.025
False Negative 0.728 0.025
Likelihood Ratios
Positive 0.853 0.046
Negative 1.300 0.150
Parent’s assistance with their child’s dietary recalls has been
highly recommended [14,18,20]. Burrows and colleagues [21] concluded that the 24-hour multiple pass recall conducted over
a three day period (including weekdays and weekend days) with parent assistance was the most accurate diet assessment method to measure energy intake in children ages four to eleven years when compared to doubly labeled water. Latino mothers, however, were only able to accurately recall 51% of portion sizes of food items
their children (four to seven years of age) consumed [22] Mothers
accuracy in reporting the number of food items also varied by food group with vegetables items having only 41% accuracy.
Parental assistance was not used for our study and it may not be
possible for studies interested in 24-hour dietary intake of children living in poverty. Most children from low-income households
participate in the NSLP and they have up to two meals a day during the week in schools. Parents are not present to observe and report
what their children consume. Hunsberger and colleagues [19] even found this with Swedish parents when questioned about
their children’s dietary intake. Parents had little knowledge of the
quantity or food items consumed at school.
As described above, most of the published research supports
the inaccuracy of children self-reporting dietary recall. Unless well
designed intake methods are aided with technology, dietary recalls
may not be of value [23]. The use of digital photography as visual aids to identify and quantify foods has been shown to improve accuracy of dietary intake in children [24]. Digital photography
methods such as DFIA might identify more accurately actual food consumed. Estimation of food weight was compared between DFIA and Nutrition Data System for Research software (NDSR; version
4.04). NDSR used 24-hour dietary recalls and DFIA used cameras to collect dietary data of children eight to nine years [25]. Three days of 24-hour dietary recalls were collected the following day
and photographs of foods, before and after consumption, were collected on the same day of the analysis. For reference meals were weighed with an electronic scale at the school cafeteria cash register and again at the disposal window to calculate the weight of food consumed. The Pearson’s correlation displayed a stronger correlation between DFIA and real weight (0.592) than NDSR and real weight (0.297).
Another digital photography method is the Interactive Portion Size Assessment System (IPSAS) which used food photographs
of child portions [14]. This method had higher agreement with actual weighed food intake than using 24-hour dietary recalls and
food models. Other studies have also shown the value of digital photography to assess dietary intake, either alone or in combination with dietary recalls, to improve the accuracy of dietary intake of
children [26,27].
A limitation of the present study is that the findings cannot be
generalized to the general population of children or even to other Hispanic children because the present study targeted a special
children population who are most at-risk—Hispanic children living in low-income households. Another limitation is that 25%
of the children were ELL and may have not related appropriate dietary information because of language barriers. All interviewers, however, were bilingual and the interviews were conducted in either English or Spanish or both. The third limitation may have
been that the interviewers identified incorrectly the foods in the
photographs. But school menus and recipes were made available
and all foods were verified using these records. A fourth limitation is that several interviewers were used to obtain self-report data.
There may have been interviewer bias in the data collected as no
single interviewer could have asked the respondents questions in
the same manner. To circumvent this bias interviewers underwent
an extensive two day training by a registered dietitian certified by
Nutrition Data System for Research and also underwent a third
day of certification. Lastly this study would have provided more
insight into the diagnostic accuracy of dietary recalls if the validity
would have been assessed by age, race/ethnicity, and
socio-economic status. Unfortunately this study included only third and fourth grade students and over 95% of them were minority and economically disadvantaged.
In conclusion Hispanic children living in poverty are most
at-risk and methods to conduct nutritional surveillance and to
evaluate nutrition programs are absolutely necessary. Common
tools used to assess diet are 24-hour dietary recalls. But this study showed that self-reported dietary recalls were inaccurate assessing dietary intake in very young Hispanic children from low-income
households. A more promising method is using technology such as digital photography to complement memory recall.
Acknowledgment
This material is based upon work that is supported by the National Institute of Food and Agriculture, U.S. Department of
Agriculture, under award number 2011: 67001-30071.
References
1. Ogden CL, Carroll MD, Curtin LR, McDowell MA, Tabak CJ, Flegal KM. Prevalence of overweight and obesity in the United States, 1999-2004. JAMA. 2006;295(13):1549-1555.
2. Ogden CL, Carroll MD, Kit BD, Flegal KM. Prevalence of childhood and adult obesity in the United States, 2011-2012. JAMA. 2014;311(8):806-14. doi: 10.1001/jama.202014;311(8):806-14.732.
3. Burrows T, Golley RK, Khambalia A, McNaughton SA, Magarey A, Rosenkranz RR, et al. The quality of dietary intake methodology and reporting in child and adolescent obesity intervention trials: a systematic review. Obes Rev. 2012;13(12):1125-38. doi: 10.1111/j.1467-789X.2012.01022.x.
4. Garcia-Dominic O, Wray LA, Ledikwe JH, Mitchell DC, Ventura AK, Hernandez AE, et al. Accuracy of self-reported energy intakes in low-income urban 4th grade minority children. Obesity (Silver Spring). 2010;18(11):2220-6. doi: 10.1038/oby.2010.144.
5. Moshfegh AJ, Rhodes DG, Baer DJ, Murayi T, Clemens JC, Rumpler WV, et al. The US Department of Agriculture Automated Multiple-Pass Method reduces bias in the collection of energy intakes. Am J Clin Nutr. 2008;88(2):324-32.
6. Baxter SD. Cognitive processes in children’s dietary recalls: insight from methodological studies. Eur J Clin Nutr. 2009;63 Suppl 1:S19-32. doi: 10.1038/ejcn.2008.61.
7. Baranowski T, Islam N, Baranowski J, Cullen KW, Myres D, Marsh T, et al. The food intake recording software system is valid among fourth-grade children. J Am Diet Assoc. 2002;102(3):380-5.
8. Warren JM, Henry CJ, Livingstone MB, Lightowler HJ, Bradshaw SM, Perwaiz S. How well do children aged 5-7 years recall food eaten at school lunch? Public Health Nutr. 2003;6(1):41-7.
9. Baxter SD, Smith AF, Litaker MS, Guinn CH, Shaffer NM, Baglio ML, et al. Recency affects reporting accuracy of children’s dietary recalls. Ann Epidemiol. 2004;14(6):385-90.
10. Baxter SD, Hardin JW, Guinn CH, Royer JA, Mackelprang AJ, Smith AF. Fourth-grade children’s dietary recall accuracy is influenced by retention interval (target period and interview time). J Am Diet Assoc. 2009;109(5):846-56. doi: 10.1016/j.jada.2009.02.015.
11. Baxter SD, Guinn CH, Royer JA, Hardin JW, Mackelprang AJ, Smith AF. Accuracy of children’s school-breakfast reports and school-lunch reports (in 24-h dietary recalls) differs by retention interval. Eur J Clin Nutr. 2009;63(12):1394-403. doi: 10.1038/ejcn.2009.107.
automated image-capture method to aid dietary recall. Eur J Clin Nutr. 2011;65(10):1156-62. doi: 10.1038/ejcn.2011.75.
13. Baxter SD, Hardin JW, Royer JA, Smith AF, Guinn CH. Sources of intrusions in children’s dietary recalls from a validation study of order prompts. J Health Psychol. 2008;13(8):1157-62. doi: 10.1177/1359105308095969. 14. Foster E, Matthews JN, Lloyd J, Marshall L, Mathers JC, Nelson M, et
al. Children’s estimates of food portion size: the development and evaluation of three portion size assessment tools for use with children. Br J Nutr. 2008;99(1):175-84.
15. Smith AF, Baxter SD, Hardin JW, Royer JA, Guinn CH. Some intrusions in dietary reports by fourth-grade children are based on specific memories: data from a validation study of the effect of interview modality. Nutr Res. 2008;28(9):600-8. doi: 10.1016/j.nutres.2008.04.003.
16. Hunsberger M, Pena P, Lissner L, Grafström L, Vanaelst B, Börnhorst C, et al. Validity of self-reported lunch recalls in Swedish school children aged 6-8 years. Nutr J. 2013;12:129. doi: 10.1186/1475-2891-12-129. 17. Champagne CM, Baker NB, DeLany JP, Harsha DW, Bray GA. Assessment
of energy intake underreporting by doubly labeled water and observations on reported nutrient intakes in children. J Am Diet Assoc. 1998;98(4):426-33.
18. Livingstone MB, Robson PJ, Wallace JM. Issues in dietary intake assessment of children and adolescents. Br J Nutr. 2004;92 Suppl 2:S213-22.
19. Rothausen BW, Matthiessen J, Groth MV, Brockhoff PB, Andersen LF, Trolle E. Comparison of estimated energy intake from 2×24-hour recalls and a seven-day food record with objective measurements of energy expenditure in children. Food Nutr Res. 2012;56. doi: 10.3402/fnr. v56i0.12221.
20. Knuiman JT, Rasanen L, Ahola M, West CE, van der Snoek L. The relative validity of reports of food intake of Dutch and Finnish boys aged 8 and 9 years. J Am Diet Assoc. 1987;87(3):303-7.
21. Burrows TL, Martin RJ, Collins CE. A systematic review of the validity of dietary assessment methods in children when compared with the method of doubly labeled water. J Am Diet Assoc. 2010;110(10):1501-10. doi: 2010;110(10):1501-10.1016/j.jada.202010;110(10):1501-10.07.008.
22. Basch CE, Shea S, Arliss R, Contento IR, Rips J, Gutin B, Irigoyen M, et al. Validation of mothers’ reports of dietary intake by four to seven year-old children. Am J Public Health. 1990;80(11):1314-7.
23. Subasinghe AK, Thrift AG, Evans RG, Arabshahi S, Suresh O, Kartik K, et al. Novel dietary intake assessment in populations with poor literacy. Asia Pac J Clin Nutr. 2016;25(1):202-12. doi: 10.6133/apjcn.2016.25.1.19. 24. Gemming L, Utter J, Ni Mhurchu C. Image-assisted dietary assessment: a
systematic review of the evidence. J Acad Nutr Diet. 2015;115(1):64-77. doi: 10.1016/j.jand.2014.09.015.
25. Treviño RP, Ravelo A, Birkenfeld E, Murad M, Diaz J. Food Weight Estimation: A Comparative Analysis of Digital Food Imaging Analysis and 24-Hour Dietary Recall. Journal of Nutrition Education and Behavior. 2015;47(4S):S105.
26. Matthiessen TB, Steinberg FM, Kaiser LL. Convergent validity of a digital image-based food record to assess food group intake in youth. J Am Diet Assoc. 2011;111(5):756-61. doi: 10.1016/j.jada.2011.02.004.
27. Martin CK, Newton RL Jr, Anton SD, Allen HR, Alfonso A, Han H, et al. Measurement of children’s food intake with digital photography and the effects of second servings upon food intake. Eat Behav. 2007;8(2):148-56.
*Corresponding author: Roberto P. Trevino, Social and Health Research Center, San Antonio, Texas, USA, 78210, Tel: 8886; Fax: 210-533-4107; E-mail: [email protected]
Received Date: March 11, 2016, Accepted Date: May 30, 2016, Published Date: June 8, 2016.
Copyright: © 2016 Trevino P, et al. This is an open access article distributed under the Creative Commons Attribution License, which permits unrestricted use, distribution, and reproduction in any medium, provided the original work is properly cited.