INTRODUCTION
The Wire-cut EDM is the focus of researchers and engineers especially in the field of dies, moulds, precision manufacturing, contour cutting etc. Any complex shape can be generated easily with higher accuracy and surface finish, using CNC WEDM, which is not possible to be achieved by normal EDM process. The Wire- cut EDM is precision machining process for micro machining of micro structures, such as high aspect ratio micro holes, slots and moulds. The basic characteristic of the wire cut -EDM process is similar to that of the EDM process with the main difference being in the size of the tool used, the power supply of discharge energy and the resolution of the X, Y, and Z axes movement. In order to improve the process control, it is very important to understand the effect of critical machining parameters involved in the material
Material Science Research India Vol. 5(2),417-422 (2008)
Experimental study and development of mathemtical
relations for machining copper using CNC WDEDM
CH. V.S. PARAMESWARA RAO* and M.M.M. SARCAR
KLCollege of Engineering, Vaddeswaram - 522 502 (India). AU Engineering College, Visakhapatnam - 530 001 (India).
(Received: July 25, 2008; Accepted: September 04, 2008)
ABSTRACT
Although WEDM has revolutionized the present day metal cutting, die making, press tool and precision manufacturing industries, further improvements are still required to meet the increasing demand of product precision and accuracy in those sectors of manufacturing. The machining performance is greatly influenced by various factors like work material, work thickness, discharge current. This paper briefs the effect of work piece thickness on various cutting parameters like discharge current, cutting speed and performance such as material removal rate, spark gap, when copper is machined. An attempt is made to establish mathematical relations between the work piece thickness and other cutting parameters experimental data. It includes the statistical analysis to determine the square of correlation factor, R2 and Standard deviation values. The mathematical relations are
developed using Origin 8.0 software for the best fit curve from the experimental data and ANOVA analysis is applied for analyzing the errors. The results are checked for validation and are found to be encouraging. The mathematical equations explored can be used to establish the machine parameters and estimation of machining time.
Key words: WEDM, Cutting speed, MRR, Spark gap, Mathematical relations.
process parameters is required for achieving improved machining characteristics4.There is an
immediate need to develop Mathematical relations for successful utilization of the process with high productivity. The parameters which demand attention for the pur pose of analyzing their significant effects on the machining characteristics include discharge current gap voltage, wire material, wire tension, wire speed5,6,7 etc.
EXPERIMENTAL Procedure
The objective of the present work is to analyze the effects of various process parameters on the machining characteristics of CNC WEDM on different criteria like cutting speed, spark gap, material removal rate and to suggest optimal values with the use of developed empirical relations.
Fig.1. shows the schematic view of the experimental set up.
Machine : ELCUT 234,
Dielectric : De- ionized water
Dielectric conductivity : 38 mhos
Wire tension : 70 N
Wire velocity : 3.4 m/min
Wire diameter : 0.25 mm
Wire material : 66-34 Brass
Gap voltage : 80 volts
The above parameters are considered as best fit from previous researchers5,6 and set on the
machine before cutting. Copper work pieces of thickness 5mm to 80mm are cut with rectangular slots of 4mm × 6mm size and L –slots of 5mm×4mm using CNC part programming. 5 cuts are performed on each work piece by altering the discharge current .The observations are recorded for all values up to
the maximum cutting speed and wire breakage. The experiment is repeated on 19 different work piece sizes.Rectangular slots tested for surface finish using Taly surf, and L slots for spark gap using Shadowgraph and microscope. Plots are developed with the experimental data obtained using Origin 8.0 soft ware, best fit curves are selected and statistical analysis is done for those curves. In the regression analysis for all curves the R2 as well as
standard deviation values are recorded. The mathematical equation for the statistically best curve is considered. The general form of mathematical relation developed is y = A2+ (A1-A2) / [1 + exp(x-xo)/dx] where A1, A2, xo and dx values are derived from the statistical analysis and are tabulated.
RESULTS AND DISCUSSIONS
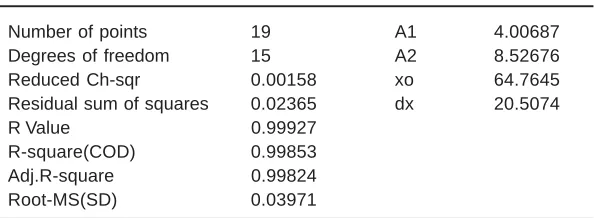
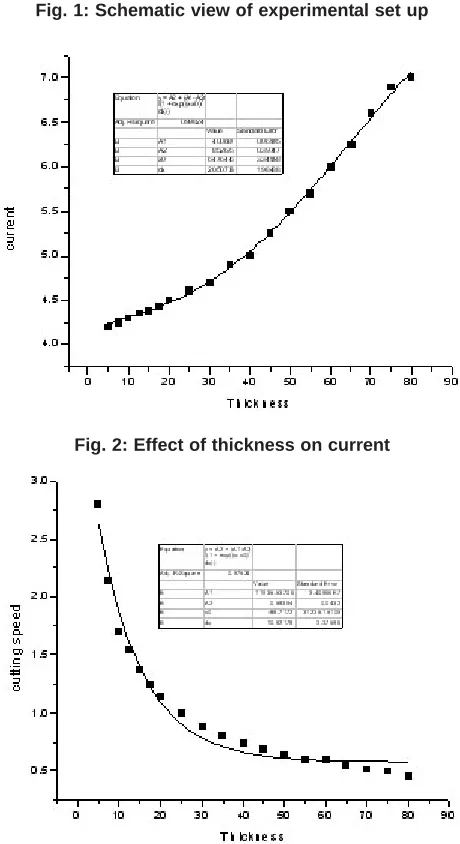
Fig. 2 shows the variation in the discharge current with the increase in work piece thickness under same set of machining conditions. This may be due to the requirement of high energy, which will be possible with higher currents. From this plot, the suitable discharge current can be considered for any job thickness within the machine’s working range. The best fit curve is selected and feasibility is checked. In the statistical analysis it shows the square of the correlation coefficient, R2 value of
0.99583, which indicates the fitness of the curve and the mathematical equation drawn is for this curve and standard deviation found as 0.09882. The mathematical relation obtained for the best fit curve is I = 8.53 – {4.52/ [1+exp (T- 64.76)/20.5]} where I is discharge current, amp and T is work thickness, mm Table.1 gives the statistical data generated during the ANOVA (error analysis) carried out for the plot drawn between discharge current and work piece thickness.
Table 1: Thickness vs Discharge current
Number of points 19 A1 4.00687
Degrees of freedom 15 A2 8.52676
Reduced Ch-sqr 0.00158 xo 64.7645
Residual sum of squares 0.02365 dx 20.5074
R Value 0.99927
R-square(COD) 0.99853
Adj.R-square 0.99824
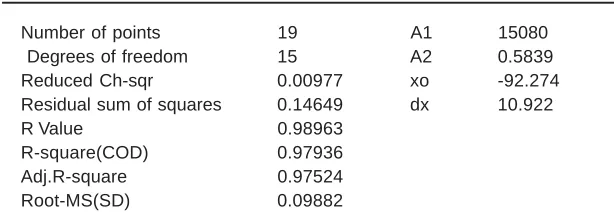
Table 2: Thickness vs cutting speed
Number of points 19 A1 15080
Degrees of freedom 15 A2 0.5839
Reduced Ch-sqr 0.00977 xo -92.274
Residual sum of squares 0.14649 dx 10.922
R Value 0.98963
R-square(COD) 0.97936
Adj.R-square 0.97524
Root-MS(SD) 0.09882
Table 3: Thickness vs spark gap
Number of points 19 A1 91.526
Degrees of freedom 15 A2 34337
Reduced Ch-sqr 2.0329 xo 340.63
Residual sum of squares 30.494 dx 37.56
R Value 0.9894
R-square(COD) 0.9789
Adj.R-square 0.9746
Root-MS(SD) 1.42
Table 4: Thickness vs MRR
Number of points 19 A1 217654
Degrees of freedom 15 A2 4.66
Reduced Ch-sqr 0.08193 xo 6435.8
Residual sum of squares 1.22888 dx 58.79
R Value 0.99787
R-square(COD) 0.99574
Adj.R-square 0.99488
Root-MS(SD) 0.28623
The effect of Cutting speed for different sizes of work pieces is shown in Fig.3. The plot indicates that as thickness of the work piece increases the cutting speed decreases. If the thickness increases, the volume of metal to be removed increases which demands more energy, which may become a machine constraint. The best suitable curve is selected and error analysis is carried out. The statistical analysis gives R2 =
0.97936 which shows the curve as ideal and standard deviation value of 0.09882.From the mathematical relation the cutting speed can be predicted for any size of work piece to be machined. The mathematical equation for the curve is Cs =
0.583 + {15079.4/ [1+ exp (T+92.27)/10.92]} C s = cutting speed, mm/min
Table.2 gives the statistical data generated during the ANOVA (error analysis) done for the plot drawn for variation of cutting speed and work piece thickness.
Fig. 1: Schematic view of experimental set up
Fig. 2: Effect of thickness on current
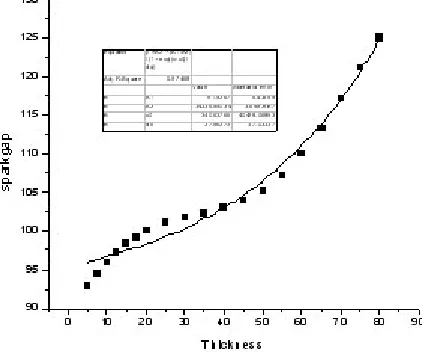
Fig. 4: Effect of thickness on spark gap
Fig. 5: Effect of thickness on MRR this data is drawn. This plot may be useful to provide
offset during CNC part programming, to achieve higher accuracy and also to compute material removal rates (MRR).R2 value of 0.9789 is obtained
in the statistical analysis for best fit curve selected and also confirms the same. A standard deviation of 1.42581 is obtained. The mathematical equation of this plot is SG = 34337{- 34245/ [1+exp (T-340.6)/37.52]} SG= Spark gap, micro meter and may be adopted for spark gap or cutter off set calculations.
Table 3 gives the statistical data generated during the ANOVA (error analysis) done for the best
fit curve drawn between spark gap and work piece thickness.
Fig.5 indicates the change in MRR with thickness variation. The statistical analysis gives R2
and standard deviation values as 0.99574 and 0.28623 and it is an indication of the correctness in the experimentation. The mathematical equation obtained for the plot is MRR= 23.05{- 2065.35/ [1+ exp (T+ 277)/58]} MRR= Material removal rate, mm3/min which may be useful for MRR calculations.
CONCLUSIONS
The influence of parameters, like discharge current, job thickness, on the machining criteria such as cutting speed, spark gap, material removal rate are determined. The results are useful in setting the parameters required for quality cuts on copper. Suitable parameters can be selected for machining with the wire available. The mathematical relations developed are much more beneficial to estimate the cutting time, cost of machining and accuracy of cutting for any size of the job within machine range.
These results will be useful to make the Wire EDM system to be efficiently utilized in the present day die and tool-manufacturing units and to make electrodes for EDM and ECM processes.
ACKNOWLEDGEMENTS
The authors are happy to record their sincere thanks to M/s Ratna Tool Engineering Company, Jeedimetla, Hyderabad for extending the facilities for experimentation and measurements
REFERENCES
1. Rajurkar,K.P.,Wang,W.N.:- “ On-Line monitor and control for wire breakage in WEDM” Annals of CIRP., 40/1/1991
2. Rao, C.V.S.P, Das,N.C. and Sorkhel,S.K.:-”Some studies for Wire selection in WEDM” Proc. Of the all India Seminar on Computer applications in Mater ial Processing Organized by the Institution of Engineers(I) ,30th August (1992).
3. Sorkhel,S.K., Bhattacharya.B and Das,N.C.: - “Analysis process parameters of CNC WEDM for effective material machining”-International conference on Precision Engg 2nd ICMT,Singapore, Nov 22-24: 545-548 (1995).
4. Sorkhel,S.K.,Bhattacharya.B and Das,N.C.: - “Control process parameters for effective machining character istics of CNC WEDM”,17th AIMTDR,Jan 9-11,1997
REC,Warangal.
5. Y.S.Wang,M.Rahman,H.S.Lim
:-”Investigation of micro – EDM material removal characteristics using single RC-pulse discharges”- Journal of material processing Technology 140: 303-307 (2003). 6. Ch.V.S.Parameswararao, MMM Sarcar: -“Experimental Studies and Development of Empirical Relations for Machining H-C H-Cr
Steel with CNC WEDM” Journal
Manufacturing Technology Today, 27-30 (2008 )
7. Y. S. TARNG, S. C. MA and L. K. CHUNG: -“Determination of optimal cutting parameters in Wire Electrical Discharge Machining” journal of materials processing technology 199: 369-378 (2008).