http://www.ijSciences.com
Erika A. Brown (Correspondence)Mediation Analysis via Observation
Oriented Modeling
Erika A. Brown
1
, James W. Grice
1
1
The authors wish to thank M. Brent Donnellan, Dannelle Larsen-Rife, Rand D. Conger, Karen J. Kaczynski, Kristin M. Lindahl, Neena M. Malik, and Jean-Philippe Laurenceau for their willingness to provide their data to be analyzed using Observation Oriented Modeling. Correspondence concerning this article should be addressed to Erika A. Brown, Oklahoma State University, Department of Psychology, 116 North Murray, Stillwater, OK 74078. Electronic mail may be sent to [email protected].
Abstract: Psychologists routinely treat psychological attributes as quantitative in nature, and the majority of
statistical tools traditionally employed by psychologists also rest upon the assumption of continuous quantitative structure. There is no evidence, however, that attributes such as intelligence, depression, personality traits, etc. are truly quantitative, thus rendering most statistical techniques inappropriate for psychological data. Observation Oriented Modeling (OOM) is an alternative data analysis technique that does not require the assumption of continuous quantity, and it is an approach that eschews aggregate statistics while returning individual observations to the forefront of the analysis. Two published mediation models are re-analyzed in the current paper using OOM and the results compared to those obtained from traditional, variable-based analyses. It is shown that OOM yields results that are entirely transparent and readily interpretable. Unlike traditional analyses, the results also provide a clear understanding of what is happening at the level of the persons in the two studies. OOM is therefore a novel way of conceptualizing and analyzing data that may lead to more accurate and complete explanations of psychological phenomena.
Keywords: Observation Oriented Modeling; mediation analysis; null hypothesis significance testing; research
methods
If psychologists and other social scientists strive for their fields to be counted among the quantitative disciplines, it is requisite that they first demonstrate their adherence to the same scientific principles and standards. In quantitative science, the specific attributes that are of interest are assumed to possess a quantitative structure that can be described in varying magnitudes (Michell, 1997). The attribute of mass, for example, possesses in itself a quantitative structure that can be described in terms of the magnitude of specific instances; consequently, the mass of a particular object would be a magnitude of the attribute of mass.
It follows that scientific measurement, as it is traditionally defined, is “the estimation or discovery of the ratio of some magnitude of a quantitative attribute to a unit of the same attribute” (Michell, 1997, p. 358). In other words, scientific measurement involves the process of discovering ratios among the magnitudes of a particular attribute. In order for an attribute to be declared as possessing quantitative structure – that is, in order for it to be scientifically measured – observations or data obtained for the attribute must possess certain characteristics. These characteristics of quantitative structure, outlined by Otto Hölder (1901) in seven axioms, include the continuity and additivity of the observations or data.
Joel Michell (1997; Michell, 2008) explicates the tasks required to establish a truly quantitative science. First, he describes the scientific task of demonstrating that the attribute of interest possesses the quantitative structure that is assumed by the classical view of scientific measurement. Only after one has accomplished this first task is it appropriate to move on to the second task – the instrumental task of developing a means of estimating specific magnitudes of the attribute. Unfortunately, common practice in the social sciences is to skip the scientific task and move directly to the instrumental task, either as a consequence of assuming that the scientific task would be sufficiently demonstrated if it were tested or out of ignorance about the assumptions inherent in the procedures commonly employed.
Brief History of the Measurement Crisis in Psychology
2
report on. Beginning in 1932, the British Association for the Advancement of Science charged the Fergusson Committee with the task of ascertaining whether psychological data like Fechner’s were truly quantitative. Specifically, the 19 members of the committee – representing both psychology and the mathematical and physical sciences – were to judge the possibility of the quantitative measurement of human sensations. That is, they were to determine whether the researchers in psychology were capable of measuring their attributes according to the classical view of measurement. Ultimately, in the final report (Ferguson et al., 1940), the conclusion was that psychological data were not quantitative because they did not adhere to the traditional view of measurement. Consequently, it was determined that these researchers were, by definition, not measuring anything.
In response to these criticisms, rather than taking steps toward testing the hypothesis that their data do possess quantitative structure, most psychologists instead favored a new conceptualization of what is meant by measurement. Stanley Smith Stevens (1946), paraphrasing N. R. Campbell, proposed the new definition of measurement as “the assignment of numerals to objects or events according to rules” (p. 677). He argued further that this definition infers the existence of multiple scales that arise from the specific rules being used for the assignment of numerals. These scales are the four scales of measurement taught to nearly every psychology student today – nominal, ordinal, interval, and ratio. Stevens went on to describe his four scales of measurement along with the basic empirical operations and permissible statistics that can be used with data of each type. Stevens proposed this “most liberal and useful definition of measurement” as a solution to the semantic disputes about what does or does not constitute measurement (p. 680). Accordingly, Stevens suggested asking what type of consistent rules the researcher used in assigning numerals. This would indicate which type of scale and which type of measurement is being used. In short, Stevens’ definition of measurement allowed psychologists to analyze their data without first considering whether or not they were capable of claiming scientific measurement in the same way as the mathematical and physical sciences. The new definition essentially preserved their desire to be included among the other scientific disciplines but without the same responsibilities (Michell, 1997). In other words, psychologists had a justification for why their data were not truly quantitative in the same way as data from other scientific fields, which allowed them to still label what they were doing as measurement.
Current Trends in Psychology
Given Stevens’ definition of measurement and the accompanying four scales, a researcher’s choice of statistical analysis is partially dictated by the scaling of his or her data. With nominal or ordinal data non-parametric analyses can be conducted, such as chi-square, the sign test, or Spearman’s rank order correlation. These analyses, however, are understood to be generally less powerful, statistically speaking, than analyses for interval or ratio scaled data. Researchers are therefore provided with a statistical incentive for presuming quantitative structure, which helps to explain the overwhelming popularity of factor analysis, least squares regression, t-tests, analysis of variance, Pearson’s correlation, and most structural equation models (Tremblay & Gardner, 1996). These techniques require interval or ratio scaled data to be legitimate, but as Michell (1997) argues psychologists have not carried out the scientific task of demonstrating the continuous quantitative structure of the attributes they study. Psychologists have instead moved on prematurely to the instrumental task, and consequently are attempting to build knowledge of human behavior on a foundation of sand.
3
data” (p. 298). Conversely, Freedman posited that “regression models make it all too easy to substitute technique for work” (p. 300) leading to the following conclusions, as summarized by Mason (1991): “Simple [statistical/data analytic] tools should be
used extensively. More complex tools should be used rarely, if at all. Thus, we should be doing more graphical analyses and computing fewer regressions, correlations, survival models, structural equation models, and so on.
Virtually all social science modeling efforts (and here I include social science experiments, though I'm not sure Freedman would) fail to satisfy reasonable criteria for justification of the stochastic assumptions” (p. 338).
Finally, after years of largely ignoring the scientific task of establishing quantitative measurement, psychologists may have little reason for optimism. According to Trendler (2008), for measurement to be possible in psychology, a “Galilean revolution” similar to that in physics must first take place. However, he posits that psychological attributes are not manageable to the extent necessary for this revolution to take place; consequently, quantitative measurement is not possible for the overwhelming majority of attributes psychologists find most intriguing (e.g., intelligence, depression, personality traits). As a result, and consistent with Freedman’s (1991) recommendations, he suggests that new techniques must be found that are more appropriate for dealing with the data in psychology.
Observation Oriented Modeling as a New Approach to Data Analysis
Observation Oriented Modeling (Grice, 2011) is herein demonstrated as an alternative analysis technique that is more suitable for the data in psychology. To limit the scope of this paper, only the procedures for handling a simple mediation model are presented. Recently, concerns with Baron and Kenny’s (1986) well-known definition of a mediation model and their method for testing mediation have been expressed (e.g., Kazdin, 2007; Gelfand, Mensinger, and Tenhave, 2009). In particular, inconsistencies often exist between aggregate-level results and person-centered results. Collins, Graham, and Flaherty (1998) provide an example of full mediation using the Kenny, Kashy, and Bolger (1997) approach to establishing mediation (based on Baron and Kenny’s (1986) and Judd and Kenny’s (1981) definition of mediation) that does not fit the time-sequenced mediation of predictor-mediator-outcome at the level of the individuals in the sample. That is, while full mediation was found at the aggregate level, the predictor-mediator-outcome sequence was not found beyond what would be
expected by chance for the individuals in the sample. Using categorical, rather than continuous data, Von Eye, Mun, and Mair (2009) similarly posit that “analysis at the aggregate, variable-oriented level comes with the risk of obscuring processes that describe subpopulations or individuals” (p. 243). They present an example where no mediation was found at the aggregate level, but there was in fact mediation at the individual level for nearly half of the sample. Using their configural analysis approach, researchers not only examine their data for one overall effect, but also for examples of mediation types (mediation patterns that occur more frequently than expected by chance), mediation antitypes (mediation patterns that occur less frequently than expected by chance), and non-mediation (patterns that do not represent mediation). The sentiment that individuals are misrepresented in mediational analyses done using aggregate statistics is shared by Faldowski (2009), who also comments on the need for an idiographic perspective of mediation.
Given the criticisms of Baron and Kenny’s (1986) popular approach to testing mediation (and the debate of whether quantitative measurement is possible in psychology in the first place), alternative means of analyzing mediation in psychological attributes are necessary. As stated above, Observation Oriented Modeling (OOM; Grice, 2011) is demonstrated here as one such alternative technique for data analysis. OOM provides researchers with a method that does not require continuous, quantitative measurement – categorical or rank ordered data are perfectly acceptable with this technique without any attempts at making the data behave as if equal intervals exist in nature. Further, OOM brings the individuals under study back to the forefront of the analysis, as opposed to results that only describe the aggregate, which may or may not apply to the majority of the individuals in the study.
4
An Example of Data Analysis using OOM
The data used in this first example to demonstrate OOM come from the work of Donnellan, Larsen-Rife, and Conger (2005). Their participants were drawn from a larger sample that consisted of target individuals who participated in the Family Transitions Project (FTP), a longitudinal study aimed at assessing the transition from adolescence to young adulthood. The sample demographics were generally representative of rural Iowa. The target participants were assessed (using both observational techniques and self-report questionnaires) on multiple occasions throughout their adolescence and into their early adulthood years. For more detailed information on the sample and specific assessment procedures used throughout the study, the reader is referred to the original article.
Data collection for the particular mediation model of interest here (see Figure 1) began in 1994, when most
of the target individuals were in their senior year of high school. During this wave of data collection, the adolescents’ parents were videotaped during a structured interaction task designed to elicit conversations about family life and areas of disagreement. Trained observers independently coded the videotapes after having completed extensive amounts of training and demonstrating acceptable levels of reliability. High hostile/low warmth behaviors were coded during this marital interaction resulting in two separate indicators – father-to-mother negativity and father-to-mother-to-father negativity. These two indicators were then intended to represent the latent variable of Marital Negativity. Scores on both of these indicators were real numbers (e.g., 2.4, 3.7) that could range from 1 to 9, with higher scores indicating higher levels of negativity.
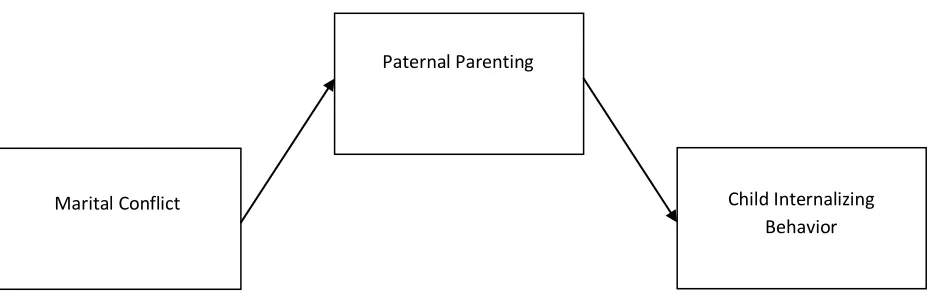
Figure 1. Proposed mediation model of Nurturant-Involved Parenting between Marital Conflict and Negative Relationship Interactions.
Also in 1994, target adolescents participated in structured videotaped discussion tasks with their parents. These videotapes were likewise coded by independent, well-trained, and sufficiently reliable coders. From these parent-child interactions, three indicators were used to represent the latent variable of Nurturant-Involved Parenting – parental affect, parental monitoring, and parental discipline. Parental behaviors that were high in warmth and low in hostility toward the adolescent were coded for the parental affect indicator. Parental monitoring was coded as parental behaviors that indicated an awareness of the adolescent’s activities, the presence of appropriate boundaries, and quality time. Behaviors low in harshness and inconsistent
discipline were coded for the parental discipline indicator. Scores on each of the indicators were real numbers that could range from 1 to 9, with higher scores indicating higher levels of Nurturant-Involved Parenting. When data from both the target adolescent’s mother and father were available, these data were averaged to produce one parent score. The target adolescents were again contacted in 1999 during an early adulthood romantic relationship. For this wave of data collection, both the target individuals and their partners were assessed using videotaped interaction discussion tasks similar to those used in 1994. Coders were once again independent, highly trained, and reliable. Both the
Marital Negativity
Nurturant-Involved Parenting
5
target individual and his or her partner were coded for behaviors high in hostility and low in warmth. This resulted in two predictors that represented the latent variable of Negative Relationship Interactions – target’s negative behaviors and partner’s negative behaviors. Scores were real values that could range from 1 to 9, with higher scores indicating higher levels of negativity.
As can be seen in Figure 1, the mediation model is that Nurturant-Involved Parenting will serve as a mediator between Marital Negativity and Negative Relationship Interactions. In other words, high levels of negativity in the parents’ marriages should cause low levels of nurturant-involved parenting, which should in turn result in low levels of relationship competence in the target individuals (i.e., high levels of negativity in their own early adulthood relationships). Based on results from their SEM analyses, which included additional variables, Donnellan, Larsen-Rife, and Conger (2005) concluded that “parental marriages have an indirect effect on romantic competence by means of connections with actual parenting behavior” (p. 573). Moreover, the authors state that “observed parenting is a significant predictor of competence in romantic relationships while negative marital interactions are controlled but not vice versa,” which is consistent with the conclusion that “parenting mediates the association between negative marital interactions in the family of origin and later characteristics of an offspring’s romantic relationship” (p. 570).
To provide results of this mediation model for comparison with the results obtained with OOM, the predictors for each latent variable were summed and subjected to Baron and Kenny’s (1986) common approach to testing mediation. First, Marital Negativity was shown to be a significant predictor of Negative Relationship Interactions, R2 = .05, β = .22,
p = .01. Second, Marital Negativity was shown to significantly predict Nurturant-Involved Parenting, R2
= .16, β = -.40, p < .001. Third, Negative Relationship Interactions was shown to be significantly predicted (R2 = .08, p = .001) by Marital Negativity (β = .13, p = .11) and Nurturant-Involved Parenting (β = -.20, p = .02). As was noted by Donnellan, Larsen-Rife, and Conger, Nurturant-Involved Parenting was a significant predictor of Negative Relationship Interactions after controlling for Marital Negativity, but the reverse was not the case. Further, a Sobel test indicated a significant decrease (z = 2.25, p = .02) in the association between Marital Negativity and Negative Relationship Interactions after controlling for Nurturant-Involved Parenting.
Using the traditional method for testing mediation, these results are consistent with what the authors reported for their larger structural model – that the
association between Marital Negativity and Negative Relationship Interactions is fully mediated by Nurturant-Involved Parenting. As a result of this full mediation, the authors reasoned that Nurturant-Involved Parenting was the more meaningful variable, and consequently decided to exclude Marital Negativity from the remaining analyses. All of these procedures assume that each of the three attributes is measured quantitatively. However, the scientific task of testing whether these attributes possess quantitative structure is yet to be demonstrated. Moreover, the results are described at the aggregate level with no indication of whether or not the model holds for the individuals in the study. With these limitations in mind, the same data were analyzed using OOM.
In the context of OOM variables are referred to as “orderings” and each value of an ordering is referred to as a “unit” representing a unit of observation. Part and parcel of any analysis in OOM is the definition of the units of analysis for the orderings, which is like setting a scale in traditional research, and is ideally determined by what is referred to as an integrated model (see Grice, 2011). As a reminder, Marital Negativity (comprised of two items) is the first ordering in the mediation model with numbers recorded as real values with a possible range of 2 to 18. Absent an integrated model, the Marital Negativity observations were initially ordered into 33 units representing ranges of the original scale values (2-2.4, 2.5-2.9, 3-3.4, etc.). The observations for Negative Relationship Interactions, with values possibly ranging from 2 to 18 were similarly ordered into 33 units. Nurturant-Involved Parenting (comprised of three items) has a scale range of 3 to 27 and were initially ordered into 49 units representing ranges of the original scale values (3-3.4, 3.5-3.9, 4-4.4, etc.). The individual units for all three orderings were labeled generically as the range of numerical values they represented. The observations appeared to be normally distributed across the units, although there were very few observations for the lower and higher labeled units for all three orderings.
6
higher (or lower) scores on Nurturant-Involved Parenting also having lower (or higher) scores on Negative Relationship Interactions. Individuals who fall outside of this expected pattern, such as those who have high scores on Nurturant-Involved Parenting and high scores on Negative Relationship Interactions, would not represent mediation as it has been predicted by the current model (cf.,Von Eye et al., 2009).
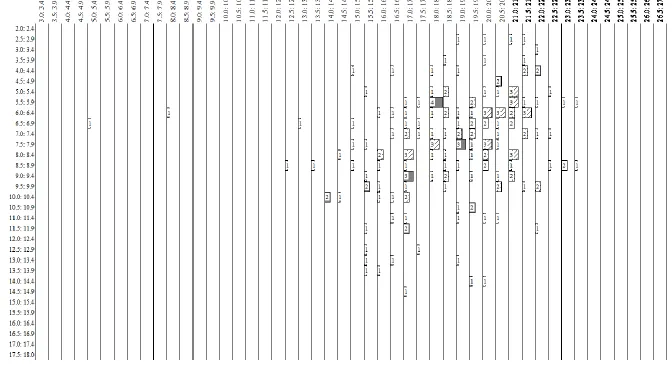
There were 182 individuals with data on both of these ordering. After testing this model in the OOM software, the results can be viewed graphically in the form of a multigram (see Figure 2). Each observation is graphed on the multigram via triangulation using the observation’s score on both of the orderings included in this step. As can be seen in Figure 2, the resulting multigram was a bit complicated, with numerous empty units for both orderings, and with the majority of the frequency bars representing only one or two observations. In the context of OOM, such small frequencies are problematic because of the emphasis on searching for a meaningful pattern in the obtained observations. With empty units and infrequent units a strong and convincing pattern
simply cannot be detected. In the current example this problem can also be understood as having too few observations for the original scale ranges, requiring a decrease in the number of units for the two orderings.
http://www.ijSciences.com Volume 1, Issue Nov 2012
7
http://www.ijSciences.com Volume 1, Issue Nov 2012
8
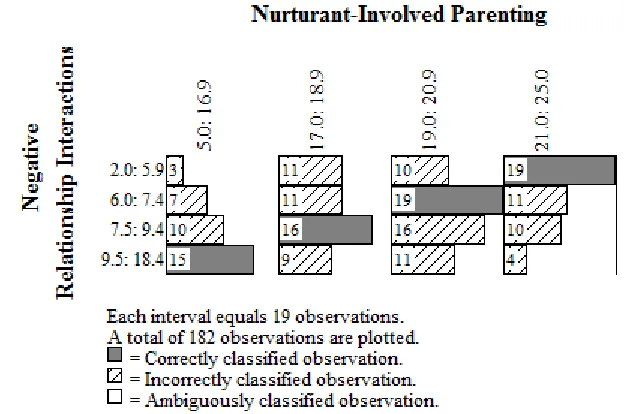
The first step of testing for mediation (viz., the link from Nurturant-Involved Parenting to Negative Relationship Interactions) was repeated using these newly defined orderings. With only four units for each ordering, the multigram (see Figure 3) is now interpretable. The solid frequency bars represent the observations that were correctly classified based on the observed pattern of observations, whereas the striped frequency bars represent the observations that were incorrectly classified based on the pattern of observations. Of the 182 observations with
data on both of these orderings, 69 observations were correctly classified. In other words, the predicted link from Nurturant-Involved Parenting to Negative Relationship Interactions was present for 37.91% of the sample. For these individuals, offspring who were observed to experience increasingly nurturant-involved parents were also more often observed to experience decreasing levels of negativity in their own relationship (as well as the opposite). The remaining 113 individuals did not fit the pattern expected under the mediation model.
Figure 3. Multigram for Nurturant-Involved Parenting and Relationship Negative Interactions using quasi-quartile categories.
Observation Oriented Modeling employs a randomization test as an aid for evaluating the proportion of observations correctly classified by the analysis. The test works by repeatedly assigning the observations to the target ordering (i.e., the cause), while holding their position on the conforming ordering (i.e., the effect) constant. The analysis is then conducted on each of these randomized versions of the observations and the proportion of correctly classified observations determined. The proportion obtained for the actual data (viz., .3791) can then be compared to the distribution of proportions obtained from randomized versions of the same observations. After 1000 such randomizations, the observed Percent Correct Classification (PCC) of 37.91% for the current data was met or exceeded by chance only six times, resulting in a c -value (viz., chance -value) of .006 – calculated by dividing the number of randomizations that met or exceeded the observed PCC by the total number of randomizations: 6/1000 = .006. The minimum PCC obtained from the randomization test was 24.73% and the maximum PCC was 40.66%. The results therefore show that the observed pattern was very unusual.
The final step in testing the mediation model is to build and test the model using the first ordering (i.e., the predictor) as the cause and the second ordering (i.e., the
http://www.ijSciences.com Volume 1, Issue Nov 2012
9
were not missing observations on one of the orderings did not fit the pattern expected under the mediation model. After 1000 randomizations, the observed Percent Correct Classification (PCC) of 44.44% was equaled or exceeded
42 times, resulting in a c-value of .04. The minimum PCC obtained in the randomization test was 20.63% and the maximum PCC was 49.21%. Thus, the observed pattern was nonetheless unusual.
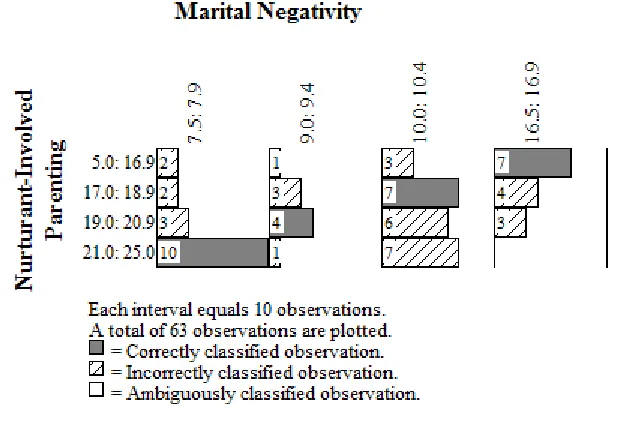
Figure 4.Multigram for Marital Negativity and Nurturant-Involved Parenting using quasi-quartile categories.
These results may seem impressive in that for both steps of the analysis the observed PCC values were rarely found in randomized orderings of the same data, as demonstrated by the low c-values. However, in OOM the c-value is an ancillary statistic, computed solely for the purpose of helping the researcher to judge the distinctiveness of the observed pattern. Accuracy, as presented in the PCC value itself, is the primary judgment to be made. In this example the percent of individuals who fit the pattern and were therefore correctly classified (i.e., the observed PCC values) was less than half of the included sample at each step. Overall, only 28 of the original 182 individuals demonstrated the predicted mediation through both steps of the analysis. For the other 154 individuals, 6 were missing observations and 148 did not fit the expected pattern for mediation. Accordingly, the model is not accurate, and this is furthermore an example of the inconsistency that frequently occurs between aggregate-level analyses and person-centered analyses. Although the standard approach to testing mediation at the level of the aggregate yielded highly significant results that suggested full mediation, the final success rate at the level of the individuals was only 15.38% (28 / 182 * 100). That is, the full sequence of the proposed mediation model (predictor-mediator-outcome) was successfully demonstrated by less than one in six individuals. All other individuals deviated from the expected pattern in one way or another. Finally, it should be noted that attempts to improve these results by using different definitions for the units of observation were not successful.
A Second Example of Data Analysis using OOM
http://www.ijSciences.com Volume 1, Issue Nov 2012
10
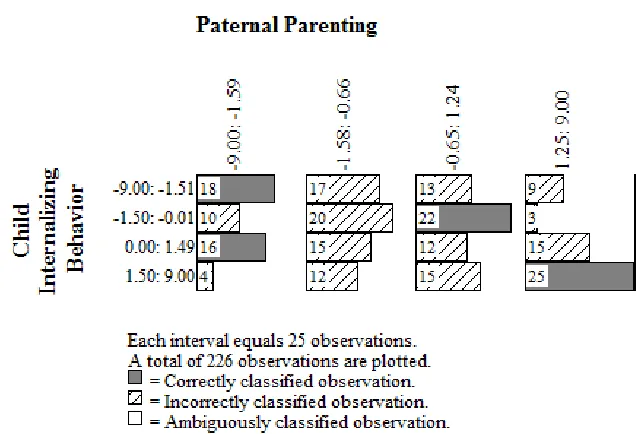
Figure 5.Proposed mediation model of Paternal Parenting between Marital Conflict and Child Internalizing Behavior. The latent variable of Marital Conflict was assessed using
responses from each parent as well as from the child. Each parent completed 10 items using a 5-point Likert scale that assessed the frequency of parent conflict as seen from the child’s perspective. For both of these predictors (one from each parent), scores could range from 0 to 50. Children likewise completed a 19-item measure of parental conflict using a 3-point Likert scale, with scores that could range from 0 to 57. Higher scores from each respondent indicate higher levels of perceived conflict.
Paternal Parenting was coded using videotaped family interactions in which the parents and the child discussed a recent parent-child conflict and attempted to find a solution. The interaction was coded by trained and continuously monitored coders to assess the degree to which fathers were rejecting, coercive, and emotionally supportive using a 5-point Likert scale. Rejecting behaviors consisted of fathers being critical or insulting of their child. Coercive behaviors were identified as the fathers being manipulative or threatening. Emotional supportiveness was coded as the fathers’ recognizing and meeting the child’s emotional needs. Emotional supportiveness was reverse scored so that higher scores always indicated negative parenting behaviors. Collectively, these three predictors (rejecting behaviors, coercive behaviors, and emotional non-supportiveness) represent the latent variable of Paternal Parenting.
The third latent variable of Child Internalizing Behavior was assessed using maternal and paternal report of the child’s internalizing behaviors. Specifically, mothers and fathers independently rated the internalizing behaviors of their child using the Child Behavior Checklist. Additionally, the coders used the videotaped familial interactions to assess the sadness of the child on a 5-point Likert scale. These three predictors (maternal, paternal, and coder report of the child’s internalizing behavior) represented the latent variable of Child Internalizing Behaviors. Higher scores indicate higher levels of internalizing behaviors.
To reiterate, the mediation model of interest here shown in Figure 5 is that Paternal Parenting will serve as a mediator
between Marital Conflict and Child Internalizing Behavior. Thus, high levels of marital conflict should cause fathers to exhibit more rejecting and coercive behaviors and lower levels of emotional support (i.e., Paternal Parenting), which, in turn, should cause higher levels of internalizing behaviors in the child (as well as the opposite).
The data were first analyzed using traditional methods. Because the variables comprising Marital Conflict and Child Internalizing Behavior were not all on the same scale, they were first standardized and then summed. For the sake of consistency, standardized scores were also summed to generate scale scores for Paternal Parenting. It should be noted that the computation of z-scores presupposes continuous quantitative attributes, which have not been demonstrated by the study authors. If the study had been designed with OOM in mind, more effort would have been expended to either test the continuity assumption or to obtain observations that are clearly understood as frequencies or as ordinal judgments. Nonetheless, the three standardized composite variables were subjected to Baron and Kenny’s (1986) traditional test of mediation. In the first step, Marital Conflict significantly predicted Child Internalizing Behavior, R2 = .10, β = .32, p < .001. In the second step, Marital Conflict was a significant predictor of Paternal Parenting, R2 = .10, β = .32, p < .001. In the third step, both Marital Conflict (β = .21, p = .001) and Paternal Parenting (β = .35, p < .001) significantly predicted Child Internalizing Behavior, R2 = .21, p < .001. Although Marital Conflict remained a significant predictor of Child Internalizing Behavior after controlling for Paternal Parenting, a Sobel test indicated a significant decrease (z = 3.71, p < .001) in the association between Marital Conflict and Child Internalizing Behavior after controlling for Paternal Parenting. As was reported by the authors, these results support the presence of the mediation of Paternal Parenting between Marital Conflict and Child Internalizing Behavior.
Marital Conflict
Paternal Parenting
http://www.ijSciences.com Volume 1, Issue Nov 2012
11
Recall that in OOM the terminology shifts slightly to highlight the change in thinking required using this method of data analysis compared to the standard approach of estimating abstract population parameters. The variables are referred to as “orderings” with each unit of observation referred to as a “unit.” The researcher is assigned the task of defining the units of analysis for each ordering – ideally prior to beginning the data collection. With the current data, since the predictors of the individual orderings were assessed on varying scales, the orderings were standardized and then summed post hoc. Again, the researcher would preferably avoid this issue in the future when designing the study, as the standardization process inherently assumes (but does not ensure) continuity. Accordingly, the initial set of definitions ordered the observations (i.e., the data) of all three orderings (Marital Conflict, Paternal Parenting, and Child Internalizing Behavior) into 19 units of analysis representing ranges of summed z-score values that were generically labeled as the range of numerical values they represented (e.g., 9.00 to -8.01, -8.00 to -7.01, -7.00 to -6.01). For all three orderings, the observations appeared to be normally distributed across the units, with very few or no observations in the lower or higher labeled units.
The mediation model is tested by first using the second ordering (i.e., the mediator) as the cause of the third ordering (i.e., the outcome). For the current data, Paternal Parenting is the cause and Child Internalizing Behavior the effect. Since Paternal Parenting represents the negative parenting behaviors of coercive, rejecting, and a lack of emotional supportiveness, higher scores indicate poor
paternal parenting. Likewise, higher scores on Child Internalizing Behaviors indicate a higher degree of internalizing behaviors in the child. We expect that most of the observations will conform to a pattern in which individuals with higher (or lower) values on Paternal Parenting will also have higher (or lower) values on Child Internalizing Behavior. Individuals who do not fit this predicted pattern (e.g., an individual with moderate values on Paternal Parenting and high values on Child Internalizing Behavior) would not fit the expected mediation model.
http://www.ijSciences.com Volume 1, Issue Nov 2012
12
http://www.ijSciences.com Volume 1, Issue Nov 2012
13
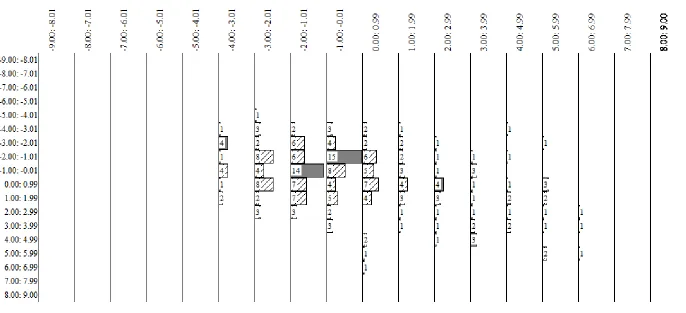
mediation model, the model was built and tested linking Paternal Parenting as the cause of Child Internalizing Behavior. The resulting multigram shown in Figure 7 is now interpretable. Specifically, of the 226 observations with data on both orderings, 81 observations (35.84%) were correctly classified based on the detected pattern. Unfortunately, the pattern that emerged in the data is not entirely consistent with what was expected under the mediation model other than in the units representing the highest and lowest z-score sums. Specifically, those children who exhibited the lowest level of internalizing behaviors most commonly had fathers who employed the lowest level of rejecting, coercive, and emotionally unsupportive behaviors. Conversely, the children who exhibited the highest level of internalizing behaviors most commonly had fathers who employed the highest level of negative parenting behaviors. Both of these would be expected under the mediation model. For those children who exhibited less extremeinternalizing behaviors, however, the data did not fit the mediation model as would be expected. Children in the middle units of internalizing behaviors most commonly had fathers who were in the third unit of employing poor
internalizing behaviors most commonly had fathers who exhibited the least amount of negative parenting behaviors.
The researcher who is faced with these results is forced to think critically about the pattern of observations obtained from the given data. In light of the obtained pattern of observations, one might be forced to consider that perhaps a simple mediation model is not the most appropriate explanation for the data. Conversely, one might also argue that the number of observations in each of the units is similar enough that perhaps there is still evidence for mediation that would have been clear with a different sample. This argument is rather dangerous, however, because the predicted mediation model should be represented in the current data, at least most of the time, if it is truly a viable explanation. At some point the researcher should accept that the best course of action may be returning to the basics of understanding the structures and processes involved in the attributes of interest and work toward establishing a truly integrative model, as opposed to defending an abstract model that makes sense at the aggregate level but perhaps not at the individual level.
Figure 7.Multigram for Paternal Parenting and Child Internalizing Behavior using quasi-quartile categories. Nonetheless, suppose the researcher is determined
that a mediational relationship is the most appropriate explanation for the data. He or she can test the model
http://www.ijSciences.com Volume 1, Issue Nov 2012
14
of observations that match the predicted pattern are understandably fewer than were previously correctly classified. As can be seen in Figure 8, seventy-five of the original 226 observations matched the predicted pattern (shaded cells in the figure). In other words, the predicted link from Paternal Parenting to Child Internalizing Behavior existed for only 33.19% of the sample. For this third of the sample, children who experienced increasingly negative paternal parenting
internalizing behaviors. The majority of the sample (151 individuals), however, did not fit the pattern predicted under the mediation model. The randomization test nonetheless indicated that the observed proportion of matches (.3319) was met or exceeded by chance only three times in 1000 trials, resulting in a c-value of .003. The minimum random proportion of matches obtained in the randomization test was .17 and the maximum was .35.
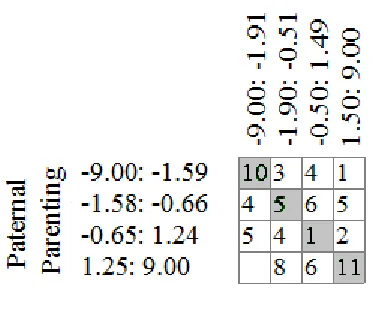
Figure 8.Multigram for Paternal Parenting and Child Internalizing Behavior using pattern analysis. To test the final step in the mediation model, the
model is built and tested using the first ordering (i.e., the predictor) as the cause of the second ordering (i.e., the mediator). Thus, thinking in terms of cause and effect, the mediator should conform to (be explainable by) the predictor. For the current example, it is expected that increasingly higher (or lower) scores on Marital Conflict will be paired with increasingly higher (or lower) scores on Paternal Parenting. In other words, those who experience more (or less) marital conflict are predicted to also exhibit worse (or better) parenting behaviors. Individuals with all other combinations of data (e.g., those with high scores on Marital Conflict and low scores on Paternal Parenting) do not fit the hypothesized mediation model. Recall that for mediation to be demonstrated the individual must be traceable through all three orderings. Hence this final step included only those 75 individuals that matched the predicted pattern when linking Paternal Parenting to Child Internalizing Behavior. The other 151 individuals have already been shown to not fit the
predicted mediation model and therefore do not need to be included in further analyses.
http://www.ijSciences.com Volume 1, Issue Nov 2012
15
Figure 9.Multigram for Marital Conflict and Paternal Parenting using pattern analysis. In all, the results for the mediation model are not
impressive. Although the observed proportion of matches in both steps (viz., linking Paternal Parenting to Child Internalizing Behavior and then Marital Conflict to Paternal Parenting) were unlikely to occur by chance, as demonstrated by the low c-values, the actual proportion of individuals who fit the pattern was quite low. There were only 27 individuals out of the original 226 who demonstrated the complete predicted mediation pattern. The remaining 199 individuals did not fit the mediation model in some way. These data represent another example of the inconsistency that often exists between what is found by analyses done at the aggregate level and what is actually demonstrated at the individual level. A meager 11.95% (27 / 226 * 100) of the total sample exhibited the full sequence of the proposed mediation model (predictor-mediator-outcome). That is, less than 12% of the sample matched the full sequence of the proposed mediation model that – for example – the individual scores high on Marital Conflict, high on Paternal Parenting, and high on Child Internalizing Behavior. The vast majority of the sample deviated from the predicted pattern in some way. Finally, it should be noted that efforts to improve these results by using different units of definition for the three orderings were not successful.
Discussion
Psychologists have generally failed to undertake the scientific task of establishing the continuous quantitative structure of the attributes they study. Michell (2011) states this clearly and forcefully, “There is no evidence that the attributes that psychometricians aspire to measure (such as abilities, attitudes and personality traits) are quantitative…All the evidence is that these attributes are merely ordinal…” (p. 245). What is particularly distressing is
http://www.ijSciences.com Volume 1, Issue Nov 2012
16
question.
The second path psychologists can follow is to drop the assumption that all attributes are structured as continuous quantities. Michell (2011) argues convincingly that this is an unfounded assumption, and it is one that is hindering scientific progress in psychology. Like other scientists, psychologists should adapt their methods to the things (people, attributes, etc.) they are studying, which is opposite of the current strategy of forcing psychological attributes into statistical and psychometric molds. Common sense dictates that science is not solely concerned with continuous quantities, a point made by Johnson in 1936 when psychologists were first directly confronted with the issue of measurement, "Those data should be measured which can be measured; those which cannot be measured should be treated otherwise. Much remains to be discovered in scientific methodology about valid treatment and adequate and economic description of non-measurable facts." (p. 351).
Observation Oriented Modeling (OOM) is one alternative that does not require the assumption of continuous quantity. While not as mathematically complex as structural equation modeling, multilevel modeling, or item response theory, it nonetheless provides a flexible and compelling framework for conceptualizing and analyzing data. In a general sense, it prompts investigators to expend more “shoe leather” (Freedman, 1991) in order to think more deeply what they are investigating and to make the observations necessary to corroborate their theories. More specifically, it challenges investigators to develop integrated models (see Grice, 2011; Grice et al., 2012) that explicate how the observations are to be made in accord with how things or qualities in nature (e.g., attributes, behaviors, etc.) are ordered. Examples of integrated models are Bohr’s early model of the atom and biological models like the Kreb’s cycle or the biochemical pathways of a Eukaryotic cell. Ideally, Donnellan et al. (2005) and Kaczynski et al. (2006) would have developed integrated models which could then have been used to guide the analyses above. Even without such models in hand, however, a number of advantages to OOM over traditional methods can be gleaned from the analyses.
First and foremost, psychologists are reminded that causes inhere in the people who volunteered for the two studies, and that a truly causal (integrated) model entails a certain pattern of observations. Consider the first study above. Marital negativity was
such that it would cause more negativity in their romantic relationships as young adults. However, the marital negativity itself was hypothesized to first cause an un-nurturing form of parenting which would then cause the problems in the young adults’ relationships. As presented by Donnellan et al. (2005) the model is primarily an efficient cause model. Efficient causes, as understood by Aristotle, are the necessary things or events that precede an effect in time. Classic stimulus-response (S R) models in psychology are perhaps the best known examples of such causal reasoning, and Donnellan et al.s’ longitudinal research design and mediation model clearly invoke efficient causes. Imagine a married couple on the first testing occasion who demonstrated positive marital interactions. This positivity is considered to be necessary for parenting that is nurturing. Even though the observations were collected on the same occasion, the observations are arranged in an efficient cause manner (positive parenting parental nurturing) because the formation and development of the marital relationship is understood to typically precede child-rearing. Finally, given the positive marital interactions and nurturing parenting that follows, the adolescent should be observed to engage in positive behaviors in his or her romantic relationship. As an efficient cause model, each cause precedes its effect in time, much like a line of dominoes falling in sequence once the first domino is toppled. If an integrated model were available, more specific details regarding exactly how the causal sequence unfolds could be elaborated with the understanding that such a model must be tested at the level of the observations; that is, at the level of the persons in the study who are in some ways the instruments of the causal processes. Aggregate statistics underlying most modern statistical procedures, such as means, variances, and covariances, are largely irrelevant to this task. As shown in the examples above, variable-based results are not directly applicable to the persons in the study, regardless of concluding statements such as “full mediation” or “partial mediation.” What is relevant to the task are the observations themselves and whether or not they are largely consistent with an expected pattern derived from an integrated model.
http://www.ijSciences.com Volume 1, Issue Nov 2012
17
interaction negative nurturing parenting negative romantic interaction” would also fit the efficient cause model. What constitutes negative interactions or parenting? What of scores in the middle of the scale ranges? Such questions are avoided in structural equation modeling or other variable-based modeling methods because continuous quantitative measurement is assumed. When using OOM, however, this assumption is not made and so the researcher must rethink how observations are to be made and recorded in ways that are more consistent with the natures of the attributes under investigation. There is no evidence that parental nurturing, for instance, exists as a continuous quantity. The two studies above would therefore profit from simpler assessments or from simpler methods of coding behaviors. Single items have been shown to yield equally valid data in a number of domains (e.g., see Brown & Grice, 2011; Nagy, 2002), and simple behavioral checklists have been shown to yield impressive predictive validity (see Barrett, 2008). By using simpler methods more attention can be paid to what the observations actually mean and whether or not they are constructed in manners consistent with the attributes under investigation. The shift is therefore toward greater conceptual clarity and away from relying on statistical methods (based on dubious assumptions) to ensure meaningful results. Moreover, and perhaps most importantly, the scientific task of measurement is not ignored.
Third, when determining how observations are to be ordered for the investigation, the scientist is concerned with causal structure rather than statistical power. The goal of inferential statistics in the social sciences is the estimation of abstract population parameters, such as population means and population correlations. In this context large sample sizes are often sought in order to insure adequate statistical power. With OOM, the estimation of population parameters is eschewed. As shown above, the goal is instead to assess whether or not the observed patterns within the observations conform to a causal model. A probability statistic, the c-value, is employed, but it is entirely secondary to the Percent Classification Index and graphical procedures such as the multigram. The so-called “inter-ocular test” (viz., the effect should “hit you between the eyes” if it is notable) takes on added importance in OOM and seems to fit nicely with Freedman’s shoe-leather metaphor. Rather than relying on arbitrary conventions to determine the magnitude of an effect size (e.g., d = .50 is interpreted as a medium effect), the researcher works
which are transparent and understandable, likely even to lay persons. Empty categories (units of observation) will also be considered as undesirable because they hinder the assessment of the integrated model. Once the units of observation are determined, then, the investigator must go about insuring that an adequate number of observations are made for each. A common problem with presumed continuous measurement in psychology is the use of scales with numerous points, most of which are never (or rarely) observed. When using a questionnaire that yields scores ranging from 0 to 100 to study introversion, for example, a psychologist studying a sample of 200 participants will not observe many (perhaps even most) of the scale points, particularly the relatively low and high scale values. With OOM this problem is avoided because the investigator generates an integrated model and necessary methods to insure that adequate numbers of observations are obtained for each ordered unit. This is important because the generalization the researcher is trying to make is based upon the causal model, hence sufficient observations must be made for the units of the model for the researcher to have sufficient confidence in the distinctiveness of the pattern of observations. With traditional null hypothesis testing the generalization is from a sample statistic to a population statistic, and this generalization is usually dependent upon assumptions (e.g., normal population distributions, homogeneous population variances) that are abstract and rarely met in practice. Most of these assumptions are avoided in OOM, which relies only upon the assumption of independence for the computation of the chance value.
http://www.ijSciences.com Volume 1, Issue Nov 2012
18
and final causes) with respect to interpersonal relationships, including those with their parents? For the second study above by Kaczynski et al., the most important question is, how can a cross-sectional research design offer compelling evidence for a mediation model in which time plays a critical role in what is understood to be an efficient cause process? No amount of statistical control using multiple regression or other techniques can enhance an efficient cause explanation of observations made in a purely cross-sectional design. An observational study tracing instances of marital conflict, parental parenting, and internalizing behaviors over time would be more appropriate for determining efficient causes.
Overall, then, these questions express a deeper appreciation for the material, efficient, formal, and final causes of natural systems, and the current variable-based system of model testing is simply not equipped to deal with such questions of structures and processes. A recent consortium of editors appears to agree (NIMH, 2000),
“We believe that traditional, variable-oriented, sample-based research strategies and data analytic techniques alone cannot reveal the complex causal processes that likely give rise to normal and abnormal behavior among different children and adolescents. To a large extent, the predominant methods of our social and psychological sciences have valued quantitative approaches over all others, to the exclusion of methods which might clarify the ecological context of behavioral and social phenomena” (p. 66).
There can be little doubt that a great deal of hard work is required to systematically build, refine, and expand upon an integrated model, but it is only in this way that psychology can hope to advance as a science and demonstrate the cumulative, systematic knowledge that characterizes the biological and physical sciences.
References
[1] Baron, R. M., & Kenny, D. A. (1986). The moderator-mediator variable distinction in social psychological research: Conceptual, strategic, and statistical considerations. Journal of Personality and Social Psychology, 51, 1173-1182.
[2] Barrett, P. (2008). The consequence of sustaining a pathology: Scientific stagnation – a commentary on the target article “Is psychometrics a pathological science?” by Joel Michell. Measurement, 6, 78-83.
Single-item measurement via the Dynamic
[4] Analog Scale. Sage Open, 1-10. DOI: 10.1177/2158244011428647
[5] Collins, L. M., Graham, J. W., & Flaherty, B. P. (1998). An alternative framework for defining mediation. Multivariate Behavioral Research, 33, 295-312.
[6] Donnellan, M. B., Larsen-Rife, D., & Conger, R. D. (2005). Personality, family history, and competence in early adult romantic relationships .Journal of Personality and Social Psychology, 88, 562-576.
[7] Faldowski, R. A. (2009). Rediscovering the individual in mediation analysis. Integrative Psychological and Behavioral Science, 43, 253-259.
[8] Fechner, G. T. (1860). Elemente der Psychophysik [Elements of psychophysics] (Vol. 1). Leipzig, Germany. Breitkopf & Härtel.
[9] Ferguson, A., Myers, C. S., Bartlett, R. J., Banister, H., Bartlett, F. C., Brown, W., Campbell, N. R., Craik, K. J. W., Drever, J., Guild, J., Houstoun, R. A., Irwin, J. O., Kaye, G. W. C., Philpott, S. J. F., Richardson, L. F., Shaxby, J. H., Smith, T., Thouless, R. H., & Tucker, W. S. (1940). Final report of the committee appointed to consider and report upon the possibility of quantitative estimates of sensory events. Report of the British Association for the Advancement of Science, 2, 331-349.
[10] Freedman, D. A. (1991). Statistical models and shoe leather. Sociological Methodology, 21, 291- 313.
[11] Gelfand, L. A., Mensinger, J. L., & Tenhave, T. (2009). Mediation analysis: A retrospective snapshot of practice and more recent directions. Journal of General Psychology, 136, 153-176.
[12] Grice, J. W. (2011). Observation oriented modeling: Analysis of cause in the behavioral sciences. San Diego, CA: Academic Press.
[13] Grice J.W., Barrett P.T., Schlimgen L.A., Abramson C.I. (2012) Toward a Brighter Future for Psychology as an Observation Oriented Science. Behavioral Sciences, 2(1), 1-22.
[14] Hölder, O. (1901). Die Axiome der Quantität und die Lehre vom Mass. Berichte über die Verhandlungen der Könglich Sächsischen Gesellschaft der Wissenschaften zu Leipzig, Mathematisch-Physische Klasse, 53, 1-46.
[15] Johnson, H. M. (1936). Pseudo-mathematics in the mental and social sciences. American Journal of Psychology, 48, 342-351.
[16] Judd, C. M., & Kenny, D. A. (1981). Process analysis: Estimating mediation in treatment evaluations. Evaluation Review, 5, 602-619.
http://www.ijSciences.com Volume 1, Issue Nov 2012
19
[18] Kazdin, A. E. (2007). Mediators and mechanisms ofchange in psychotherapy research. Annual Review of Clinical Psychology, 3, 1-27.
[19] Kenny, D. A., Kashy, D. A., & Bolger, N. (1997). Data analysis in social psychology. In D. Gilbert, S. T. Fiske, & G. Lindzey (Eds.) Handbook of Social Psychology (4th edition, Vol 1, pp. 233-265). New York: McGraw-Hill.
[20] Markus, K. A. & Borsboom, D. (2012). The cat came back: Evaluating arguments against psychological measurement. Theory & Psychology, 22, 452-466.
[21] Mason, W. M. (1991). Freedman is right as far as he goes, but there is more, and it’s worse. Statisticians could help. Sociological Methodology, 21, 337-351.
[22] Michell, J. (1997). Quantitative science and the definition of measurement in psychology. British Journal of Psychology, 88, 355-383.
[23] Michell, J. (2008). Is psychometrics pathological science? Measurement, 6, 7-24.
[24] Michell, J. (2011). Qualitative research meets the ghost of Pythagoras. Theory & Psychology, 21, 241-259.
[25] Nagy, M. S. (2002). Using a single-item approach to measure facet job satisfaction. Journal of Occupational and Organizational Psychology, 75, 77–86.
Psychopathology (2000). Editorial statement. Applied Developmental Science, 4(1), 66.
[27] Stevens, S. S. (1946). On the theory of scales of measurement. Science, 103, 667-680.
[28] Tremblay, P. F., & Gardner, R. C. (1996). On the growth of structural equation modeling in psychological journals. Structural Equation Modeling, 3, 93-104.
[29] Trendler, G. (2009). Measurement theory, psychology and the revolution that cannot happen. Theory & Psychology, 19, 579-599.
[30] Von Eye, A., Mun, E. Y., & Mair, P. (2009). What carries a mediation process? Configural analysis of mediation. Integrative Psychological and Behavioral Science, 43, 228-247.
[31] Webster, C. D., Harris, G. T., Rice, M. E., Cormier, C., & Quinsey, V. L. (1994). The violence scheme: Assessing dangerousness in high risk men. Toronto, Canada: University of Toronto, Centre of Criminology.