Blends of Unsaturated Polyester and Phenolic Resins for Application as
Fire-Resistant Matrices in Fibre-Reinforced Composites. Part 2: Effects of
Resin Structure, Compatibility and Composition on fire performance
Baljinder K. Kandola,* Latha Krishnan, Dario Deli, John R. Ebdon
Institute for Materials Research and Innovation (IMRI), University of Bolton, Deane Road,
Bolton, BL3 5AB, UK
*Corresponding author. Tel.: +44 1204903517; e-mail address: [email protected]
Keywords: unsaturated polyester, phenolic resole, blend, fire performance, thermal stability, cone calorimetry
Abstract
1. Introduction
Fire, smoke and toxicity standards for glass fibre-reinforced polymeric composites (GRPs) based on unsaturated polyesters (UP) and used in marine and mass transit systems especially, are closely monitored. UP resins burn readily in air, their aromatic contents from species such as styrene and phthalic acid functionalities, cause significant smoke generation [1]. Typical halogenated flame-retardant formulations used for UP systems serve the purpose of reducing flammability but consequent increases in the corrosiveness, toxicity and the smoke content of the resultant combustion products are major disadvantages. Inorganic additives such as alumina trihydrate reduce flammability and smoke production, but for them to be effective, very high quantities (typically > 50 wt%) are required, which cause processing problems and adversely affect the mechanical properties of laminates based on these resins [2–4]. Even chemically reactive type flame-retardant additives are usually required in concentrations > 30 wt% to be effective enough to pass commercial flammability tests [2, 3]. An environmentally friendly alternative is to blend the resin with another inherently flame-retardant and char-forming resin such as a phenolic [2, 3, 5] or melamine formaldehyde resin.
structures have been formed from UP and some phenolic resoles by vigorous dispersive mechanical stirring followed by a multistage curing regime [13, 14].
The main aims of this research are to reduce the flammability of UP by blending with compatibilized phenolic resoles (PH) [15], to study the effects of different PH on the flammability/fire retardancy of UP, and to understand the mechanisms of decomposition of different types of blends and how these impact upon fire peformance. Compatibilization strategies include the use of a common solvent, or the chemical functionalization of at least one of the components of the blend [13, 15]. Four different commercially available PH resoles, PH1, PH2, PH3 and PH4 have been selected and blended with a UP. PH1 is water soluble; PH2, although having structure similar to that of PH1, is ethanol soluble; PH3 is epoxy-functionalized; and PH4 is functionalized mainly with allyl groups. PH1 was chosen so that we could blend a traditional water-based resole with UP to give a reference, non-compatible system, whilst the three other resoles have been shown to have increased compatibility with UP in that PH2 employs a solvent (ethanol) with which both resins are compatible, PH3 is also isopropanol-based but in addition has the epoxy functionality, which may react during curing with any terminal carboxylic acid groups in the UP, and the allyl groups in PH4 have the potential to co-cure, free radically, with the carbon-carbon double bonds in the UP backbone and the styrene crosslinking monomer present in the UP. In Part I of this series of publications [13], the physical and chemical properties of cured UP/PH mixtures have been investigated, principally by differential scanning calorimetry (DSC), differential mechanical thermal analysis (DMTA), solid-state 13C-NMR spectroscopy and scanning electron microscopy (SEM). The results have shown that the compatibility of UP with PH increases in the order PH4 > PH3 > PH2 > PH1. In this part we describe our studies of the effects of PH structure and blend compatibility on fire performance.
2. Experimental
2.1. Materials
Crystic® 2.406PA, Scott-Bader: an unsaturated, phthalic anhydride-based UP containing 35– 40 wt% styrene, pre-accelerated with cobalt octoate.
Catalyst M, Scott-Bader: a methyl ethyl ketone peroxide-based radical catalyst for UP curing. Durez 33166, Sumitomo-Bakelite Europe N.V: a water-based phenolic resole containing 25– 30 wt% water (PH1).
Durez 33156, Sumitomo-Bakelite Europe N.V: an ethanol-based phenolic resole containing 20–29 wt% ethanol (PH2).
Plyophen 23983, Sumitomo-Bakelite Europe N.V: an isopropanol-based, epoxy-functionalized, phenolic resole containing 16–18 wt% isopropanol and <6 wt% water (PH3). Methylon 75108, Sumitomo-Bakelite Europe N.V: a solvent-free, allyl-functionalized, phenolic resole (PH4).
The chemical structures of these products have been given before [13]; all were used as received.
2.2. Casting and curing of resins and resin mixtures
A sample of cured UP resin was prepared by mixing 60 g resin with 2 wt% of catalyst M with a mechanical stirrer in a 100 mL beaker. 11 g of this mixture was then poured into a 5.5 cm diameter circular aluminium open mould to a depth of 3 mm. The specimen was then allowed to cure at room temperature for 24 h and post-cured at 80 ˚C in an oven for 4 h. Samples of PH resins (Table 1) were directly transferred to 5.5 cm diameter circular moulds (11 g in each case), again to depths of 3 mm, cured and then post cured by increasing the temperature slowly up to 200 ˚C; detailed curing conditions are given in Part 1 of this series of papers [13].
transferred to aluminium moulds, cured at RT for 24 h and then post cured by increasing the temperature slowly up to 190 ˚C; detailed curing conditions are again given in Part 1 [13].
2.3. Flammability study
2.3.1. Limiting oxygen indices
The limiting oxygen indices (LOI) of all cured resins and their blends were measured according to a standard method (BS 2782) using a Fire Testing Technology (FTT) LOI instrument equipped with an oxygen analyzer. At least five specimens of dimensions 100 mm × 10 mm × ca. 3 mm were tested for each sample.
2.3.2. Cone calorimetry
A cone calorimeter (Fire Testing Technology Ltd, UK) was used to assess the flammability parameters of the UP-based systems studied in this work. Circular samples measuring 55 mm in diameter with a nominal thickness of ca. 3 mm were fire tested in the horizontal mode with an ignition source at an applied heat flux of 50 kW/m2. Before testing, the bottom surfaces and the edges of the samples were wrapped with aluminium foil to ensure that only the top surfaces would be directly exposed to the heat source. A minimum of three tests were performed for each formulation.
2.3.3. Thermogravimetry-FTIR study
Thermogravimetric analyses (TGA) of all cured resins and their blends were performed on an SDT 2960 simultaneous DTA (differential thermal anlaysis) – TGA instrument from room temperature to 800 °C using 15 ± 1 mg samples heated at a constant rate of 10 °C/min in both air and nitrogen flowing at 100 ± 5 mL/min. The experiments were performed in duplicate and showed good reproducibility. Averaged data is presented. During the experiments in nitrogen and some of the experiments in air, the SDT 2960 simultaneous thermogravimetric analyzer was linked to a Nicolet Smart iTR iS10 FTIR spectrophotometer for the analysis of gases evolved during decomposition.
3. Results and discussion
3.1. Flammability of resins and resin blends
3.1.1. Limiting oxygen index (LOI)
Measurement of limiting oxygen index (LOI), the minimum concentration of oxygen expressed as a percentage that can support candle like flaming combustion of a polymer, is a quantitative method whereby the relative flammabilities of materials can be evaluated. An increase in the LOI value suggests an improvement in the resistance to ignition of materials being investigated.LOI values of all samples are given in Table 1. UP has a much lower LOI (17.9 %) than any of the PH, which is as expected. In general, all phenolic resins have LOIs higher than that of UP, indicating the lower flammability of phenolics. The order of LOI values for the pure cured resins is:
PH1 > PH2 > PH3 > PH4 > UP
This indicates that the unfunctionalized resins (PH1 and PH2) may have lower flammability than the functionalized resins and that the flammability increases with an increase in functionality.
presence of residual ethanol trapped in cured PH2 may account for its slightly higher ignitability (lower LOI). On the other hand, in PH3 some of the methylol group functionality is replaced by epoxy functionality, whilst in PH4 there are very few methylol groups, this resole relying principally upon high temperature cure of allyl groups in its normal commercial application as a surface coating material. Reducing the methylol content reduces the number of potential conventional (methylol plus methylol or methylol plus phenol) crosslinking sites within the cured phenolic component. Hence, the less cross-linked PH3 and PH4 resins have, as expected, lower LOIs.
The LOIs of the blends are between those of UP and PH and increase with increasing phenolic content, as can be seen in Table 1. The values for UP/PH1 blends are lower than weighted averages calculated from the values of the components (Table 1); this pattern has been reported before for incompatible blends of UP and PH and may be a consequence of the incompatibility, the unblended domains of UP acting as sources of ignition [14]. The values for all other blends are close to calculated values considering the probable error.
3.1.2. Cone calorimetry
Resins: The cone calorimetric fire performances of UP, phenolic resins and their blends
were evaluated at 50 kW/m2 heat flux. During burning of the PH1 and the UP/PH1 blend resins some spalling was observed. Phenolic resoles in general during curing release water, which can create voids in the cured samples. These voids during burning cause spalling, and delamination in the case of fibre-reinforced composites. In cured PH1 and UP/PH1 cast resins voids were visible and could not be avoided during the preparation stage, which is understandable as this is a water based resin. However, all other phenolic resins and their blends could be cured to give samples without any voids. Hence, these burnt smoothly without any spalling. The heat release rate (HRR), % mass and rate of smoke release (RSR)
As can be seen from Fig. 1(a) and Table 1, UP resin ignited at 40 s and burnt until 178 s, producing 78.9 MJ/m2 THR with a PHRR of 1053 kW/m2. Amongst the four phenolic resins, PH1 has highest TTI (84 s), followed by PH4 (72 s), while PH2 and PH3 ignite after 33 and 35 s, respectively. This trend is different from that expected from the LOI results. PH4, which has lowest LOI among the phenolic resins, has a much higher TTI than that of either PH2 or PH3. In general, even though phenolic resins are expected to have inherent flame-retardant properties, their TTIs are quite low. However, once ignited they burn slowly, with lower PHRR and THR compared with those of UP, as can be seen from Fig. 1(a). The lower flammability of phenolics is due to the greater number of relatively stable aromatic rings in their chemical structures [2, 15, 17] which, on heating, cross-link and char, whereas the UP resin decomposes into combustible volatiles, which burn. PH2 has the lowest PHRR of 452 kW/m2 with a THR of 37.6 MJ/m2. PH3 has a slightly higher PHRR (489 kW/m2) than that of PH2, but the THR is lower (34.2 MJ/m2) than that of PH2. PH4, on the other hand, has much higher PHRR (804 kW/m2) and THR (47.8 MJ/m2). This shows that PH2, PH3 and PH1 have lower flammability, whereas PH4 is more flammable despite its higher TTI. The char-forming ability of phenolics also follows the same trend as can be seen from Fig. 1(b) and the char yields given in Table 1. While UP is completely burnt away at the end of the experiment, the mass loss rates in all phenolics are lower than that of UP. PH1, PH2 and PH3 give 46–48 wt% residual char, whereas PH4 has higher mass loss rate than the other phenolic resins (see Fig. 1(b)) and leaves only 27% char residue at the end of the cone experiment. The smoke production in these PH resins also follows the same trend (Fig. 1(c)). High char-forming resins produce low smoke 594 – 965 m2/m2, whereas PH4 produces much higher smoke, 2209 m2/m2, although this is still lower than that of UP (4090 m2/m2), (see Table 1).
It is to be noted that PH1 is used only for comparative purposes. Since this is water based, it will normally not be used for blending with UP. Hence, the results for blends of UP with PHI, although useful for studying the effect of compatibility, are not subsequently discussed in the same depth as those for blends with the other PH resins.
Resin blends: In UP/PH blends, as can be seen from Table 1, TTI is little affected by the
of the UP is plotted. This indicates that since these blends are not intimately co-cross-linked, and that the UP ignites first. In the UP/PH4 blend, on the other hand, the TTI is much higher than that of UP and almost the same as the calculated average value. This could be due to the fact that the blend is co-cross-linked [13], and hence displays the ignition behaviour of a homogeneous material.
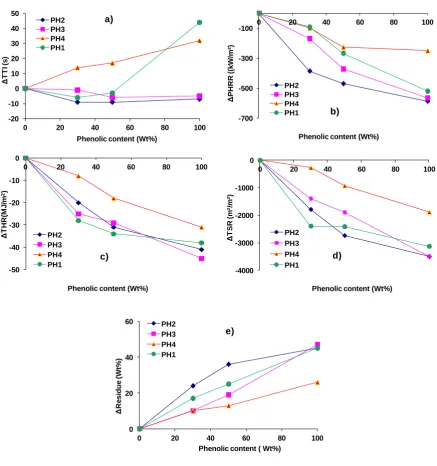
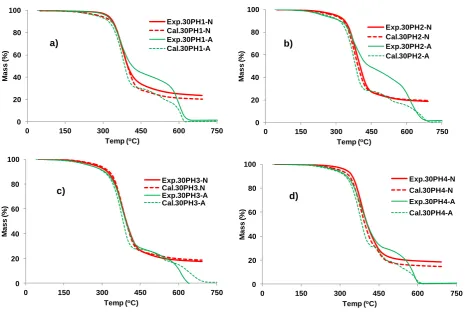
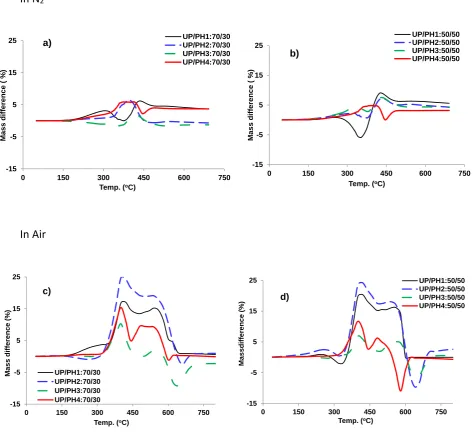
Most other parameters for the blends are between those of the pure phenolics and pure UP, and the influence of the PH increases with increasing PH content, as can be seen from Fig. 2. The results for UP/PH2 however, are particularly interesting: PHRR, THR and TSR values for the blend are much lower than expected based on consideration of average values or these parameters calculated from the results for the individual components, as shown in Table 1. These differences are not so pronounced in UP/PH1 and UP/PH3 blends, in particular not for 70/30 wt% ratios of components. The differences are least in UP/PH4; for the 70/30 wt% blend, values of PHRR, THR and TSR are similar (considering probable error) to the calculated values. The differences between measured and calculated average mass loss rates also follow the same trend, which is reflected by the higher than expected char yields in UP/PH1 and UP/PH2 shown in Table 1 and Fig. 2(e). The much higher than expected char yields for UP/PH2 blends can be clearly seen in Fig. 2(e). These results indicate that during thermal degradation of UP/PH2, there is some kind of interaction between the degradation products from each component. Whereas in UP/PH4 blends, which are more compatible and probably more fully co-cross-linked [13], the flammability is greater, although still lower than that of UP. In terms of smoke production, PH2 blends produce lower TSR than PH3 and PH4 blends. The trend in TSR is similar to those of the other flammability parameters.
In order to try to understand these trends in fire behaviour of UP/PH blends, thermogravimetric analyses (mass loss as a function of temperature) coupled with infrared spectroscopic analyses of gases evolved during degradation (TGA-FTIR) have been performed.
The thermal stability and degradation behaviour of the cured UP, the various PH and their blends have been studied by simultaneous DTA-TGA in both nitrogen and air atmospheres. Plots of mass loss as a function of temperature for all resins in nitrogen and in air are shown in Figs. 3 and 5 and the analyzed results of TGA, DTG (differential thermogravimetric analysis) and DTA in both atmospheres are tabulated in Table 2.
3.2.1. UP in nitrogen
The TGA mass loss curve of UP in nitrogen in Fig. 3(a) shows that up to ca. 180 oC, there is 0.9% mass loss, which can be attributed to volatilization of absorbed moisture, solvent and/or any unreacted monomers. There is a single-stage mass loss for UP between 183 and 462 oC with 94.8 % mass loss and DTG max at 383 oC, representing decomposition of the resin, in which polystyrene cross-links decompose releasing styrene and other volatiles, and the residual polyester backbone degrades [17–20]. That this is a single-stage decomposition is corroborated also by the appearance of a single endothermic DTA peak at 369 oC (Table 2(a)). The reactions contributing to this degradation process are discussed later.
3.2.2. UP in air
5.6 % mass loss, represents solid-state oxidation of char [18]. The decomposition stage is accompanied also by a small endothermic DTA peak at 352 oC, which is overlapped by a subsequent large exothermic DTA peak having a maximum at 404 oC; the exothermic peak arises from oxidation of volatile degradation products. The char oxidation stage is represented by an exothermic peak with maximum at 533 oC. As can be seen from Fig. 3(a), the resin decomposes completely by 575 oC, leaving no char residue. The detailed mechanisms of these reactions have been discussed elsewhere [17, 20] and are summarised in a later section.
3.2.3 PH resins in nitrogen
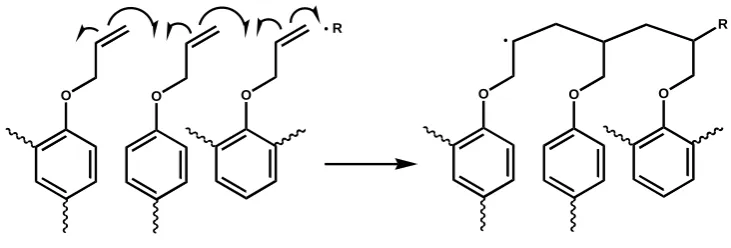
allyl groups, [26], rather than by reactions between methylol groups and phenol rings, as indicated in Fig. 4. Moreover, this curing almost certainly continues through the early stages of TGA heating since we have detected unreacted allyl groups in our relatively low-temperature cured PH4 prior to TGA analysis by solid-state C-13 NMR spectroscopy [13]. In common with other chain-reaction linked polymers, PH4 begins to degrade significantly only when the temperature approaches 400 C, at which point the previously polymerized allyl groups depolymerize with rapid disintegration of the network and the units from which it is comprised. This difference in network structure is probably the reason also why the char yield from PH4 is significantly less than those from PH1, 2 and 3.
3.2.4 PH resins in air
In air, the mass loss behaviour for the first small mass loss and subsequent decomposition stages are similar to the respective behaviour of each resin in nitrogen, ignoring small variations in degradation temperature and mass loss, which will be due to auto-oxidation reactions as with UP. There is an additional char oxidation stage in all resins in which >50 % mass loss occurs.
The DTA curves of all resins in air show only exothermic peaks (Table 2(b)). The broad endothermic peaks representing decomposition reactions and product volatilization are masked by the exothermic base line deviations/peaks representing oxidation of the evolved decomposition products. In PH1 there is no clear peak, whereas both PH2 and PH3 display an exothermic peak at 505 oC; in PH4 this peak occurs at a lower temperature (457 oC). The subsequent large exothermic peak due to the oxidation of the char is at a lower temperature in PH1 (601 oC) than in PH2 (671 oC), while in PH3 and PH4 there are double peaks at 569 + 629 oC and 593 + 611 oC, respectively. The decomposition of phenolic resin is reported to start with the release of water arising from further condensation reactions [27–29]. The released water may then assist in oxidation of methylene links to carbonyl groups [27, 30], which subsequently decompose, releasing CO, CO2 and other volatile products leaving, ultimately, char.
degraded completely in air, leaving no residual char. The temperatures at which zero residue was observed are 610, 697, 718 and 615 oC for PH1, PH2, PH3 and PH4, respectively. The masses of residues at 575 oC (the temperature at which UP is completely decomposed) for all phenolic resins are given in Table 1. For PH1, PH2 and PH3, the amounts of residue at 575 oC are similar (ca. 55 %), whereas for PH4 the amount of residue is much lower (28.8 %). Moreover, in PH1, PH2 and PH3, these residual amounts are only slightly higher in nitrogen than they are in air, whereas in PH4 the residual amount is much higher in nitrogen (42.8%). This indicates that PH4 is more readily oxidised than PH1, PH2 and PH3, which is consistent with PH4 undergoing a radical chain oxidation process, similar to that for UP, whereas PH1, PH2 and PH3, being more highly crosslinked and containing no readily depolymerizable chains, are more resistant to oxidation.
3.2.5 UP/PH blends in nitrogen and air
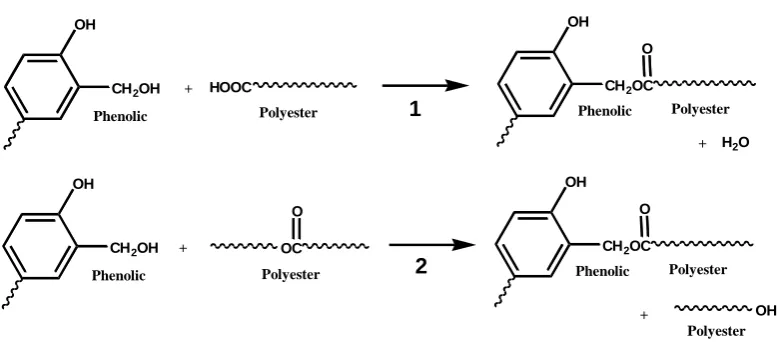
transesterifications between methylol groups and carboxylate links within the UP might also occur (Reactions 1 and 2, respectively, in Fig.7). It should be noted however that such reactions would compete with reactions between methylol groups and the ortho and para positions of phenolic nuclei, so their probabilities might be quite low. Esterifications and transesterifications are less likely for UP/PH3 and UP/PH4, owing to the replacement of most methylol groups with epoxy groups in the case of the former and allyl groups in the case of the latter (although there are possible reactions between epoxy groups and carboxylic acid groups in the case of UP/PH3). Even so, although such reactions would lead to additional crosslinking in UP/PH1 and UP/PH2, it is not obvious that such crosslinking would automatically lead to greater oxidative stability. This behaviour of UP/PH1 and UP/PH2 is discussed more fully later.
However, in terms of thermal stability and thermo-oxidative stability (reduced mass loss rates), all blends are better than UP, the best value being shown by UP/PH1. The UP/PH blends also show the same trends in flammability as in their thermal and thermo-oxidative stability.
3.3. Evolved gas analysis
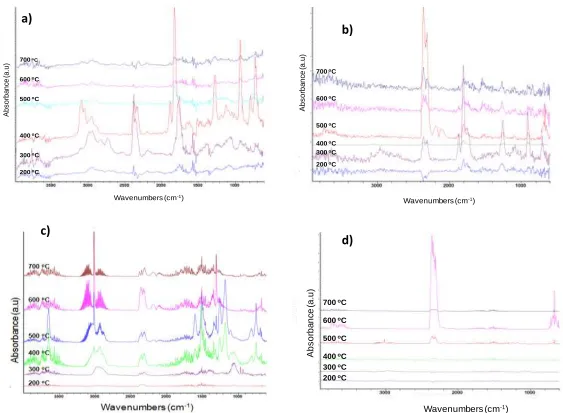
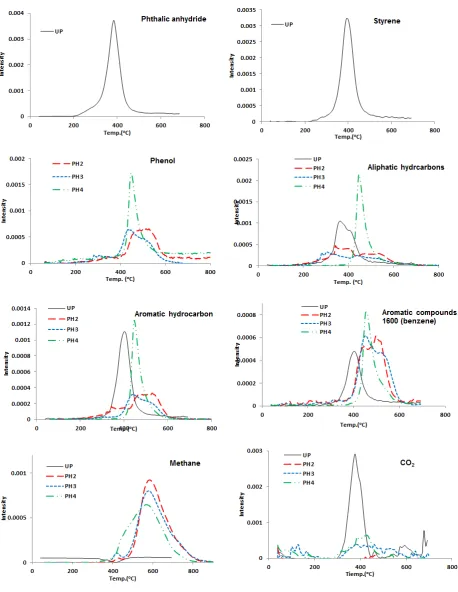
TG-FTIR was used to analyse the gases evolved during the thermal decomposition of UP, PH resins and their blends in both nitrogen and air. In nitrogen, the pyrolysis products can easily be identified; in air, evolved gas analysis serves mainly to give an indication of the extent of oxidation of volatiles. Fig. 8 shows IR absorbance spectra recorded for volatile products of degradation of UP and one phenolic resin (PH2) at different temperatures in nitrogen and air. The intensities of bands in these spectra and those of other resins and resin blends were used to construct the plots of amount of degradation product versus temperature presented in Figs. 9 and 10. Band assignments are based mainly on the library of FTIR spectra of gases contained within the NIST WebBook [31] and on other literature [32–34] and these and the implications of the plots based on them are discussed below.
In the spectra recorded of gases evolved under nitrogen (Fig. 8(a)), the following assignments have been made:
CO2: 2360 cm-1, C=O stretch; 710 cm-1, O=C=O bending vibration. The peak at 2360 cm-1 has been used for quantitative analysis in Figs.9 and 10.
Phthalic anhydride: 1866 cm-1, C=O symmetric stretch; 1770 cm-1, C=O asymmetric stretch. The peak at 1866 cm-1 has been used for quantitative analysis.
Styrene: 700 cm-1,C–H bending vibration of phenyl ring
Compounds containing aliphatic (C-H) groups: 2980–2880 cm-1, C–H stretch. Within these bands, the intensity at the peak maximum of 2925 cm-1 has been used for quantitative analysis.
Benzenoid groups (compounds containing mono benzene ring such as styrene, phthalic anhydride, etc): 1600 cm-1, ring-breathing mode
Aromatic groups (compounds containing aromatic C–H): 3020–3200 cm-1. Within these bands, the intensity at the peak maximum of 3025 cm-1 has been used for quantitative analysis.
The total aromatic C–H band intensity measured at 3025 cm-1 will reflect the concentrations of all aromatic products eliminated from UP, particularly styrene, styrene oligomers and phthalic anhydride. Hence the growth and decay of this band in the FT-IR spectra mirrors, as expected, that at 700 cm-1 assigned to styrene and that at 1866 cm-1assigned to phthalic anhydride. The same applies also to the band assigned to phenyl rings at 1600 cm-1. Polyesters thermally degrade via a variety of chain scission and rearrangement reactions [17, 20]. The fact that the polyester backbones in the UP used here are derived from three aliphatic diols (ethylene glycol, propylene glycol and diethylene glycol) probably accounts for the aliphatic fragments (as measured from C–H band intensity at 2925 cm-1) appearing in the TG-FTIR traces over a range of temperatures, with two rate maxima, although some of this aliphatic intensity will arise from styrene monomer and oligomers. A further product released during the thermal decomposition of polyesters is CO2, which arises from decarboxylation of acid and ester groups. The trace of CO2 concentration vs. temperature in Fig. 10 shows that this reaction takes place between ca. 285 C and 445 C, with a maximum rate at ca. 375 C. Two of the steps that have been proposed for polyester thermal degradation [17, 20] are shown as Reactions 3 and 4 in Fig. 11. Note that these steps are depicted as heterolytic reactions; they may under some circumstances be homolytic (free radical) reactions.
Above 350 C in air, the major volatile product observed from UP is CO2. This is because the majority of degradation products oxidise in air. The concentration vs. temperature curve for CO2 evolution in air is shown in Fig. 10. Two stages of CO2 evolution can be seen: the first between 290 and 430 oC, with a maximum at ca. 385 oC, and the second between 430 and 562 oC. The first of these two stages represents decarboxylation (the same as in thermal decomposition in nitrogen), and the second, char oxidation. Total CO2 evolved is given in Table 3.
3.3.2. PH Resins
The volatiles identified in our FTIR spectra recorded on degrading PH resins include CO2, compounds containing aliphatic C–H, and aromatic species, all with peaks in similar positions to those in the spectra of the volatile degradation products from UP. However, additional assignments can be made:
Water: Small peak at 3911–3489 cm-1, with maximum at 3750 cm-1 Formaldehyde: Small peak at 1720–1740 cm-1, C=O stretch
Phenol: 3700–3603 cm-1, with maximum at 3647 cm-1, O–H stretch
Methane: 3300–2650 cm-1, with maximum at 3016 cm-1, C–H stretch [31]. In instances in which methane is a major constituent of the evolved gases, the characteristic P and R rotational fine structure of the methane spectrum is seen and measurement of methane band intensity from the central peak presents no problems. However, in some spectra, the peaks from methane are obscured by those from other aliphatics; in these cases, no attempts have been made to measure methane concentration.
Elimination of water from PH resins arises from additional crosslinking reactions that take place between methylol groups and phenol rings during TGA heating beyond the initial curing temperature, as mentioned above (although at higher temperatures, other dehydration reactions may also contribute to the elimination of water), whilst elimination of formaldehyde arises from conversion of dimethylene ether links to methylene links (Reactions 1–4 in Fig, 12)
mol-1,
f Go (hydrogen) = 0 kJ mol-1 [by definition]; f Go (ethane) = +68 kJ mol-1 and f Go (ethyne) = +209 kJ mol-1) [39].
In all PH resins, similar patterns of FT-IR peaks for evolved gases were observed, however, these gases were evolved at different temperatures and their concentration vs. temperature profiles were different. As can be seen from Fig. 9, phenol evolution from PH4 occurs over a narrower temperature range than from PH2 and PH3. Moreover in PH4 there is a single sharp concentration vs. temperature peak whereas in PH2 and PH3 the peaks are broad indicating that in PH4, phenol is more readily liberated. The quantity released is also higher in PH4 than in PH2 and PH3 (Table 3). This is a further indication that, because crosslinking of PH4 is primarily via polymerization of allyl groups (Fig. 4), the decomposition of PH4 occurs over a narrow temperature range as the allyl chains undergo depolymerization.
CO2 is produced in all samples at >300 oC. However, the quantities are small; no sharp peak for CO2 evolution can be seen in the relevant plots in Fig. 9. It has been suggested that CO2 may arise from the decarboxylation of minor carbonyl-containing oxidized structures in phenolic resins [40].
Evolution of compounds containing aliphatic C–H starts at around 200 oC in PH2 and PH3, and these compounds are evolved in two stages. The behaviour is very similar in both resins. In PH4, however, evolution starts at ca.400 oC and compounds containing aliphatic C–H are produced in one stage (maximum rate at 450 oC) and in large quantity compared to the other two resins (Table 3), again consistent with the different degradation pathway for PH4. Methane production in PH4 is also very different. In all resins it is detected at > 400 oC, but in PH4 there is a more rapid release.
out, however, that some of the aromatic products released at the higher temperatures are phenols stripped of OH groups, as has previously been suggested for the final stage of the resole degradation process [40].
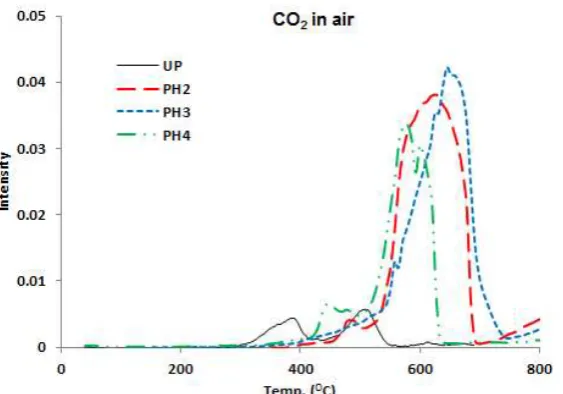
In air, the oxidation of the evolved products occurs much earlier in PH4 than in PH2 and PH3, indicated by CO2 production in Fig. 10, possibly because PH4 produces less char and so the char oxidation stage makes less of a contribution to CO2 production.
3.3.3. UP/PH resin blends
All the species identified in gases evolved during degradation of UP and PH resins in nitrogen, are found also in the gaseous degradation products from UP/PH resin blends, as can be seen from Fig. 9. However, while the yields of most products from the blends, such as phenol, methane, phthalic anhydride and styrene, lie between those of respective resin components, yields of CO2 are much higher than expected on the basis of resin composition; at present we have no explanation for this behaviour.
Quantitative analyses (Table 3) show that yields of phenols and phthalic anhydrides in blends are slightly lower than expected from calculated averages, while the yield of styrene is slightly higher. This may be a consequence of inter-resin reactions (esterifications and transesterifications) as shown in Fig. 7.
In air, the yield of CO2 is much higher for UP/PH4 blends than for the other blends; possibly this is a consequence of the higher aliphatic content of PH4 in form of the allyl groups compared with PH1, PH2 and PH3.
4. Conclusions
and co-cured blends of UP with PH1, PH2, PH3 and PH4 have been compared. The thermal and thermo-oxidative stabilities of all the blends were intermediate between those of the pure phenolics and UP. The stabilities of the unfunctionalized phenolic resins (PH1 and PH2) and blends based upon them are marginally better than products incorporating the functionalized resoles, PH3 and PH4.
The greater thermal and thermo-oxidative stabilities of UP/PH blends than of UP alone, translate into better fire performances for the blends as measured by LOI and cone calorimetric parameters, all of which show significantly higher LOI and significantly lower PHRR, THR and TSR than UP. The far greater char yields in the case of the blends compared with UP indicate that the major mechanism of fire retardance in these blends is a condensed phase one in which the phenolic component acts as the char former.
in which flame retardance would be minimal below the percolation threshold and only significant above it. This behaviour cannot be clearly discerned in any of the data displayed in Fig 13, although there is a suggestion of such behaviour in the plots of TTI and PHRR vs. blend composition for UP/PH1 co-cured blends. This is an aspect of the fire performance of UP/PH blends that requires further study.
Our work in this area continues, especially on alternative functionalizations of PH resins to aid co-curing with UP, on other char-forming resin additives, and on the mechanical properties of co-cured UP resin blends and of composite structures based upon them.
Acknowledgements
References
1. Walczak EK. Fire and Materials 1998; 22:253.
2. Kandola BK, Kandare E. Chapter 5 in: Horrocks AR, Price D, editors. Advances in fire retardant materials,. Cambridge: Woodhead Publishing Ltd, 2008. p. 398.
3. Kandola BK, Horrocks AR. Chapter 5 in: Horrocks AR, Price D, editors. Fire retardant materials, Cambridge: Woodhead Publishing Ltd, 2001.
4. Hörold S. Polym Deg Stab 1999; 64: 427.
5. Brown JR, St John NA. Trends Polym Sci 1996; 4: 416.
6. Koning C, Van Duin M, Pagnoulle C, Jerome R. Prog Polym Sci 1998; 23: 707. 7. Eidelman N, Simon Jr CG. J Res Natl Inst Stand Technol 2004; 109(2): 219.
8. Lin M-S, Chang R-J, Yang T, Shih Y-F. J Appl Polym Sci1995; 55: 1607; 1999; 72(4): 585.
9. Shaker ZG, Browne RM, Stretz HA, Classidy PE, Blanda MT. J Appl Polym Sci 2002; 84: 2283.
10. Park SJ, Park WB, Lee JR. Polymer J1999; 31(1): 28.
11. Tyberg CS, Bergeron K, Sankarapandian M, Shih P, Loos AC, Dillard DA, McGrath JE, Riffle JS, Sorathia U. Polymer 2000; 41: 5053.
12. Wan J, Wang S, Li C, Zhou D, Chen J, Liu Z, Yu L, Fan H, Li B-G, Thermochimica Acta 2012; 530: 32, and references cited therein.
13. Deli D, Kandola BK, Ebdon JR, Krishnan L. J Mater Sci 2013; 48: 6929. 14. Chiu H-T, Chiu S-H, Jeng R-E, Chung J-S. Polym Deg Stab 2000; 70: 505.
15. Kandola BK, Deli D and Ebdon JR. Compatibilised polymer blends. UK Patent Application. GB1121498.8. 2012.
16. Biswas B, Kandola BK. Polym Adv Technol. 2011; 22: 1192.
17. Kandola BK, Horrocks AR, Myler P, Blair D. In: Nelson GL, Wilkie CA, editors. Fire and Polymers, ACS Symp Ser 2001; 797: 344.
18. Levchik SV. In: Troitzsch J, editor. Plastics Flammability Handbook, 3rd edition. Munich: Hanser, 2004. p 86.
19. Learmonth GS, Nesbit A. Br Polym J 1972; 4: 317.
21. Crouzet C, Marchal J. J Appl Polym Sci 1979; 35: 151. 22. Buxbaum LH (1968) Angew Chem Int Ed 7:182 23. Bolland JL, Gee G. Trans Faraday Soc 1946; 42: 236.
24. Neiman B, Strizhkova AS, Levantoskaia II. J Polym Sci 1962; 56(164): 383. 25. Van Krevelen DW. Polymer 1975; 16: 615.
26. Reghunadhan Nair CP. Prog Polym Sci 2004; 29: 401. 27. Jackson WM, Conley RT. J Appl Polym Sci1964; 8: 2163. 28. Jha V, Banthia AK, Paul A. J Thermal Anal 1989; 35:1229. 29. Lenghaus K, Qiao GG, Solomon DH. Polymer 2000; 41:1973. 30. Morterra C, Low MJD. Carbon 1985; 23: 525.
31. NIST Chemistry WebBook (webbook.nist.gov/chemistry/ as at April 2013)
32. Wu K, Song L, Hu Y, Lu HD, Kandola BK, Kandare E. Prog Org Coat 2009; 65: 490. 33. Zhu HM, Yan JH, Jiang XG, Lai YE, Cen KF. J Hazard Mater 2008; 153: 670.
34. Cardona F, Rogers D, Van Erp G. J Thermoplas Comp Mater 2007; 20: 601. 35. Ravey M. J Polym Sci Chem1983; 21: 1.
36. Lin J-M, Ma C-CM. Polym Deg Stab 2000; 69: 229. 37. Trick KA, Saliba TE. Carbon 1995; 33: 1509.
38. Shulman GP, Lochte HW. J Appl Polym Sci 1966; 10(4): 619.
39. Haynes WM, edior. CRC Handbook of Chemistry and Physics, 94th Edition, Section 5, CRC Press, Boca Raton, 2013.
Table and Figure Captions
Table 1. Limiting oxygen index and cone results of cast resin samples of UP, UP, PH1, PH2, PH3, PH4 and blend with UP at 50 kW/m2.
Table 2(a). DTA – TGA analysis in nitrogen
Table 2(b). DTA – TGA analysis in air.
Table 3. Quantitative analysis of peaks of Figs. 9 and 10.
Figure 1. a) HRR; b) mass loss and c) rate of smoke release versus time curves for UP, PH1, PH2, PH3 and PH4 resins at 50 kW/m2 external heat flux.
Figure 2. Effect of phenolic content on a) TTI, b) PHRR, c) THR, d) total smoke production and e) % residual mass in UP-PH blends.
Figure 3. TGA curves of cured UP and phenolic (PH1, PH2, PH3, PH4) resins in air and N2. Figure 4. Crosslinking of PH4 via radical polymerization of allyl groups.
Figure 5. TGA curves of 70:30 blends of UP and phenolic (PH1, PH2, PH3, PH4) resins in air and N2.
Figure 6. Mass difference between experimental and calculated curves as a function of temperature for UP/PH:70/30 and UP/PH:50/50 in a), b) N2 and c),d) air.
Figure 7. Possible esterifications (Reaction 1) and transesterifications (Reaction 2) between PH and UP resins.
Figure 8. FTIR of evolved gases: a) UP in N2, b) UP in air, c) PH2 in N2 and d) PH2 in air. Figure 9. Absorbances of pyrolysis products (a–f) for UP, PH2, PH3 and PH4 as a function of temperature.
Figure 11. Steps in the thermal degradation of UP. Reactions 1–4 correspond to the main decomposition stage in Table 2 (a and b).
Figure 12. Reactions suggested for liberation of water (Reactions 1, 2 and 3), formaldehyde (Reaction 4) and phenolic compounds (Reactions 5, 6 and 7) from PH resins during further heating beyond the curing temperature. Reactions 1–4 correspond to stage 1 (plus 2 in PH3) and 5–7 to stage 2 (stage 3 in PH3) of mass loss in Table 2 (a and b).
Figure 1. a) HRR; b) mass loss and c) rate of smoke release versus time curves for UP, PH1, PH2, PH3 and PH4 resins at 50 kW/m2 external heat flux.
0 200 400 600 800 1000 1200
0 50 100 150 200 250
HRR (kW /m² ) Time (s) UP PH1 PH2 PH3 PH4 0 20 40 60 80 100
0 50 100 150 200 250
% M as s Time (s) UP PH1 PH2 PH3 PH4
b)
0 10 20 30 40 50 60 700 50 100 150 200 250
Figure 2. Effect of phenolic content on a) TTI, b) PHRR, c) THR, d) total smoke production and e) % residual mass in UP-PH blends.
-700 -500 -300
-100 0 20 40 60 80 100
Δ PH R R ((k W /m ²)
Phenolic content (Wt%) PH2 PH3 PH4 PH1 -50 -40 -30 -20 -10 0
0 20 40 60 80 100
Δ T H R (M J /m 2)
Phenolic content (Wt%) PH2 PH3 PH4 PH1 c) -20 -10 0 10 20 30 40 50
0 20 40 60 80 100
Δ T T I (s )
Phenolic content (Wt%) PH2 PH3 PH4 PH1 a) -4000 -3000 -2000 -1000 0
0 20 40 60 80 100
Δ T SR (m ²/ m ²)
Phenolic content (Wt%) PH2 PH3 PH4 PH1 d) 0 20 40 60
0 20 40 60 80 100
Δ R e s id u e (W t% )
Figure 3. TGA curves of cured UP and phenolic (PH1, PH2, PH3, PH4) resins in air and N2. 0 20 40 60 80 100
0 150 300 450 600 750
M
as
s
(%
)
Temp (oC)
UP-A UP-N a) 0 20 40 60 80 100
0 150 300 450 600 750
M a s s (% )
Temp (oC)
PH1-A PH1-N b) 0 20 40 60 80 100
0 150 300 450 600 750
M a s s (% )
Temp (oC)
PH2-A PH2-N c) 0 20 40 60 80 100
0 150 300 450 600 750
M a s s (% )
Temp (oC)
PH3-A PH3-N d) 0 20 40 60 80 100
0 150 300 450 600 750
M a s s (% )
Temp (oC)
PH4-A PH4-N
O O O O O R
O R
.
.
Figure 5. TGA curves of 70:30 blends of UP and phenolic (PH1, PH2, PH3, PH4) resins in air and N2.
0 20 40 60 80 100
0 150 300 450 600 750
M a s s ( % )
Temp (oC)
Exp.30PH1-N Cal.30PH1-N Exp.30PH1-A Cal.30PH1-A a) 0 20 40 60 80 100
0 150 300 450 600 750
M a s s ( % )
Temp (oC)
Exp.30PH2-N Cal.30PH2-N Exp.30PH2-A Cal.30PH2-A b) 0 20 40 60 80 100
0 150 300 450 600 750
M a s s ( % )
Temp (oC)
Exp.30PH3-N Cal.30PH3.N Exp.30PH3-A Cal.30PH3-A c) 0 20 40 60 80 100
0 150 300 450 600 750
M a s s ( % )
Temp (oC)
In N2
In Air
Figure 6. Mass difference between experimental and calculated curves as a function of temperature for UP/PH:70/30 and UP/PH:50/50 in a), b) N2 and c),d) air.
-15 -5 5 15 25
0 150 300 450 600 750
M a s s diff e re nc e ( % )
Temp. (oC)
UP/PH1:70/30 UP/PH2:70/30 UP/PH3:70/30 UP/PH4:70/30 a) -15 -5 5 15 25
0 150 300 450 600 750
M a s s diff e re nc e ( % )
Temp. (oC)
UP/PH1:50/50 UP/PH2:50/50 UP/PH3:50/50 UP/PH4:50/50 b) -15 -5 5 15 25
0 150 300 450 600 750
M a s s diff e re nc e (% )
Temp. (oC)
UP/PH1:70/30 UP/PH2:70/30 UP/PH3:70/30 UP/PH4:70/30 c) -15 -5 5 15 25
0 150 300 450 600 750
M a s s diff e re nc e (% )
Temp. (oC)
OH
CH2OH + HOOC
OH
CH2OC O
Polyester Polyester
Phenolic Phenolic
OH
CH2OH
Phenolic
OC O
+
OH
CH2OC O
Polyester Phenolic
Polyester
+ OH
Polyester + H2O 1
2
Figure 8. FTIR of evolved gases: a) UP in N2, b) UP in air, c) PH2 in N2 and d) PH2 in air.
300 oC
500 oC
400 oC
200 oC
700 oC
600 oC
Wavenumbers (cm-1)
A b s o rb a n ce (a .u )
200 oC 300 oC 400 oC 500 oC 600 oC 700oC
(a .u ) A b s o rb a n ce (a .u )
Wavenumbers (cm-1)
a)
600 oC
500 oC
400 oC
300 oC
200 oC
700 oC
Wavenumbers (cm-1)
34
35
36 O O O O O + O O O 1 O O O O
C6H5
C6H5
O
O O
O
C6H5
C6H5
.
.
C6H5
C6H5
C6H5
C6H5
C6H5
C6H5
.
Styrene monomer and oligomers A
B C B C
2 R O O R O O R OH O R O O H + R O OH O H R OH OH O + O In-chain sequence
Hydroxyl chain end
3
4
37
CH2OH
OH
OH
OH
OH
CH2 H2O
OH HOH2C
HO
OCH2
HO
H2O
OH HO
HOH2C
O
HOH2C
H2O
CH2OCH2
OH HO
CH2
OH HO
HCHO
+ +
+ +
+ +
+
CH2 CH2
OH OH OH
CH2
H3C CH3
OH OH
CH3
OH
1
2
3
4
5 6 7
38
40
Table 1. Limiting oxygen index and cone results of cast resin samples of UP, UP, PH1, PH2, PH3, PH4 and blend with UP at 50 kW/m2
Sample LOI
Cone results Char residue from TGA at
575oC TTI
(s)
FO (s)
PHRR (kW/m²)
THR (MJ/m2)
TSR (m²/m²)
Residue (%)
In air (%) In N2 (%)
UP 17.9 40 178 1053 78.9 4090 1 0.4 4.3
PH1 31.8 84 175 534 41.0 965 46 54.1 61.8
UP/PH1:70/30 20.7 (22.1) 34 (53) 117 (177) 962 (897) 51.0 (67.5) 1700 (3152) 18 (15) 28.9 (16.5) 25.9 (33.0)
UP/PH1:50/50 21.3 (24.9) 37 (62) 153 (176) 787 (793) 44.6 (60.1) 1683 (2527) 26 (24) 42.3 (27.3) 39.3 (27.3)
PH2 23.0 33 156 452 37.6 594 46 55.5 58.6
UP/PH2:70/30 19.5 (19.4) 31 (38) 178 (171) 630 (872) 62.3 (66.5) 2307 (3278) 24 (15) 32.9 (16.9) 20.4 (20.6)
UP/PH2:50/50 19.8 (20.4) 31 (37) 156 (167) 568 (752) 48.4 (58.2) 1357 (2342) 37 (24) 43.3 (27.9) 36.8 (31.5)
PH3 23.1 35 145 489 34.2 603 48 54.9 58.0
UP/PH3:70/30 18.7 (19.5) 39 (39) 148 (168) 885 (883) 54.3 (65.5) 2699 (3043) 11 (16) 17.3 (16.7) 19.0 (20.4)
UP/PH3:50/50 19.7 (20.5) 34 (38) 151 (162) 682 (771) 49.6 (56.6) 2203 (2346) 20 (25) 32.6 (27.6) 35.5 (31.1)
PH4 22.2 72 216 804 47.8 2209 27 28.8 42.8
UP/PH4:70/30 19.0 (19.2) 54 (50) 179 (189) 955 (978) 70.7 (69.6) 3819 (2929) 11 (9) 13.5 (8.9) 19.6 (15.9)
UP/PH4:50/50 19.6 (20.1) 57 (56) 201 (197) 828 (928) 61 (63.3) 3166 (3149) 14 (14) 4.0 (14.6) 27.1 (23.6)
Note: 1. The variation in values for different parameters are as: TTI = ± 2; PHRR = ± 32; THR = ± 2.3; EHC = ± 1.8; TSR = ±150; residue % = ±4
41 Table 2(a). DTA – TGA analysis in nitrogen
Sample Resin UP/PH : 70/30 UP/PH : 50/50
Temp range (oC)
Mass loss (%)
DTG max (oC) DTA (Endo) peak
max (oC)
Temp range (oC)
Mass loss (%)
DTG max (oC)
DTA peak max (oC)
Temp range (oC)
Mass loss (%)
DTG max (oC)
DTA peak max (oC)
UP RT-183
183-462 0.9
94.8 383 369
PH1 RT-318
318-690 4.4 38.3 299 423,446,502 305 402 RT-260 260-691 1.6
74.6 379 370
RT-205 205-691
3.7
59.9 359 358
PH2 RT-315
315-690 4.6 41.0 270 315(s),346(s),439,500 277 317(s),347(s),399 RT-280 280-691 1.3 74.7
399 375 RT-280
161-691 4.4 61.6
376 362
PH3 RT-266
266-357 357-690 2.3 8.3 35.9 302 425,522(s) 301 402 RT-268 268-691 5.4
77.1 380 373
RT-263 263-691
1.6
65.7 376 365
PH4 RT-366
366-691 3.6
57.2 451 454
RT-260 177-691
3.7
77.9 382 381
RT-285 285-691
1.7
42 Table 2(b). DTA – TGA analysis in air
Sample Resin UP/PH : 70/30 UP/PH : 50/50
Temp range (oC)
Mass loss (%)
DTG max (oC)
DTA (Exo)
peak max (oC)
Temp range (oC)
Mass loss (%)
DTG max (oC)
DTA peak max (oC)
Temp range (oC)
Mass loss (%)
DTG max
(oC)
DTA peak max (oC)
UP RT-183
183-435 435-566 0.9 93.1 5.6 373 532 352(En,s); 404 533
PH1 RT-318
318-517 517-629 4.4 28.0 67.6 459 601 * 592 RT-260 260-491 491-660 1.6 57.9 39.3 371 603 353(En) 603 RT-260 260-549 549-601 3.7 48.4 45.7 353,408, 430 600 * 602
PH2 RT-315
315-422 422-567 567-693 8.3 10.3 25.8 55.9 336, 393 494 672 * 504 671 RT-278 278-523 523-699 7.2 52.2 39.1 222 371,402(s) 611 611 RT-287 287-526 526-716 8.5 25.1; 12.2 52.1 221 353,490 619 418, 490 617
PH3 RT-266
266-454 454-552 584-760 7.0 8.8; 6.9 17.8 59.5 293, 410 504 569, 631 * 505 569, 629 RT-268 268-507 507-687 5.9 69.5 26.3 365,399(s) 610 *, 434 608 RT-263 263-510 510-710 6.2 54.0 38.6 217 362 612 * 610
PH4 RT-372
372-490 490-624 3.9 44.0 52.1 459 597,610(s) * 457 593,611(s) RT-260 260-486 489-623 4.3 67.2 28.5 379 587 * 417 583 RT-276 276-494 494-607 4.2 62.7 33.1 241 365,444 567 * 444 563 Note: s= small (shoulder peak) ; En =endothermic peak (all other peaks are exothermic
43 Table 3. Quantitative analysis of peaks of Figs. 9 and 10.
Note: The reported values are averages of two runs
The values in brackets and in italics are the calculated averages from individual components.
*Benzenoid compounds containing mono benzene ring, such as phenol, styrene, phthalic anhydride etc **Aromatic groups could include all possible aromatic groups
Sample
Gas evolved (FTIR peak (cm-1)); Intensity x 100
CO2 evolved in air CO2 (2360) ±0.05 Phenol (3647) ±0.19 Phthalic anhydride (1866) ±0.18 Styrene (709) ±0.49 Methane (3016) 0 Benzenoid compounds * (1600) ±0.17 Aromatic groups** (3025) ±0.29 Aliphatic groups (2925) ±0.19 UP
1.91 0.0 2.68 2.53 0.10 0.39 1.11 1.49 6.49
PH2
0.60 1.01 0 0 1.48 0.84 0.66 1.08 47.16
PH3
0.63 1.13 0 0 1.41 0.93 0.48 0.89 46.22
PH4
0.46 1.10 0 0 1.30 0.44 0.75 1.24 31.28
UP/PH2:50/50 2.04
(1.25) 0.74 (0.51) 0.82 (1.34) 1.32 (1.27) 1.27 (0.79) 0.47 (0.62) 0.54 (0.88) 0.85 (1.28) 28.37 (26.82)
UP/PH3:50/50 2.77
(1.27) 0.73 (0.56) 1.27 (1.34) 1.91 (1.27) 1.08 (0.76) 0.74 (0.66) 0.61 (0.79) 0.94 (1.19) 23.35 (26.36)
UP/PH4:50/50 2.01