*Corresponding author:Ravindra Bhaskar Nehete ISSN: 0976-3031
Research Article
ANALYTICAL METHOD VALIDATION FOR QUANTIFICATION OF MELAMINE
CONTENT IN IGURATIMOD
Ravindra Bhaskar Nehete and Pushpendra Sharma
Sri Satya Sai University of Technology & Medical Sciences, Sehore
DOI: http://dx.doi.org/10.24327/ijrsr.2018.0902.1614
ARTICLE INFO ABSTRACT
Melamine is an organic base and a trimer of cyanamide, which have been implicated as contaminants or biomarkers in Chinese protein adulterations.
Melamine is described as "Harmful if swallowed, inhaled or absorbed through the skin. Chronic exposure may cause cancer or reproductive damage, Eye, skin and respiratory irritant". When melamine is absorbed into the bloodstream, they concentrate and interact in the urine-filled renal tubules, then crystallize and form large numbers of round, yellow crystals, which in turn block and damage the renal cells that line the tubes, causing the kidneys to malfunction. As limit of melamine content in Iguratimod is not more than 2.5 ppm per day, hence it needs to quantify melamine content with accuracy in Iguratimod. Hence it’s requirement for development and validation of analytical method for accurate and precise estimation of melamine content in Iguratimod.
Analytical method for melamine content in Iguratimod has been developed and validated for the determination of melamine in Iguratimod using liquid chromatography with ultraviolet-visible (UV-Vis) detector. The method has been validated for melamine content in Iguratimod.
Melamine is analyzed separately using LC column, Unisphere Extend C18 (250 x 4.6mm, 5µ). Commercially available, standard for Melamine was used for development and validation study. In this methodology, gradient mobile phase is used. For mobile phase-A, prepared 0.1N Tetrabutyl Ammonium hydroxide in Isopropanol and transferred 1ml of this solution to 1000ml water. HPLC grade Acetonitrile is used as mobile phase-B. Flow rate is 1.0ml/minute with 100% mobile phase-A for first 10 minutes, then gradually increased the ratio of mobile phase-B to elute Iguratimod and its possible impurities. Analytical column Unisphere C18 with length 250mm, internal diameter 4.6mm and particle size 5µ is used with wavelength 220nm. Limit of quantitation (LOQ) for melamine was 0.24ppm and LOQ for melamine is 0.72ppm. Analytical method validated as per ICH guideline Q2A, Validation of Analytical Methods, with specificity, LOD & LOQ, precision, linearity, accuracy, etc. Precision and accuracy was determined at lower and higher concentration with respect to specification level. This analytical method is user friendly, ease of use and found very much accurate to determine Melamine content in Iguratimod. By using this methodology to check quality, safe drug can be provided to the patient. Performance of this method may change when different equipment used or when different sample matrices are encountered.
INTRODUCTION
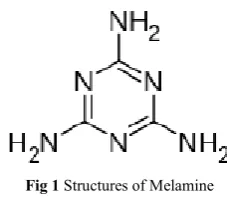
Melamine is an organic base and a trimer of cyanamide, with a 1,3,5-triazine skeleton. Melamine is also a metabolite of cyromazine, a pesticide. Melamine combines with acid and related compounds to form melamine cyanurate and related crystal structures, which have been implicated as contaminants or biomarkers in Chinese protein adulterations.
Structure Fig 1 Structures of Melamine
Melamine use as non-protein nitrogen (NPN) for cattle was described in a Melamine is sometimes illegally added to food
Recent Scientific
Research
International Journal of Recent Scientific Research
Vol. 9, Issue, 2(F), pp. 24187-24194, February, 2018
Copyright © Ravindra Bhaskar Nehete and Pushpendra Sharma, 2018, this is an open-access article distributed under the terms of the Creative Commons Attribution License, which permits unrestricted use, distribution and reproduction in any medium, provided the original work is properly cited.
DOI: 10.24327/IJRSR
CODEN: IJRSFP (USA)
Article History:
Received 10th November, 2017 Received in revised form 14th December, 2017
Accepted 08th January, 2018 Published online 28th February, 2018
Key Words:
products in order to increase the apparent protein content. Standard tests, such as the Kjeldahl and Dumas tests, estimate protein levels by measuring the nitrogen content, so they can be misled by adding nitrogen-rich compounds such as melamine. Melamine is added to food products in order to increase apparent protein content.
Melamine is described as "Harmful if swallowed, inhaled or absorbed through the skin. Chronic exposure may cause cancer or reproductive damage, Eye, skin and respiratory irritant". U.S. Food and Drug Administration (FDA) scientists explained that when melamine and cyanuric acid are absorbed into the bloodstream, they concentrate and interact in the urine-filled renal tubules, then crystallize and form large numbers of round, yellow crystals, which in turn block and damage the renal cells that line the tubes, causing the kidneys to malfunction.
Canada declared a limit of 0.35 mg and the US FDA's limit was put at 0.063 mg daily. Ingestion of melamine may lead to reproductive damage, or bladder or kidney stones, which can lead to bladder cancer.
As limit of melamine content in Iguratimod is not more than 2.5 ppm per day, hence it needs to quantify melamine content with accuracy in Iguratimod. Maximum daily dose for Iguratimod is 25 mg per day, and for patient’s safety, quantification of melamine content in Iguratimod is very much essential. Hence it’s requirement for development and validation of analytical method for accurate and precise estimation of melamine content in Iguratimod.
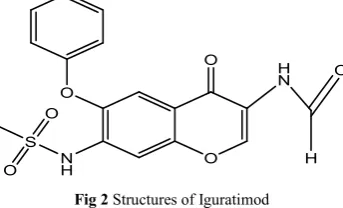
Chemically, Iguratimod
3-Formylamino-7-methylsulfonylamino-6-phenoxy-4H-1-benzopyran-4-one is used as an anti-inflammatory drug for the treatment of rheumatoid arthritis. It has following structure,
O O
O
N H S
O O
H
N O
H
Fig 2 Structures of Iguratimod
IUPAC name for Iguratimod is N-[(formylamino)-4-oxo-6-phenoxy-4Hchromen- 7-yl] methane sulfoanamide. Iguratimod was first Reported in product patent US4954518.[1] Its Therapeutic category is Anti-arthritic and novel immunomodulator.[2] Iguratimod is a nuclear factor NF-κB activation inhibitor used in the treatment of rheumatoid arthritis. It also suppressed inflammatory cytokine production in cultured human synovial cells induced by tumor necrosis factor (TNF)-α by inhibiting the activity of nuclear factor-κB. Several synthesis processes are reported for Iguratimod. [3-6]. Efficacy of a drug substance is critical for its safety assessment. It is compulsory to identify and characterize the possible impurities in active drug. This compound is aromatic heterocyclic compound; belong to class of organic compound known as chromones. These are compounds containing a benzopyran-4-one moiety.
Separation of active drug and possible impurities was determined by high performance liquid chromatography instrumental technique. Since literature did not cite such methodology for determination melamine content in Iguratimod, it was planned to develop a user friendly, selective, accurate and precise HPLC based methodology for determination of melamine content in Iguratimod.
Chromatographic technique is used in most of the cases for content analysis in active drugs as this technique is specific, accurate, precise, and user friendly. Chromatographic technique gets rid of tedious extraction and isolation procedures.
Chromatographic separation is multistage separation technique, in which the sample components are distributed in two phase’s i.e. stationary phase and mobile phase. Stationary phase is either solid or a liquid supported on a solid or a gel. Stationary phase packed in column, spread as layer and distributed as a thin film, or applied by appropriate technique. Mobile phase may be either gas or liquid / supercritical fluid. Separation is based on adsorption, mass distribution (partition), or ion exchange; or due to differences in physicochemical properties of the molecules, like molecule size, mass of molecule, and volume of molecules. This type of chromatography is used for qualitative and quantitative analysis by using different techniques.
Selection of suitable mobile phase, diluent and wavelength:
Development of an analytical method for assessment of residue content for drug substances as well as pharmaceutical dosage form is of utmost necessity. This is required to detect the impurities which are at lower level. As specification limit for melamine is very low as 2.5ppm, it is very much difficult to detect melamine by using normal method, which was used for quantification of impurities more than 0.1%. Development of an analytical method for assessment of melamine in drug substance is of utmost necessity to confirm the quality of drug substance.
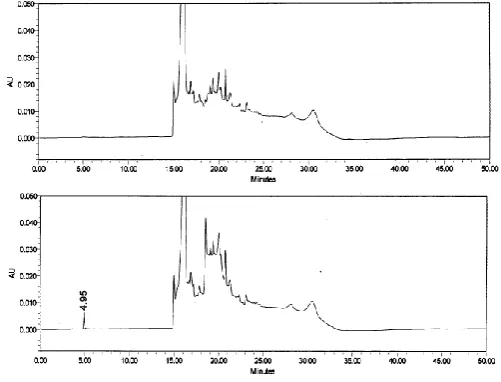
We reviewed the literature and observed the published literature for melamine content by triple quadruple tandem mass spectrometry (LC-MS/MS), Gas chromatography, etc. All these method are having complicated extraction process. During literature survey, observed the mobile phase preparation was with ammonium salt, mentioned in Laboratory Information Bulletin, LIB No. 4422, October 2008. Thus, we tried with different buffers of ammonium salts. Method optimized with aqueous buffer of Tetrabutyl ammonium hydroxide and acetonitrile, which gives sharp peak of melamine without co-elution or any interference. It was found that method is very robust and gets sufficient retention of the peak. Optimized chromatographic parameters are summarized in Table 1. Typical chromatograms are shown in Fig 3. This study was validated according to the guidelines of International Conference on Harmonization (ICH) and USP.
MATERIAL AND METHODS
Tetrabutyl ammonium hydroxide (0.1N in isopropyl alcohol) AR Grade
Mobile phase preparation and chromatographic conditions: Mobile Phase A: Mix 1ml of Tetrabutyl ammonium hydroxide (0.1N in isopropyl alcohol) in 1000ml water, mix well. Filter through 0.45µ membrane filter and degas.
Mobile Phase B: Acetonitrile
Diluent: Use Mobile phase-A as such as diluent
Chromatographic conditions: All analyses were done at 30°C
temperature with gradient flow. The mobile phase was run at a flow rate of 1.0 mL/minute for 50 minutes. Injection volume was 50μL for blank, standard and samples. The column eluent was monitored with UV detection at 220 nm.
Chromatographic Conditions
Instrument : HPLC equipped with Pump, Injector, UV detector and Recorder.
Column : Unisphere Extend C18, 250mm x 4.6mm, 5µ Flow rate : 1.0 mL/minute*
Detector : UV at 220nm. Injection volume : 50µL Column oven temp : 30°C Run time : 50 minutes
Approximate retention time for melamine peak : About 5 minutes
Table 1 Optimized chromatographic conditions and gradient program
Gradient program : Time
(minute)
Mobile Phase A (%)
Mobile Phase B (%)
0.0 100 0
10 100 0
15 20 80
25 20 80
30 100 0
50 100 0
Solution preparation
Standard preparation
Weigh accurately about 10 mg of Melamine standard and transfer in to l00 mL of volumetric flask, add about 40 ml diluent, Sonicate till dissolves and dilute up to the mark with diluent. Dilute 1.0 ml of this solution to 100 ml with diluent. Further dilute 1.0 ml of resultant solution to 10 ml with diluent (0.1 ppm).
Test solution: Weigh accurately about 400 mg of Iguratimod sample and transfer in 10 ml of volumetric flask and dilute up to the mark with diluent. Shake well and Sonicate for about 5 minutes, then filter through 0.45micron syringe filter.
System is suitable only if relative standard deviation for six replicate standard injections is not more than 10%.
Validation of proposed method
Proposed methodology is validated as per ICH guidelines, for the parameters like specificity, linearity, precision and accuracy etc.
System suitability and precision parameter
System suitability and precision parameters are to be set for verification that analytical system is suitable and working properly with accuracy and precision. System suitability was carried out for freshly prepared 0.1 ppm (2.5 ppm with respect
to test concentration) melamine standard solution by injecting in six replicates. As acceptance criteria for check of %RSD, proves that methodology is accurate and precise. RSD limit for area response is not more than 10%, whereas RSD for retention time is not more than 1%. The values were recorded in Table 2.
Table 2 System suitability and precision parameter
System suitability and precision parameter
Injection number
Area of Iguratimod standard (10ppm)
Retention time (minutes)
1 30299 4.95
2 30395 4.94
3 30386 4.94
4 30298 4.94
5 30295 4.93
6 30297 4.94
Average = 30328 4.94
SD = 48.2563 0.0063
%RSD = 0.16 0.13
Acceptance criteria = NMT 10.0% NMT 1.0%
From the Table 2, it can be concluded that the system suitability and precision parameters meet the requirements of method validation.
Validation
Specificity
Specificity is access by measuring the ability of a method to determine the possible components in presence of analyte such as impurities, degradation products, and matrix components. For this method, melamine content to be quantified at lower level i.e.2.5ppm in Iguratimod. Demonstration for absence of interference must be performed initially. Also co-elution is major concern during development. Peak purity can be calculated by using the photodiode detector and is calculated by HPLC software.
Recovery study can be performed during development, if satisfactory recovery is achieved for the methodology, method can be used. If not, method needs to be modified or new method to be developed.
Specificity parameter was carried out by using standard solution of melamine and diluent blank. Based on the data tabulated in Table 2, Fig. 3, analytical method is specific, that is there is no interference of blank, other impurities and active drug substance with melamine peak.
Linearity and Range
Linearity access the ability of assay to get a proportionate response to change in analyte concentration.
Some type of detector produce nonlinear responses, like Gas chromatography with flame photometric detector, evaporative light scattering or mass spectrometers may have limited linear range as compared to Ultraviolet-Visible detector, Flame ionization detectors etc, however specific ranges could be established for these type of detectors. Upper and lower concentration of analyte which shows precision, linearity, accuracy can be stated as range.
As per ICH, validation of analytical procedures: text and methodology Q2(R1), range for assay of drug substances is 80 -120% with respect to test concentration, for content uniformity of drug product range is 70- 130%, for impurity detection range is from reporting level to 120% of specification limit.
Key requirement of for range is accuracy, linearity and precision. There are several method ranges from simple observation to comprehensive statistical evaluations. Method choice will be normally vary to vary by pharmaceutical company policies. Specific methodology should be mentioned in protocol, if it nor mentioned in the standard operating procedure (SOPs). Criteria for linearity should be set prior to validation, e.g. For precision for each level in linearity, relative standard deviation (RSD) should be less than 3%, regression coefficient r2 should be greater than 0.995 with respect to predefined range. The requirements of validation parameters and acceptance criteria may vary by type of method, instrument, analyte, etc. RSD may vary greatly based on concentration level of analyte. For linearity minimum five concentration levels are analyzed and minimally in duplicate. Commonly practice is triplicate analysis and also followed by most of the pharmaceutical companies.
For linearity, solution with different concentration are being prepared and injected. The series of solutions should encompass the range of results expected from analysis of actual samples. The y-intercept value is a good indication of bias. If the y-intercept is 0, no bias exists. Bias exists if the y-intercept deviates from 0.
Linearity of the analytical method is ability to obtain the results, which are well defined mathematical transformation, in proportion with analyte concentration within working concentration range. Optimized analytical method has been validated as per ICH guidelines, standard solution injected in the between the concentration range of 0.72 ppm to 3.75 ppm. Area response obtained for each concentration level was tabulated. Linearity was plotted for area response on Y axis and applied concentration on X-axis. Correlation coefficient and squared correlation coefficient was found to be 0.995. Linearity plot and values are recorded in Table 4 and fig 4.
Regression analysis performed by plotting concentration (ppm) on X-axis and area response on Y-axis. Calculated standard
error on Y axis (Steyx) and slope of the linearity curve generated with concentration area response from table 4.
Table 3 Concentration levels i.e. actual and wrt test concentration (in ppm)
Sr. No. Concentration
level
Actual concentration (ppm)
Concentration wrt test (ppm)
1 LOD (10%) 0.0095 0.240
1 LOQ (30%) 0.0302 0.755
2 50% 0.0504 1.260
3 80% 0.0806 2.015
4 100% 0.1008 2.520
5 120% 0.1210 3.025
6 150% 0.1512 3.780
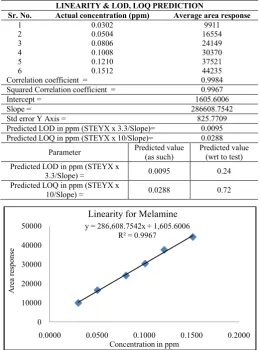
Table 4 Linearity different levels of concentrations and LOD, LOQ prediction
LINEARITY & LOD, LOQ PREDICTION
Sr. No. Actual concentration (ppm) Average area response
1 0.0302 9911
2 0.0504 16554
3 0.0806 24149
4 0.1008 30370
5 0.1210 37521
6 0.1512 44235
Correlation coefficient = 0.9984 Squared Correlation coefficient = 0.9967
Intercept = 1605.6006
Slope = 286608.7542
Std error Y Axis = 825.7709
Predicted LOD in ppm (STEYX x 3.3/Slope)= 0.0095 Predicted LOQ in ppm (STEYX x 10/Slope)= 0.0288
Parameter Predicted value (as such)
Predicted value (wrt to test) Predicted LOD in ppm (STEYX x
3.3/Slope) = 0.0095 0.24 Predicted LOQ in ppm (STEYX x
10/Slope) = 0.0288 0.72
Fig 4 Linearity Plot for Actual concentration (ppm) Area response
From the Table 4, it is clear that observed area response of Melamine versus actual concentration in ppm of Melamine is linear in the required concentration range. Correlation coefficient and squared correlation coefficient calculated from the regular plot are >0.995. Hence, this analytical method is linear for specified working concentration range for residual determination of Melamine. The linearity was observed in concentration range from 0.0303ppm to 0.1512 ppm for melamine. The regression line equation was plotted between concentration and peak area. The squared correlation coefficient was found to be more than 0.995.
y = 286,608.7542x + 1,605.6006 R² = 0.9967
0 10000 20000 30000 40000 50000
0.0000 0.0500 0.1000 0.1500 0.2000
A
re
a
re
sponse
Concentration in ppm
Limits of Detection and Quantitation
Introduction of Limit of detection and quantitation was done by the American Chemical Society (ACS). Limit of detection of analytical method is the lowest amount of analyte determined but not necessarily quantified, whereas limit of quantitation is the lowest limit of analyte quantitatively determined with suitable accuracy and precision.For assay test for drug substance or drug product, LOD and LOQ are not of matter of concern, because working concentration range is very much on higher side. For melamine content determination analyte concentration is on lower side and results are sometimes are reach upto to the lower level i.e. either LOD or LOQ. Hence LOD and LOQ determination and validation is required, also it needs to be defined in analytical procedure. General method for LOD and LOQ determination is by signal to noise ratio. Now a day’s chromatographic software is available for determination of LOD and LOQ. LOD will be the three times concentration of the signal to noise ratio, where as LOQ will be the ten times concentration of the signal to noise ratio.
LOD and LOQ determination can be calculated by different methods; in regularity document no any specific method is recommended. Hence method for LOD and LOQ determination needs to be written in official document like standard test procedure or validation study protocol. All literature based LOD and LOQ determination techniques assumes that, there is no variation in matrix which will give constant noise level throughout the experimentation. But in practical there is difference in matrix which impact on the recovery of residue from the surface of manufacturing equipments.
Limit of detection (LOD) is the lowest amount of analyte can be detected but not necessary to be quantified under specified analytical condition. Limit of quantification (LOQ) is the lowest amount of analyte quantified with acceptable precision, under the specified analytical conditions.
LOQ solution precision
From the Table 6 precision results, it can be concluded that this method is precise at LOQ at concentration 0.0288 ppm (0.72 ppm wrt test concentration) and LOD at concentration 0.0095 ppm (0.24 ppm wrt test concentration).RSD for area response obtained from six replicate injections for Iguratimod at LOQ level should be not more than 10%.
Table 5 Limit of detection (LOD) establishment
LOD ESTABLISHMENT
Sr. No. Area response for
concentration 0.0095 ppm
1 3388
2 3945
3 3953
4 3359
5 3313
6 3084
Average area = 3507
Table 6 Limit of quantification (LOQ) establishment
LOQ ESTABLISHMENT
Sr. No. Area response for concentration
0.0288 ppm
1 9902
2 9826
3 9846
4 9929
5 9820
6 9807
Average area = 9855
Standard Deviation (SD) = 49.2666 % Relative standard deviation (RSD) = 0.50
Accuracy
Accuracy is generally referred as recovery or trueness of the results. Accuracy can be defined as closeness of analytical results to the true value. Accuracy is performed by evaluation of known concentrations of analyte across the analysis range. Results can be expressed in percentage. Accuracy assures the analyte concentration in the matrix. Matrix can be in process samples, intermediate, finished product, etc.
In some cases recovery may be upto 100% but in some cases it may be on lower side. Accuracy of method is generally established during method development to avoid the surprise during validation activity.
To study of the reliability, suitability, and accuracy of the method recovery experiments were carried out for melamine content in Iguratimod.
The recovery of the method shall be established by spiking a solution of known concentration of melamine. Filter the solution and inject into high-pressure liquid chromatography, performed the exercise in triplicate.
Finally recorded the area of melamine in spiked test sample for different levels, LOQ, 50%, 100% and of 150% wrt test concentration in Table 7, than calculate the % recovery below formula. Referring the results from Table-7, it can be concluded that % of recovery is consistently above 90%. The values obtained above are in good agreement in terms reliability, suitability, and accuracy of the proposed method.
Precision
Precision is measurement for series of results close to each other. Precision can be divided in three subparts; Repeatability, intermediate precision and reproducibility. Precision is expressed in percentage of relative standard deviation.
Repeatability is precision under same operating condition over a short time interval, e.g. Sample injected six times and area response evaluated for all six replicate injections with respect tom each other. This parameter measures precision of instrument, like integrator, data collector, integrator etc. For auto injector, need to take care for injector septa, so that it should not be damaged during analysis, otherwise this may introduce the error during precision study. Along with area response, retention time measurement is also parameter of precision.
Reproducibility can be measured by analysis in different laboratories; it’s a measure of precisions between different laboratories. During transfer of method from one laboratory to another laboratory, due to different environmental condition procedures may be rise the concern for repeatability and intermediate precision. As per ICH guideline for reparability, minimum nine determinations over the working concentration range or six determinations at specification level are recommended.
Accuracy and repeatability of method generally changes with analyte concentration. As the determination of lower concentration level wrt to higher concentration level, significant variation will be observed for accuracy and precision. Melamine content in the entire samples was not detected, hence melamine is spiked at specification level in the entire samples top prove the method precision.
Table 8 System precision
System Precision
No. Area Average Standard
deviation
%Relative standard deviation (%RSD)
Injection -1 30299
30328 48.2563 0.16 Injection -2 30395
Injection -3 30386 Injection -4 30298 Injection -5 30295 Injection -6 30297
Ruggedness
Analytical method should be so rugged even it is used by variety of personnel. Method should not be affected by small changes occurred during day to day activity, e.g. generally chromatographic method in which column heater is not used, should not affected by change in laboratory temperature. If there is impact on chromatographic method, then it should be evaluated and defined. No any regulatory agency ask for ruggedness study and no need to incorporate in validation report, however it is assumed by regulatory agency that effect of various parameters have been studied during method development. Those parameters which are doing affect the chromatography are controlled and documented in the methodology. Ruggedness can be evaluated through experimentation by varying the chromatographic parameters in stepwise process, like mobile phase buffer concentration, flow rate etc.
Fig 5 Standard chromatograms at target concentration for system precision
Table 7 % Recovery results
Recovery
Sr. No. Level
Spiked concentration
(ppm)
Area response
Recovered concentration
(ppm)
% Recovery Mean %
Recovery SD % RSD
1 LOQ level 0.0303
9220 0.0266 87.8
90.2 2.4768 2.75 9673 0.0281 92.7
9420 0.0273 90.1
2 50% level 0.0505
15594 0.0488 96.6
98.7 2.1831 2.21 15889 0.0498 98.6
16219 0.051 101.0
3 100% level 0.1010
29995 0.0991 98.1
97.8 0.3000 0.31 29825 0.0985 97.5
29914 0.0988 97.8
4 150% level 0.1515
46222 0.1557 102.8
103.3 1.0760 1.04 46121 0.1553 102.5
There is no significant impact on chromatography by varying chromatographic parameters within allowable range, like flow rate by ±10%, mobile phase buffer concentration by ±5%, etc.
Summary
Analytical method validation report is the final output of analytical method validation activity. Analytical method validation report should content all the parameters studied
including the pre-establishment criteria. Parameters required in method validation should be established during method development and then it should be defined thoroughly in method validation process.
RESULTS
It is required to develop fast, cost effective, precise, and sensitive analytical method for melamine quantification in Iguratimod. The primary target in developing and validate this RP-HPLC method is to achieve the quantification at lower level. Based on the above-observed results, the developed & validated method for melamine content in Iguratimod method run successfully, the summary and evaluation of results are in below Table-11.
CONCLUSION
A validated reversed phase high-pressure liquid chromatography method has been developed for melamine content in Iguratimod. The proposed method is fast, sensitive, and specific method was developed and validated as per ICH for the determination of melamine in Iguratimod. Specification limit is mentioned as 2.5ppm is specified by guideline ‘Guidance for Industry, Pharmaceutical Components at Risk for Melamine Contamination’. Limit of quantitation (LOQ) for melamine is 0.72ppm and recover between 70-130% for range 0.72 to 3.75 ppm. Its chromatographic run time of 50 minutes allow the analysis of a large number as other methods for melamine evaluation are expensive and having very complicated extraction process. Therefore, it is suitable for the routine analysis of Iguratimod samples.
References
1. Shuntaro Takano, Chosaku Yoshida, Takihiro Inaba, Keiichi Tanaka, Ryuko Takeno, Hideyoshi Nagaki, Tomoya Shimotori, 4H-1-benzopyran-4-one derivative or its salt, process for producing the same and pharmaceutical composition comprising the same as active ingredient., Toyama Chemical Company, Ltd., Tokyo, Japan US4954518, 4 Sept, 1990.
Table 9 Method precision
Method Precision
Sr. No. Level response Area
Recovered concentration
(ppm)
Mean
ppm SD % RSD
1
Method Precision (Analyst-1)
29334 2.45
2.46 0.0117 0.48 29482 2.46
29349 2.45 29772 2.48 29436 2.45 29552 2.46
2
Method Precision (Analyst-2)
29705 2.50
2.49 0.0250 1 29903 2.51
29692 2.50 29237 2.46 29196 2.45 29700 2.50
Table 10 Intermediate precision (Cumulative results)
Precision (Overall)
Analyst Test
Recovered concentration
(ppm)
Overall
ppm SD
%RSD (Cumulative)
Analyst-1
Sample-1 2.45
2.47 0.0238 0.96 Sample-2 2.46
Sample-3 2.45 Sample-4 2.48 Sample-5 2.45 Sample-6 2.46
Analyst-2
Sample-1 2.50 Sample-2 2.51 Sample-3 2.50 Sample-4 2.46 Sample-5 2.45 Sample-6 2.50
Table 11 Summary and evaluation of results
Validation parameters Acceptance criteria Results
System suitability The % of RSD for the area response of Iguratimod peak obtained from six replicate injections of system
suitability should be NMT 10.0%
System suitability parameter meets the criteria % of RSD = 0.16%
Specificity The peaks of blank should not interfere with Iguratimod peak
The peaks of blank do not interfere with Iguratimod peak Individual solutions
Peak name Retention time (in minutes)
Blank No peak
Standard solution 4.95
Linearity
The correlation coefficient and the squared correlation coefficient between concentration and area response
of Iguratimod should be NLT 0.995
The method is linear Correlation coefficient=0.9984 Squared correlation coefficient=0.9967
LOD/LOQ The RSD for area response of melamine from six replicates at LOQ level should be NMT 10.0%
The RSD for area response of Iguratimod from six replicates at LOQ level = 0.50%
LOQ in ppm = 0.72 ppm (wrt test conc.) LOD in ppm = 0.24 ppm (wrt test conc.)
Recovery study
Report the % recovery, if the % recovery is less than 80.0% then incorporate recovery factor to analytical
method
% Recovery
Level Mean % recovery At LOQ level 90.2
At 50% level 98.7 At 100% level 97.8 At 150% level 103.3
2. Wang Jinyi , Li Xudong , Lin Guoqiang ,Zhang Zheng Gen , Wang Lin , Lu Wen bud Preparation of 3-(formamide)-7-(methylsulfonyl amine)-6-(phenoxy)-4H-1-(benzopyran)-4-ketone., Jiangsu Yangtze River Pharmaceutical Group Co. Ltd., CN 1462748.aceutical Group Co. Ltd., CN 1462748.
3. Takihiro Inaba, keiichi Tanaka, ruuko takeno, hideyoshi nagaki, Chosaku Yoshida, Shuntaro takano, Synthesis and Antiinflammatory Activity of 7-Methanesulfonylamino-6-phenoxychromones.
Antiarthritic Effect of the 3-Formylamino Compound (T-614) in Chronic inflammatory disease models. Chem. Pharma. Bull, 2000; 48(1): 131-139.
4. Shanghai Huagong, 2008; 32(12): 22-24.
5. Wang Yan Xiang, Gao Hong, Cao Feng hua, Song Dan Qing, Synthesis of Iguratimod Zhongguo Xinyao Zazhi, 2006; 15(23): 2042-2044.
6. Huagong_Shikan, 2010; 24 (9): 267[1]).
7. ICH, Q1A (1993) Stability testing of new drug substances and products in Proceedings of the international conference on harmonization. Geneva, Switzerland.
8. ICH, Q2B (1996) Harmonised tripartite guideline, Validation of analytical procedure Methodology, International conference on harmonization. Geneva, Switzerland.
9. ICH (2002) Guidance on analytical method validation, International convention on quality for the pharmaceutical industry. Toronto, Canada.
10. ICH, Q1B (1996) Stability testing: photostability testing of new drug substances and Products in International Conference on Harmonization. IFPMA, Geneva, Switzerland.
11. ICH (1996) Validation of analytical procedures methodology ICH harmonized tripartite guidelines.
12. General Chapter, Validation of compendial methods, United States Pharmacopeia, 26th Revision, National Formulary, 21st Edition, Rockville, MD, The United States Pharmacopoeial Convention, Inc, 2440; 2003. 13. International Conference on Harmonization (ICH) of
Technical Requirements for the Registration of Pharmaceuticals for Human Use, Validation of analytical procedures, ICH Q2A,Geneva; 1995. 14. International Conference on Harmonization (ICH) of
Technical Requirements for the Registration of Pharmaceuticals for Human Use, Validation of analytical procedures: Methodology, ICH Q2B, Geneva; 1996.
15. US FDA Technical Review Guide: Validation of Chromatographic Methods, Center for Drug Evaluation and Research (CDER), Rockville, MD; 1993.
16. US FDA, General principles of validation, Rockville, MD, Center for Drug Evaluation and Research (CDER); 1987.
17. US FDA, Guidelines for submitting samples and analytical data for method validation, Rockville, MD, Center for Drugs and Biologics Department of Health and Human Services; 1987.
18. Melamine-Wikipedia, https://en.wikipedia.org/wiki/ Melamine
19. Laboratory Information Bulletin_ LIB 4421, Volume 24, October 2008, Melamine and Cyanuric Acid Residues in Infant Formula
20. Laboratory Information Bulletin_ LIB 442, Volume 24, October 2008 Melamine and Cyanuric Acid Residues In Foods
21. Laboratory Information Bulletin_ LIB 4423, Volume 24, October 2008Melamine and Related Compounds
*******
How to cite this article:
Ravindra Bhaskar Nehete and Pushpendra Sharma.2018, Analytical Method Validation For Quantification of Melamine Content in Iguratimod. Int J Recent Sci Res. 9(2), pp.24187-24194.