© European Geosciences Union 2008
Geophysicae
Cluster observations of particle acceleration up to supra-thermal
energies in the cusp region related to low-frequency wave activity –
possible implications for the substorm initiation process
I. I. Vogiatzis1, T. E. Sarris1, E. T. Sarris1, O. Santol´ık2, I. Dandouras3, P. Robert4, T. A. Fritz5, Q.-G. Zong6, and H. Zhang5
1Space Research Laboratory, Dept. of Electrical and Computer Engineering, Democritus University of Thrace, Xanthi, Greece 2Institute of Atmospheric Physics, ASCR, Prague and Charles University, Prague, Czech Republic
3Centre d’ Etude Spatialedes Rayonnements, Toulouse, France 4CETP/CNRS/IPSL, V´elizy, France
5Center for Space Physics, Department of Astronomy, Boston University, Boston, MA, USA 6Center for Atmospheric Research, University of Massachusetts Lowell, Lowell, MA, USA
Received: 2 May 2007 – Revised: 1 December 2007 – Accepted: 18 December 2007 – Published: 26 March 2008
Abstract. The purpose of our study is to investigate the way particles are accelerated up to supra-thermal energies in the cusp diamagnetic cavities. For this reason we have examined a number of Cluster cusp crossings, originally identified by Zhang et al. (2005), for the years 2001 and 2002 using data from RAPID, STAFF, EFW, CIS, PEACE, and FGM exper-iments. In the present study we focus on two particular cusp crossings on 25 March 2002 and on 10 April 2002 which demonstrate in a clear way the general characteristics of the events in our survey. Both events exhibit very sharp spatial boundaries seen both in CNO (primarily single-charged oxy-gen of ionospheric origin based on CIS observations) and H+flux increases within the RAPID energy range with the
magnetic field intensity being anti-correlated. Unlike the first event, the second one shows also a moderate electron flux in-crease. The fact that the duskward electric fieldEy has
rel-atively low values <5 mV/m while the local wave activity is very intense provides a strong indication that particle en-ergization is caused primarily by wave-particle interactions. The wave power spectra and propagation parameters during these cusp events are examined in detail. It is concluded that the high ion fluxes and at the same time the presence or absence of any sign of energization in the electrons clearly shows that the particle acceleration depends on the wave power near the local particle gyrofrequency and on the per-sistence of the wave-particle interaction process before
par-Correspondence to: I. I. Vogiatzis
ticles escape from cusp region. Furthermore, the continuous existence of energetic O+ ions suggests that energetic O+ populations are of spatial nature at least for the eight events that we have studied so far.
Keywords. Magnetosphere (Magnetopause, cusp and boundary layers) – Solar physics, astrophysics and as-tronomy (Energetic particles) – Space plasma physics (Wave-particle interactions)
1 Introduction
By definition, the polar cusps are near zero magnetic field magnitude and funnel-shaped areas between field lines that map to the dayside and nightside of the magnetopause sur-face. They are the primary regions for direct entry of mag-netosheath/solar wind plasma into the magnetosphere (Rus-sell, 2000). Yet, they are very dynamic with variable plasma structure (Haerendel and Paschmann, 1975). Cusps are also associated with strong plasma wave activity ranging from very low frequencies (Le et al., 2001; Savin et al., 2004) up to electron cyclotron and plasma frequencies (Pickett et al., 2001; Khotyaintsev et al., 2004). In these regions fluxes of accelerated magnetosheath-like plasma particles are ob-served. Electron and ion populations which in our case have temperatures higher than the ambient plasma adjacent to the cusps together with very strong wave activity, particularly at
654 I. I. Vogiatzis et al.: Supra-thermal particle acceleration in the cusp region
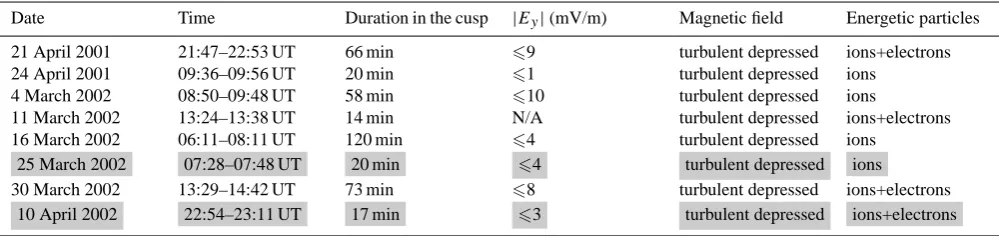
Table 1. Eight Cluster cusp crossings that have been investigated and which show similar features. The shaded areas denote the events selected and presented in this study along with some of their characteristics.
Date Time Duration in the cusp |Ey|(mV/m) Magnetic field Energetic particles
21 April 2001 21:47–22:53 UT 66 min 69 turbulent depressed ions+electrons
24 April 2001 09:36–09:56 UT 20 min 61 turbulent depressed ions
4 March 2002 08:50–09:48 UT 58 min 610 turbulent depressed ions
11 March 2002 13:24–13:38 UT 14 min N/A turbulent depressed ions+electrons
16 March 2002 06:11–08:11 UT 120 min 64 turbulent depressed ions
25 March 2002 07:28–07:48 UT 20 min 64 turbulent depressed ions
30 March 2002 13:29–14:42 UT 73 min 68 turbulent depressed ions+electrons
10 April 2002 22:54–23:11 UT 17 min 63 turbulent depressed ions+electrons
the low frequencies, suggest the existence of wave-particle interaction processes in these regions.
It is well known that O+ions of ionospheric origin are an important and occasionally dominant part of the plasma sheet population (Daglis and Axford, 1996; Sauvaud et al., 2004; Kistler et al., 2005, 2006). Since O+ions are rather cold, the question of efficient acceleration of these ionospheric ions and their associated escape into the magnetosphere is of vi-tal importance. Perhaps a variety of acceleration mechanisms acting successively on the O+ions are responsible for raising the particle energy from about several eV to tens of keV.
A number of studies have investigated the energization and outflow of ions of ionospheric origin up to ∼40 keV. For example, several satellite observations have reported up-ward acceleration of ionospheric ions in auroral region in the energy range 0.1–10 keV (Gorney et al., 1981; Peterson et al., 1988). Observations of the Swedish satellite Viking provided important information on ion acceleration at the topside ionosphere, both in auroral regions and in the cusp region (Lundin et al., 1987; Thelin et al., 1990). Viking data also revealed ionospheric O+ion outflows with energies up to 40 keV (Lundin and Eliasson, 1991).
Cusp originating O+ ion outflow is one of the major sources of the magnetospheric heavy ion populations (for recent reviews, see Yau and Andr´e, 1997; Andr´e and Yau, 1997; Moore et al., 1999). For example, Nilsson et al. (2004) analyzing in detail a particular case of high-altitude oxygen ion energization and outflow were led to the conclusion that the observed O+ion outflow emanates from the cusp region. Also a number of studies (Dubouloz et al., 2001; Bouhram et al., 2003, 2004) had the same inference from the inves-tigation of O+ outflow over the polar cap region. Arvelius
et al. (2005) further investigated the possible mechanisms causing the acceleration of O+at altitudes above 7RE. These
included centrifugal acceleration, parallel electric fields (po-tential drops) and wave-particle interactions. Based on their estimates they argued that acceleration due to centrifugal force and parallel electric fields is inadequate of explain-ing their observations. Rather, they supported the idea that
low-frequency wave activity close to oxygen gyrofrequency could be the responsible mechanism for accelerating the O+ ions. The previous idea was also the main inference made by Andr´e et al. (1990); Bogdanova et al. (2004) who con-cluded that O+ ion heating and outflow is caused by reso-nant interaction at the local ion gyrofrequency with broad-band, low-frequency waves. Although all the above O+
re-lated studies provide important insights regarding O+ion
en-ergization and outflow they have the disadvantage that they are limited to energies below∼40 keV (upper energy limit of Cluster/CIS instrument).
On the other hand, Chen et al. (1997, 1998); Chen and Fritz (1998a,b) using observations from the Polar satellite have provided many evidences that energetic particles of solar wind/magnetosheath origin are energized in situ in the high-altitude polar cusp reaching energies up to several MeV and called these events cusp energetic particle (CEP) events. Additional evidence supporting the previous idea has been provided by Sheldon et al. (1998). Based on data ac-quired from Polar/CEPPAD these authors reported the dis-covery of a trapped energetic electron population in the outer cusp (7–9RE) with energies extending from below 30 keV
to∼2 MeV. According to their analysis, the peak in the ob-served phase space density (or flux) at that location suggested both that the particles were being accelerated in situ and that they were a potential source population for diffusion into the radiation belts. Chen et al. (1998); Chen and Fritz (1998a) also showed that the intensity of energetic particle flux was correlated with enhancement in low-frequency wave turbu-lence something which was also reported by Pissarenko et al. (2001). Additionally, Fritz et al. (2003) by comparing the time-intensity profiles of O≤+2 and He++ions pointed out
by Trattner et al. (2001) who provided an alternative expla-nation for the cusp energetic particles, suggesting that they are accelerated at the quasi-parallel bow shock, then being transported downstream and entering the cusp along newly reconnected field lines or some other solar wind entry mech-anism.
So far there have not been systematic studies in the region of the polar cusp concerning the possible connection between supra-thermal singly ionized oxygen ions above ∼40 keV with low-frequency waves. In the present study observations are extended to O+ion energies above∼90 keV, examining the possible role of wave-particle interactions in producing these supra-thermal ions and discussing the possible contri-bution of these extremely non-adiabatic particles in the sub-storm initiation process. To our knowledge, these are the first direct observations of such kind of ions associated with in-tense low-frequency electromagnetic wave activity.
Our analysis focuses on two representative Cluster cusp crossings among the eight we have investigated during the years 2001 and 2002 (Table 1). All the crossings exhibit sev-eral common features: (1) very well-defined spatial bound-aries in CNO flux enhancements linked to singly ionized oxygen heating; (2) turbulent and depressed magnetic field coincided with intense low-frequency electric and magnetic wave activity; (3) weak DC electric field activity. The con-currence of the supra-thermal particles (both ions and elec-trons) with the broadband electromagnetic emissions below the electron cyclotron frequency suggests that these particles are generated locally in the cusp region through a local reso-nant process with the waves.
2 Observations
2.1 Instrumentation
This study is based on data acquired from RAPID (Research with Adaptive Particle Imaging Detectors) experiment on board Cluster (Wilken et al., 1997). The time resolution of the energetic proton and electron data is 4 s (1 spin) while the oxygen (CNO) has a 16 s time resolution. RAPID ion instrument consists of 3 identical heads – 60 degrees open-ing angle for each head, in total of 180 degrees in the polar direction. As satellite rotates, RAPID instrument is able to construct the whole unit sphere ion distribution in 4 s. Un-fortunately, the middle head (in the ecliptic plane) is de-sensitive with the time. Nevertheless, we still have the other two full functional heads, with total opening angle of 120 degrees, larger than most energetic particle flight sensors on board other satellites. By using the time-of-flight technique (Wilken et al., 1997), oxygen ions are well separated from hydrogen ions giving us the confidence that the ion data is reliable without any doubt. The wave data we used come from STAFF (Spatio Temporal Analysis of Field Fluctua-tions) experiment (Cornilleau-Wehrlin et al., 1997). STAFF
consists of a three-axis search coil magnetometer linked to a processing unit. The processing unit has two parts, the wave-form analyser which measures the wavewave-form of each mag-netic field component at frequencies up to 10 Hz (180 Hz in burst mode), and the Spectrum Analyser which combines the 3 magnetic components of the waves with the two elec-tric components measured by the Elecelec-tric Fields and Waves experiment (EFW) (Gustafsson et al., 1997) to calculate in real time the 5×5 Hermitian cross-spectral matrix at 27 fre-quencies distributed logarithmically in the frequency range 8 Hz to 4 kHz. The plasma data are obtained from the CIS (Cluster Ion Spectrometer) experiment (R`eme et al., 1997). CIS experiment consists of two different instruments, a Hot Ion Analyser (HIA) and a time-of-flight ion Composition Distribution Function (CODIF). The CODIF instrument is a high-sensitivity mass-resolving spectrometer with an in-stantaneous 360◦×8◦ field-of-view to measure full
three-dimensional distribution functions of the major ion species (in as much as they contribute significantly to the total mass density of the plasma), within one spin period of the space-craft. Typically these include H+, He+, He++and O+, with energies between∼0–40 keV/e. The Hot Ion Analyser (HIA) instrument does not offer mass resolution but has two 180◦ field-of-view sections with two different sensitivities. For each sensitivity section a full 4πsteradian scan is completed every spin of the spacecraft giving a full three-dimensional distribution of ions in the energy range∼5 eV/e–32 keV/e. Provider of the electron plasma data is the PEACE (Plasma Electron and Current Experiment) experiment (Johnstone et al., 1997) which consists of two sensors, HEEA (High Energy Electron Analyser) and LEEA (Low Energy Elec-tron Analyser), mounted on diametrically opposite sides of the spacecraft. They are designed to measure the three di-mensional velocity distributions of electrons in the range of 0.6 eV to∼26 keV during a spacecraft spin. In standard mode, HEEA measures the range of 35 eV to 26 keV and LEEA measures the range of 0.6 eV to 1 keV, although either can be set to cover any subset of the energy range. The DC magnetic field data are provided from the FGM (Flux/Gate Magnetometer) instrument (Balogh et al., 1997) with a time resolution of 4 s.
2.2 25 March 2002 cusp crossing
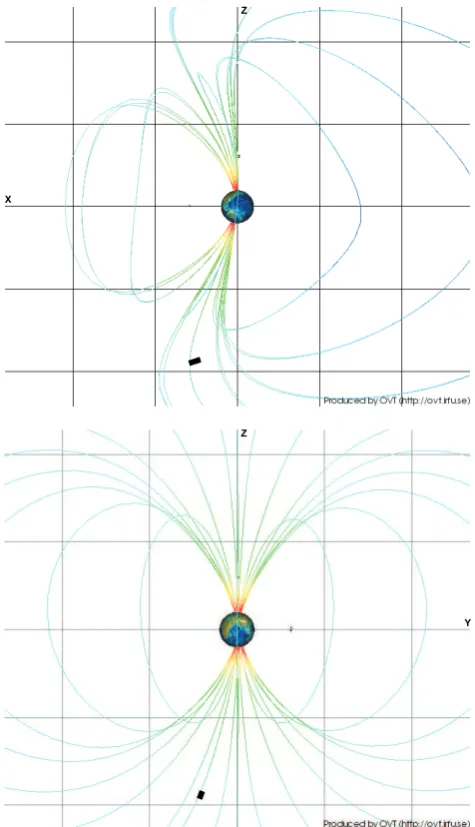
On 25 March 2002 the Cluster spacecraft entered the south polar cusp region at∼07:28 UT from the magnetosheath on their way to the plasma mantle. The trajectory of the Cluster spacecraft and the magnetospheric field model (T89 model) are shown in Fig. 1. The Cluster constellation was located in the high-altitude cusp region (∼10.1RE geocentric
dis-tance) with the average spatial coordinates having values X≈2.89RE, Y≈2.20RE and Z≈−9.52RE, in GSM
coor-dinates taking as a reference SC1. The event took place dur-ing relatively low geomagnetic activity (Dst of∼−45 nT at
07:30 UT) with the IMFByandBzhaving values∼−12 nT
656 I. I. Vogiatzis et al.: Supra-thermal particle acceleration in the cusp region Figures
Z
Y Z
X
Fig. 1. Location of the Cluster spacecraft in X-Z and Y-Z planes (marked with a black bold line)
in the vicinity of the cusp region for the time interval 07:30-07:50 UT. The figure is produced with Orbit Visualization Tool using Tsyganenko 87 magnetic field model (http://ovt.irfu.se).
24
Fig. 1. Location of the Cluster spacecraft in X-Z and Y-Z planes (marked with a black bold line) in the vicinity of the cusp region for the time interval 07:30–07:50 UT. The figure is produced with Orbit Visualization Tool using Tsyganenko 87 magnetic field model (http://ovt.irfu.se).
and∼9 nT, respectively. Our primary interest is the time in-terval 07:28–07:48 UT during which Cluster was inside the polar cusp region observing intense ion acceleration together with strong broadband electromagnetic wave emissions.
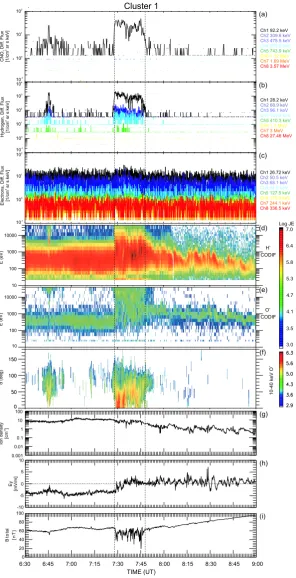
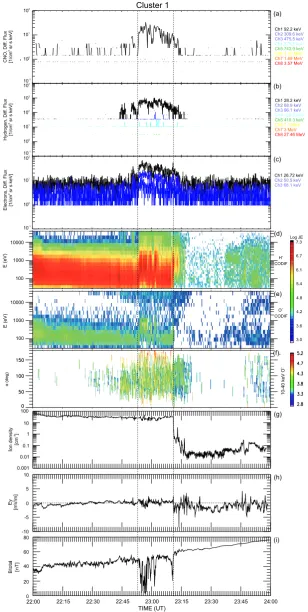
Figure 2 shows an overview of the observations made by Cluster 1 during the inbound crossing of the exterior cusp re-gion by Cluster spacecraft. Panels from top to bottom show: (a), (b), and (c) differential fluxes of energetic CNO group species, protons, and electrons, respectively, measured by RAPID, (d), (e) H+, O+spectrograms up to 40 keV, (f) pitch-angle spectrogram of high-energy O+ ions, (g) ion density
measured by CIS/HIA, (h) duskward DC electric field mea-sured by EFW, and (i) magnetic field intensity obtained from FGM instrument.
The most prominent feature in Fig. 2 is the heavy ion (pre-dominantly energetic oxygen) and proton flux (with no ob-servable energy dispersion) increases (panels a and b) which last for about 20 min. Unlike ions, electrons do not show any activity with their fluxes remaining at a background level (panel c). While Cluster spacecraft are entering the cusp re-gion they observe intense plasma energization up to ener-gies of 40 keV (panel d). Panel (e) demonstrates a very in-teresting feature of the particular event where singly ion-ized oxygen of ionospheric origin is energion-ized up to at least 40 keV of energy where there is not any observable energy dispersion between the different energy levels providing a hint of local simultaneous energization. Since RAPID in-strument is not capable of resolving mass per charge of the CNO group, this observation provides us a strong evidence that CIS/CODIF measurements are linked to RAPID mea-surements with singly ionized oxygen energization extend-ing from thermal up to supra-thermal energies comprisextend-ing the low energy band (92.2–309.6 keV) of the CNO group. Of course, the presence of energetic oxygen population other than O+ cannot be ruled out since once we are inside the cusp region ionospheric and solar wind plasmas mix. How-ever, our observations demonstrate that O+is the major con-stituent of the hypothetically mixed oxygen population and for this reason in the rest of this paper the CNO group will be referred to as singly ionized oxygen. In order to prove our point that the local heating and energization of these ions are being observed, in panel (f) we show pitch-angle information for high-energy O+ ions (10–40 keV) where a
90 deg pitch-angle distribution is obvious. In addition to the 90 deg pitch-angle distribution we observe also a parallel (0 deg) component, which is originating closer to the iono-sphere. As shown in panel (g), there is no plasma density en-hancement, indicative that cusp is populated by injections of magnetosheath plasma when Cluster moves from the mag-netosheath into the cusp. Panel (i) demonstrates a common feature of cusp diamagnetic cavities where magnetic field is highly depressed and turbulent. The relatively low electric field activity (|Ey|<4 mV/m, panel h) implies that the ion
flux enhancements are not related to some kind of large-scale inductive effects taking place at least locally. As a matter of fact, this electric field is related to the plasma convection through the cusp (convection electric field) where plasma ve-locity exhibits relatively low values (not shown).
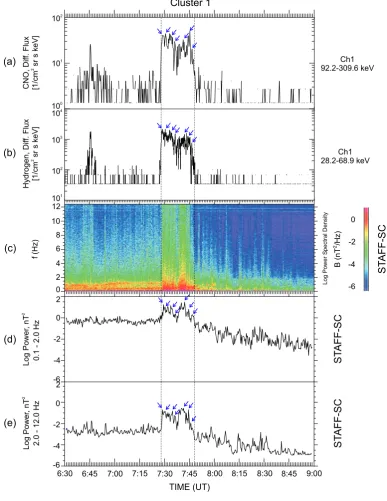
The first two panels in Fig. 3 show CNO and H+
[image:4.595.52.290.65.479.2]Hydrogen,Dif
f.Flux
[1/cm
srskeV]
2
Electrons,Dif
f.Flux
[1/cm
srskeV]
2
Ch1 26.72 keV
Ch2 50.5 keV
Ch3 68.1 keV Ch4 94.5 keV Ch5 127.5 keV
Ch6 175.9 keV
Ch7 244.1 keV
Ch8 336.5 keV Ch1 28.2 keV
Ch2 68.9 keV
Ch3 96.1 keV Ch4 169.3 keV Ch5 410.3 keV
Ch6 1.1 MeV
Ch7 3 MeV
Ch8 27.46 MeV
H+
O+
CODIF
CODIF
E(eV)
E(eV)
10 100 1000 10000 10 100 1000 10000 10-1
102
100
101
10-1
102
100
101
103
104
10-1
Log JE 7.0
6.4
5.8
5.3
4.7
4.1
3.5
3.0
(b)
(c)
(d)
(e)
0.1 1 10 100
Iondensity
[cm
]
-3
(g)
10-40keV
O
+
á(deg)
(f)
CNO,Dif
f.Flux
[1/cm
srskeV]
2
Ch1 92.2 keV
Ch2 309.6 keV
Ch3 475.5 keV Ch4 575.5 keV Ch5 743.9 keV
Ch6 1.12 MeV
Ch7 1.69 MeV
Ch8 3.57 MeV 102
100
101
(a) Cluster 1
0.001 0.01
Ey
[mV/m]
10
5
0
-5
-10
0 20 40 60 80 100
B
to
ta
l
[n
T
]
6:30 6:45 7:00 7:15 7:30 7:45 8:00 8:15 8:30 8:45 9:00
TIME (UT)
(h)
[image:5.595.151.448.68.647.2](i)
Fig. 2. An overview of ion and electron flux measurements (panels (a)-(c)) obtained from
Clus-ter/RAPID between 06:30-09:00 UT on March 25, 2002. The H+ and O+ CODIF energy-time spectrograms integrated over 4π are plotted in panels (d) and (e). Panel (f) presents pitch-angle information for high-energy O+ions. The HIA ion density is plotted in panel (g). Panel (h) shows the duskward DC electric field while in the last panel what is plotted is the magnetic field intensity where it is clear its turbulent and depressed character during the crossing of the cusp diamagnetic cavity. Panel (a) has a 16 sec time resolution while the data in the rest of the panels are spin (4 sec) averaged.
25
Fig. 2. An overview of ion and electron flux measurements (panels a–c) obtained from Cluster/RAPID between 06:30–09:00 UT on 25
March 2002. The H+and O+CODIF energy-time spectrograms integrated over 4π are plotted in panels (d) and (e). Panel (f) presents
pitch-angle information for high-energy O+ions. The HIA ion density is plotted in panel (g). Panel (h) shows the duskward DC electric field
while in the last panel what is plotted is the magnetic field intensity where it is clear its turbulent and depressed character during the crossing of the cusp diamagnetic cavity. Panel (a) has a 16 s time resolution while the data in the rest of the panels are spin (4 s) averaged.
658 I. I. Vogiatzis et al.: Supra-thermal particle acceleration in the cusp region
(a)
(b)
LogPowerS
pectralDensity
-6 -4 -2 0 2
LogPower
,nT
2
0.1-2.0Hz
Cluster 1
0
-2
-4
-6 10
12
8
6
4
2
0
-6 -4 -2 0 2
LogPower
,nT
2
2.0-12.0Hz
(c)
(d)
(e)
f(Hz)
B(nT
2/Hz)
ST
AFF-SC
6:30 6:45 7:00 7:15 7:30 7:45 8:00 8:15 8:30 8:45 9:00
TIME (UT)
ST
AFF-SC
ST
AFF-SC
CNO,Dif
f.Flux
[1/cm
srskeV]
2
100
101
Hydrogen,Dif
f.Flux
[1/cm
srskeV]
2
102
101
103
104
Ch1 28.2-68.9 keV
Ch1 92.2-309.6 keV
[image:6.595.102.490.75.577.2]102
Fig. 3. Overview of RAPID and STAFF-SC power spectra from Cluster 1 for the March 25, 2002
cusp event. The first two panels are CNO and proton differential fluxes for the first energy channel obtained from RAPID spectrometer. The third panel shows the dynamic spectra of the magnetic waveform data in the 0-12 Hz frequency range. The last two panels represent the integrated power in the 0.1-2.0 Hz and 2.0-12.0 Hz frequency ranges with 0.1 Hz being the lowest frequency that can be resolved from the STAFF waveform data.
26
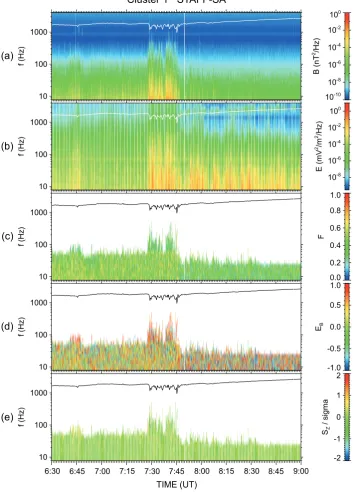
Fig. 3. Overview of RAPID and STAFF-SC power spectra from Cluster 1 for the 25 March 2002 cusp event. The first two panels are CNO and proton differential fluxes for the first energy channel obtained from RAPID spectrometer. The third panel shows the dynamic spectra of the magnetic waveform data in the 0–12 Hz frequency range. The last two panels represent the integrated power in the 0.1–2.0 Hz and 2.0–12.0 Hz frequency ranges with 0.1 Hz being the lowest frequency that can be resolved from the STAFF waveform data.
respectively. One can see the bursty nature of the magnetic fluctuations as Cluster enters the cusp region. By compar-ing the last two panels it is easy to notice that the integrated power in the band 0.1–2.0 Hz is almost two orders of mag-nitude higher than the power in the 2.0–12.0 Hz frequency
6:30 6:45 7:00 7:15 7:30 7:45 8:00 8:15 8:30 8:45 9:00
TIME (UT)
(a)
(b)
(c)
(d)
(e)
Cluster 1 STAFF-SA
10-10 10-8 10-6 10-4 10-2 100
B(nT
2/Hz)
10 100 1000
f(Hz)
10-8 10-6 10-4 10-2 100
E(mV
2/m 2/Hz)
10 100 1000
f(Hz)
0.0 0.2 0.4 0.6 0.8 1.0
F
10 100 1000
f(Hz)
-1.0 -0.5 0.0 0.5 1.0
EB
10 100 1000
f(Hz)
-2 -1 0 1 2
SZ
/sigma
10 100 1000
[image:7.595.119.474.77.570.2]f(Hz)
Fig. 4. Color-coded spectrograms of wave propagation parameters for the cusp event recorded on
March 25, 2002 for the time interval 07:28-07:48 UT. The first two panels are the dynamic spectra obtained from the Spectrum Analyser (SA) in the frequency range 8 Hz-4 kHz. Panel (c) presents the planarityF of the polarization, panel (d) the polarization ellipticity, and panel (e) the parallel com-ponent of the Poynting vector normalized by its standard deviation. See text for detailed explanation. The white/black line shown in the panels denotes the local electron gyrofrequency.
27
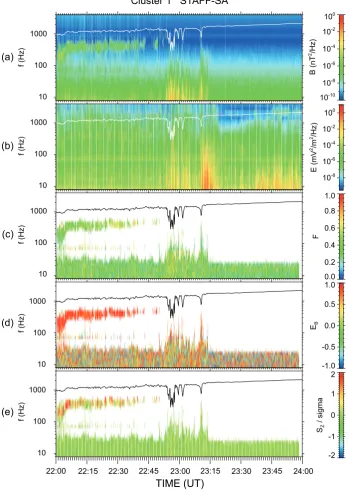
Fig. 4. Color-coded spectrograms of wave propagation parameters for the cusp event recorded on 25 March 2002 for the time interval 07:28–07:48 UT. The first two panels are the dynamic spectra obtained from the Spectrum Analyser (SA) in the frequency range 8 Hz–
4 kHz. Panel (c) presents the planarityFof the polarization, panel (d) the polarization ellipticity, and panel (e) the parallel component of the
Poynting vector normalized by its standard deviation. See text for detailed explanation. The white/black line shown in the panels denotes the local electron gyrofrequency.
form data cannot go as low as 0.01 Hz; the lowest frequency that can be attained is 0.1 Hz. From panels (a) and (b) we can see that the ion flux spikes are closely related to the mag-netic power fluctuations1B2seen in panels (d) and (e) (blue
arrows). The correlation between the ion differential flux in-creases and the1B2 may be interpreted as a conversion of the turbulent magnetic field energy density into ion’s kinetic energy providing a strong evidence for resonant interaction
660 I. I. Vogiatzis et al.: Supra-thermal particle acceleration in the cusp region between the waves and the particles. Also, the increase in
the power spectral density as we approach the O+
gyrofre-quency is of particular importance if we consider a resonant ion acceleration.
Figure 4 presents polarization characteristics of the elec-tromagnetic waves observed. The first and second panel show the magnetic and electric power spectral densities which re-spectively are the sum of the three magnetic components ob-tained from STAFF instrument and the sum of the two elec-tric components obtained from EFW instrument. The thin white line in both spectrograms is the local electron cyclotron frequency based on FGM magnetic field data. The main fea-ture here is a broadband electromagnetic emission at low fre-quencies between 07:28 and 07:48 UT coinciding with the time that Cluster spacecraft spends inside the cusp region. The wave magnetic field component appears to have an up-per frequency cutoff at∼500 Hz, which is about one half of the electron cyclotron frequency,fce. The next two panels
present different aspects of the polarization of the wave mag-netic field. The planarityF of the polarization, as graphed in panel (c), is obtained from the singular-value decomposition (SVD) of the magnetic spectral matrix (Santol´ık et al., 2003). The planarity of the polarization is defined as
F =1−pw1/w3, (1)
wherew1is the smallest singular value, andw3is the largest
one. ForF=0 the three axes have equal lengths and the el-lipsoid of the polarization becomes a sphere, so there is no preferred plane of polarization for field fluctuations. IfF=1 the ellipsoid degenerates into an ellipse. Ratio of the two axes of the polarization ellipse is defined as
Lp=w2/w3. (2)
IfLp=0, meaning that the first two singular values are zero,
then the polarization is linear and the remaining non-zero singular valuew3 defines the direction of the fluctuations.
If 0<Lp<1 the polarization is elliptic and ifLp=1 the
po-larization is circular. For the latter general case, a value of
F close to 1.0 corresponds to the presence of a single plane wave.
SinceLpis positive it is convenient to combine its value
with the sense of elliptic or circular polarization (that is, the sense of rotation of the magnetic vector aroundB0). Thus,
we define the ellipticity of the polarization to beEB=LsLp
(panel d).Lsis−1 when the polarization is left-handed with
respect toB0(sense of the ion cyclotron motion), andLs is
+1 for right-handed polarization (sense of the electron cy-clotron motion). For linear polarization,Ls is undefined, but
bothEB andLp are zero (for a detailed description of the
SVD method see Santol´ık et al., 2002, 2003, and references therein).
The properties of the waves are highly variable. As can be easily seen in panel (c), the broadband emission has a low
planarity with F being mostly between 0.3 and 0.7 corre-sponding to a mixture of a large number of different plane waves simultaneously present in thek spectrum. This rela-tively low value does not permit us to have clear results of the wave polarization and propagation parameters given in panels (d) and (e) since they are based on the assumption of a single plane wave. Hence, the fourth panel, which rep-resents the ellipticity of polarization, indicates, with a high level of uncertainty, the sense of polarization with respect to the local magnetic field. Values below−0.5 mean left-hand polarized wave, values above+0.5 correspond to right-hand polarized waves, while values between−0.5 and+0.5 indi-cate a high level of uncertainty in determining the polariza-tion sense. Thus, there is not a clear result on a predominant sense of polarization (from nearly linear to nearly circular polarization), something that has been noted before (Andr´e et al., 1990; Le et al., 2001), and this might be similar to the case discussed in Santol´ık et al. (2002) where there is a su-perposition of linearly polarized waves.
Having full vector measurements for magnetic field and the two components of the electric field in the spin plane, the vector of the mean Poynting flux can be calculated as the average ofS=E×B/2µ0 (Santol´ık et al., 2001), where µ0is the vacuum permeability. Panel (e) presents a
param-eter which is related to the sign of the z-component of the Poynting vector. Its absolute value indicates the reliability of the result. Red color indicates that the wave vector is in the direction of the Earth’s magnetic fieldB0, while blue color
indicates the opposite. As can be seen, during the time that Cluster is inside the cusp region the value of the Poynting z-component is around zero implying a high level of uncer-tainty in determining the direction of the emission relative to the Earth’s magnetic field. However, for some times and fre-quencies (for example around 07:28 UT,∼100 Hz) it is pos-sible to estimate the predominant sign of the parallel compo-nent of the wave Poynting flux which is positive in that case; thus pointing in the direction of the geomagnetic field. 2.3 10 April 2002 cusp crossing
obvious). Because the CODIF instrument has a 40 keV up-per limit, the heating of O+ is, if anything, underestimated,
as there may be a significant energization of these ions to en-ergies greater than 40 keV. In antithesis to the first event, we now have also an energetic electron energization with no ob-servable time dispersion seen in the low energy channels of RAPID instrument (panel c). It is interesting to note that all the particle energization that took place inside the cusp was accompanied by low electric field activity (|Ey|<3 mV/m,
panel h) similar to the first event.
At this point we would like to stress that the green pat-tern seen below about 300 eV in panel (e), while being in the magnetosheath, is due to contamination by the very high H+ fluxes there. The reason for that is the fact that occa-sionally there are two uncorrelated H+ions, one generating
only a “start” time-of-flight signal and the other generating only a “stop” time-of-flight signal, and if the time difference between the two signals coincides with that of an O+ ion this gives a H+ “ghost” in the O+ spectrogram. There are not O+ ions, or if there are O+ ions there their fluxes are overestimated due to this contamination by the H+ions. The same is true for the yellow-green pattern at about 1 keV in the cusp (around 22:56 UT). However, the higher-energy O+ ions (above∼15 keV) observed in the cusp, for which we are interested in, are “real” O+; there is no contamination by H+ at these energies, where counting rates are much lower.
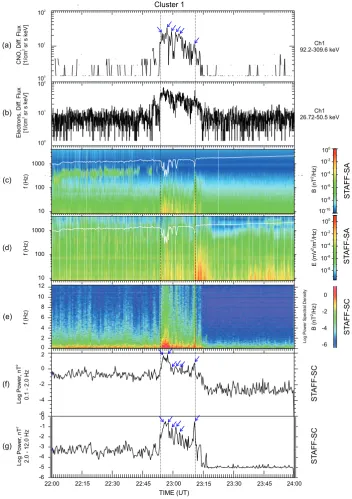
In Fig. 7 we demonstrate the direct relation between the energetic particles and the electromagnetic waves present in the cusp region. Similarly to the first event, note the very good correlation between the CNO/O+ flux and the
inte-grated power increases (spikes denoted by blue arrows). Ad-ditionally, we have an electron energization which correlates very well with the intense broadband electromagnetic emis-sions mainly below∼300 Hz (panels b, c, and d) which oc-casionally reach the local electron cyclotron frequency. Fig-ure 8 has the same format as to Fig. 4. For these waves we cannot infer any conclusions about the wave polarization and propagation characteristics since there is again a mixture of a large number of different plane waves simultaneously present in thekspectrum. Before∼22:45 UT we can notice a clearly right-hand polarized emission at a few hundreds of hertz. These waves, showing similarity to the lion roar emissions (Maksimovic et al., 2001), propagate in the whistler mode, with a significant parallel component of the Poynting flux.
3 Discussion
We have presented observations of low-frequency electro-magnetic waves that are present in the high-altitude polar cusp region in close relation with supra-thermal particle en-ergization. In the following we make an attempt to shed some light on aspects pertaining to the present study and dis-cuss any implications that our results may have on magneto-spheric dynamics.
Z
X
Z
[image:9.595.315.532.65.440.2]Y
Fig. 5. Same as to Fig. 1 for the event recorded on April 10, 2002 between 22:54 and 23:11 UT.
TheDstindex was∼15 nT at 23:00 UT, suggesting no geomagnetic storm activity, while IMFBy
andBzwere∼5 nT and∼11 nT, respectively. The average Cluster location in the high-altitude cusp
region was X≈1.5 RE, Y≈−0.1 REand Z≈−10.2 RE, in GSM coordinates taking as a reference
SC1 with a geocentric distance of∼10.3 RE.
28
Fig. 5. Same as to Fig. 1 for the event recorded on 10 April 2002
be-tween 22:54 and 23:11 UT. TheDstindex was∼15 nT at 23:00 UT,
suggesting no geomagnetic storm activity, while IMFBy andBz
were∼5 nT and∼11 nT, respectively. The average Cluster location
in the high-altitude cusp region was X≈1.5RE, Y≈−0.1RE and
Z≈−10.2RE, in GSM coordinates taking as a reference SC1 with
a geocentric distance of∼10.3RE.
3.1 The cusp as a dynamic trapping region
The real geomagnetic field, due to solar wind pressure changes, is far from being an idealized dipole field and charged particles cannot be trapped in the cusp region. How-ever, cusp geometry may be a potential trap for charged particles through the creation of a diamagnetic cavity with the magnetic field gradient pointing outwards. Such a ge-ometry can be created by solar plasma injection from the magnetosheath possibly through high-latitude reconnection. Based on test particle simulations Sheldon et al. (1998) have demonstrated that charged particles (more specifically, en-ergetic electrons with energies ranging from tens of keV
662 I. I. Vogiatzis et al.: Supra-thermal particle acceleration in the cusp region
Hydrogen,Dif
f.Flux
[1/cm
srskeV]
2
Electrons,Dif
f.Flux
[1/cm
srskeV]
2
10-1
102
100
101
10-1
102
100
101
103
104
10-1
Ch1 26.72 keV
Ch2 50.5 keV
Ch3 68.1 keV Ch1 28.2 keV
Ch2 68.9 keV
Ch3 96.1 keV Ch4 169.3 keV Ch5 410.3 keV
Ch6 1.1 MeV
Ch7 3 MeV
Ch8 27.46 MeV
(b)
(c)
(d)
(e)
H+
O+
CODIF
CODIF Log JE
7.3
6.7
6.1
5.4
4.8
4.2
3.6
3.0
E(eV)
E(eV)
100 1000 10000 100 1000 10000
22:00 22:15 22:30 22:45 23:00 23:15 23:30 23:45 24:00
TIME (UT)
0.001 0.01 0.1 1 10 100
I
ondensity [cm
]
-3
Ey
[mV/m]
10
5
0
-5
0 20 40 60 80
B
to
ta
l
[n
T
]
-10
(g)
(h)
(i)
CNO,Dif
f.Flux
[1/cm
srskeV]
2
102
100
101
Cluster 1
Ch1 92.2 keV
Ch2 309.6 keV
Ch3 475.5 keV Ch4 575.5 keV Ch5 743.9 keV
Ch6 1.12 MeV
Ch7 1.69 MeV
Ch8 3.57 MeV
(a)
á(deg)
10-40keV
O
+
[image:10.595.144.453.69.682.2](f)
Fig. 6. Same format as Fig. 2 but for April 10, 2002. Note that in this case, as opposed to Fig. 2,
there is an electron energization as well.
29
(c)
(d)
ST
AFF-SA
10-10
10-8
10-6
10-4
10-2
100
B(nT
2/Hz)
10 100 1000
f(Hz)
10-8
10-6
10-4
10-2
100
E(mV
2/m 2/Hz)
10 100 1000
f(Hz)
LogPowerS
pectralDensity
-6 -4 -2 0 2
LogPower
,nT
2
0.1-2.0Hz
Cluster 1
0
-2
-4
-6
ST
AFF-SA
10 12
8
6
4
2 0
-6 -4 -2 -1 0
LogPower
,nT
2
2.0-12.0Hz
(e)
(f)
(g)
f(Hz)
B(nT
2/Hz)
ST
AFF-SC
22:00 22:15 22:30 22:45 23:00 23:15 23:30 23:45 24:00 TIME (UT)
ST
AFF-SC
ST
AFF-SC
2424
22
22 24
-3
-5
Electrons,Dif
f.Flux
[1/cm
srskeV]
2
102
100
101
(b)
CNO,Dif
f.Flux
[1/cm
srskeV]
2
102
100
101
(a)
Ch1 26.72-50.5 keV
[image:11.595.119.472.68.568.2]Ch1 92.2-309.6 keV
Fig. 7. Similar to Fig. 3 for the event recorded on April 10, 2002.
30
Fig. 7. Similar to Fig. 3 for the event recorded on 10 April 2002.to MeV) mirror around the minimum magnetic field near the cusp center and drift in closed drift shells around it in agreement with observations of trapped energetic electrons with energies>50 keV made by Zong et al. (2005). Simi-larly, modeling particles trajectories in the cusp region, Zong et al. (2005) have shown that protons with energies 1, 10, and 100 keV can be stably trapped with the drifting orbits encir-cling the outer cusp region. The above process is more
effi-cient during quiet times (northward IMF, like in our events) where magnetospheric convection is reduced and the convec-tion electric field may be only 5% of its value during ac-tive times. In fact, based on energetic particles distributions (Chen et al., 1997; Chen and Fritz, 2000), the high-altitude cusp is not a stable trapping region but rather a dynamic trap-ping region that can only temporarily confine charged parti-cles (Chen et al., 1997). In this way the Earth’s outer cusp
664 I. I. Vogiatzis et al.: Supra-thermal particle acceleration in the cusp region
(a)
(b)
(c)
(d)
(e)
Cluster 1 STAFF-SA
10-10
10-8
10-6
10-4
10-2
100
10 100 1000
f(Hz)
10-8
10-6
10-4
10-2
100
E(mV
2/m 2/Hz)
10 100 1000
f(Hz)
0.0 0.2 0.4 0.6 0.8 1.0
F
10 100 1000
f(Hz)
-1.0 -0.5 0.0 0.5 1.0
EB
10 100 1000
f(Hz)
-2 -1 0 1 2
SZ
/sigma
10 100 1000
f(Hz)
22:00 22:15 22:30 22:45 23:00 23:15 23:30 23:45 24:00
TIME (UT)
B(nT
[image:12.595.121.470.73.564.2]2/Hz)
Fig. 8. Same format as Fig. 4 but for April 10, 2002.
31
Fig. 8. Same format as Fig. 4 but for 10 April 2002.
is capable of both trapping and accelerating charged parti-cles in situ providing a source population for diffusion into the radiation belts and geostationary orbit region (Fritz et al., 2000).
3.2 Energization of O+ions
According to the previous section it is evident that outer cusp is a region capable of trapping and accelerating outgoing O+ from the ionosphere. This upward moving of low-energy O+ ions with energies typically below 10 keV originates from a heating region whose altitude location extends up to 6RE
fountain. Therefore it is legitimate to conclude that the cleft ion fountain is the source which provides the outer cusp re-gion with low-energy O+ ions which undergo further
ac-celeration up to supra-thermal energies while being trapped. The fact that there is a co-existence of two oxygen popula-tions inside the cusp region can be attributed to the fact that lower energy population registered by CIS instrument is a newly arrived population in the outer cusp region accelerated perpendicular to the magnetic field (Dubouloz et al., 1998; Bouhram et al., 2002, 2004) in accordance to our observa-tions. On the other hand, the higher energy O+ ions regis-tered by RAPID, although having the same origin with those of lower energy, is a population that has undergone a continu-ous energization due to its confinement in the outer cusp trap-ping region. Thus, assuming that wave-particle interactions are the responsible mechanism for accelerating O+ions, then
it is easy to understand that the energies that RAPID mea-sures it is more likely to be produced locally in the high-altitude polar cusp. The above idea is also supported by our observations where the wave power variations near the local ion gyrofrequency match very well with the ion’s differential flux spikes providing a convincing evidence that there is a strong coupling between ions and waves with their spectral power being the cause of the ion’s flux modulation.
3.3 Energization of electrons
As stated by Zong et al. (2005); Asikainen and Mursula (2006), energetic electrons above ∼25 keV in the exterior cusp cannot be the product of the reconnection process in the adjacent magnetopause. For typical values of plasma density, velocity, and magnetic field change across the magnetopause, the estimated maximum energy gain per particle remains be-low 1 keV which means that particles cannot be energized to tens or hundreds of keV in the reconnection process by bulk acceleration. Another possible mechanism for electron ac-celeration is the Fermi mechanism in the quasi-parallel bow shock region. Although this mechanism is considered to be capable of accelerating incident solar wind ions to energies up to about 200 keV, it cannot accelerate electrons efficiently (Lee, 1982). Hence, the acceleration mechanism involved with the electron flux enhancement during the 10 April 2002 cusp crossing does not have to do neither with a reconnection process nor with a bow shock related process. Thus, based on our observations it would be legitimate to conclude that energetic electron acceleration is driven by resonant wave-particle interactions taking place locally.
The fact that the high-altitude cusp behaves as a dynamic trapping region that can only temporarily confine charged particles (Chen et al., 1997) forcing them to execute drift motion due to the magnetic field gradient may provide the connective link that is missing for explaining how particles are accelerated to supra-thermal energies before escaping from the cusp region. As Pickett et al. (2001) showed for the case of electrons, during a cusp crossing event the parallel
kinetic energy of an electron undergoing normal cyclotron resonance when travelling in the opposite and same direc-tion with whistler waves having frequencies∼1/3fce was
∼0.45 keV and ∼0.1 keV, respectively (Table 1 in Pickett et al., 2001). The fact that RAPID instrument registers ener-getic electrons above∼25 keV implies that if this mechanism is responsible for the acceleration of these particles then the electrons should undergo multiple resonances before escap-ing from the cusp region.
3.4 Origin of kinetic Alfv´en and whistler mode waves ob-served in the cusp
Many possibilities have been discussed in the literature re-garding the origin of the broadband low-frequency electro-magnetic emissions in the cusp turbulent region. A reason-able expectation is that the whistler mode waves just below
fcecould possibly be auroral hiss that has propagated to the
cusp region, since their frequencies around 1 kHz are typical of hiss (Pickett et al., 2001). However, the most likely mech-anism for producing whistler mode waves is the magnetic reconnection process active adjacent to the exterior cusp re-gion (Pickett et al., 2001). The latter process can be identi-fied by the observation of FTEs where recently reconnected flux tubes filled with magnetosheath-like plasma are being dragged around the magnetosphere after reconnection (e.g. Khotyaintsev et al., 2004). Similarly, Błe¸cki et al. (2003) has suggested that kinetic Alfv´en waves at frequencies below the ion cyclotron frequency could be the result of plasma acceler-ation at a reconnection site. In particular, the Alfv´enic pertur-bations that originate from the reconnection site (Haerendel et al., 1978) could propagate along the newly-reconnected flux tubes into the high-altitude cusp region. On the other hand, in a recent study Grison et al. (2005) have shown that there are evidences of kinetic Alfv´en waves being generated locally in the high-altitude cusp region. They based their in-ference on the fact that proton flows due to the outflow from a reconnection site are closely associated with a strong ULF electromagnetic activity. They argued that a plausible mech-anism for the local generation of kinetic Alfv´en waves could be a current instability where parallel currents provide the “free” energy for the wave excitation.
A remarkable thing that has been noted before (Pick-ett et al., 2001) and we see it also in our observations is the fact that at frequencies above the local proton cy-clotron frequency both left-handed and right-handed waves are observed. In the plasma dispersion relation the left-handed/Alfv´en waves cannot propagate either in the direction perpendicular to the magnetic field or at frequencies above the ion cyclotron frequency. Consequently, one should expect the waves observed above the proton cyclotron frequency to be in the right-handed/whistler mode. The fact that some of the waves exhibit left-handed polarization above the ion cy-clotron frequency could be possibly attributed to a random superposition of linearly polarized waves (Santol´ık et al.,
666 I. I. Vogiatzis et al.: Supra-thermal particle acceleration in the cusp region
22:54 22:56 22:58 23:00 23:02 23:04 23:06 23:08 23:10 0.8
1 1.2 1.4 1.6 1.8
T
e
/T
e
p
ar
perp
Time (UT)
Fig. 9. Electron anisotropy data from PEACE experiment for the April 10, 2002 cusp crossing. What
shown is the ratio of the parallel electron temperature to the perpendicular electron temperature for the time period that Cluster 1 was inside the cusp region.
32
Fig. 9. Electron anisotropy data from PEACE experiment for the 10 April 2002 cusp crossing. What shown is the ratio of the parallel electron temperature to the perpendicular electron temperature for the time period that Cluster 1 was inside the cusp region.
2002). In our case, however, this is still an open question which merits attention but is beyond the scope of the present study.
Following the same procedure as Pickett et al. (2001) we examine if the waves in the 10 April 2002 event could be gen-erated locally by the whistler-mode cyclotron instability at the exact time they are observed. Figure 9 is a plot of electron temperature anisotropy from Cluster 1,Tek/Te⊥, which
cov-ers the time period during which the Cluster spacecraft were inside the cusp region observing the low-frequency waves. In this figure we clearly see that during most of this time the ratio is above 1. Thus, we can rule out that these waves were generated locally by the cyclotron instability at the ex-act time they were observed, since this instability requires
Tek/Te⊥<1 to grow. However, as shown in Fig. 9, there
are still some time periods of short duration where the ratio
Tek/Te⊥is<1, allowing for the possibility that these waves
were generated elsewhere in the cusp region but observed by the spacecraft as they propagated away from the generation
site (Pickett et al., 2001). Even in the case where cyclotron in-stability is generated locally the electron energies that could cause the instability to take place range from a few eV up to several keV (Pickett et al., 2001), far below the energies that RAPID measures. Consequently, it is reasonable to conclude that the supra-thermal electrons above∼25 keV are the effect and not the cause of the observed waves.
3.5 Supra-thermal ionospheric oxygen ions in the magne-totail and their relation to substorm initiation process During the course of auroral expansion toward the poles we expect the ionosphere to supply ions to the plasma sheet from the substorm initiation region in the inner magneto-tail up to very distant locations. Based on a simulation work by Winglee (2003) who modeled single particle trajectories, heavy ions from both the cusp and the nightside aurora have preferential access to the nightside near-Earth plasma sheet. Complementaly to the above simulations, our observations suggest further that the turbulent cusp region is a energetic O+ion reservoir which could continuously supply the mag-netotail with energetic oxygen ions whose behavior is inti-mately related to the magnetospheric substorm evolution, as discussed below.
The role ofBzfor the initiation of substorm process
trans-ported from a reconnection site was first realized by Vogiatzis et al. (2005). As Vogiatzis et al. (2005) have proposed and then observationally confirmed by Shiokawa et al. (2005), supply of the inner edge of the plasma sheet (the transition region between bipolar and stretched magnetic field config-uration) withBz<0 would excite kinetic instabilities in the
vicinity of the current sheet due to the increased relative drift velocity between non-adiabatic ions and adiabatic electrons. This enhanced wave turbulence would have the effect of dis-rupting the cross-tail current, forming the substorm current wedge and thus signaling the onset of a substorm. Due to the fact that this velocity is also proportional to the non-adiabaticity of the ions and since non-non-adiabaticity is being enhanced with increasing particle’s gyroradius, one would expect that supra-thermal singly ionized oxygens in the en-ergy range of RAPID would be the ideal candidate for maxi-mum increase of this relative drift velocity. The critical ques-tion now is: What region of geospace could provide such a highly non-adiabatic population? Based on our observa-tions we could say that the polar cusp might be one of the source regions which could provide supra-thermal O+to the
nightside equatorial plasma sheet through the Shabansky or-bits along closed field lines (Fritz et al., 2000, 2003). Con-sequently, in the course of a substorm and under the appro-priate conditions set up by reconnection back in the mag-netotail (earthward transportation of Bz<0) supra-thermal
[image:14.595.54.283.66.402.2]4 Synopsis and conclusions
This paper presents a study of the CNO accelerated ions (predominantly singly ionized oxygen ions) observed by the Cluster/RAPID instrument in the exterior cusp region during spring 2001 and 2002. Our investigation shows that all the events in the cusp region are of spatial nature with energetic particle and wave activity enhancements being registered when Cluster spacecraft enter the cusp diamagnetic cavities. The simultaneous observations of sharp enhancements in the low-frequency electromagnetic wave fields provide strong evidence that heating/acceleration of ions/electrons is caused by resonant interactions with the broadband low-frequency electromagnetic waves. Furthermore, the particle accelera-tion efficiency seems to depend both on the wave power near the local particle gyrofrequency and on the type and number of cyclotron resonances that particles undergo during their stay in the trapping region. The fact that in every cusp cross-ing we observe outflowcross-ing O+ions in the supra-thermal
en-ergy range has important implications on the substorm initi-ation process since these particles have larger Larmor radius than protons of the same energy and thus are much more non-adiabatic. Consequently, energetic O+, under the appropriate conditions set up by reconnection process back in the magne-totail (Vogiatzis et al., 2005), could be a potential seed popu-lation for exciting kinetic instabilities which trigger substorm onset in the non-adiabatic and sufficiently thin neutral sheet region.
Although we have presented here only two of the events listed in Table 1, the general features occurring in these two cusp crossings are typical and commonly seen in the rest of the events, as well. Thus, observations of supra-thermal par-ticles in the cusp regions for the eight events examined so far, is indicative that these areas of geospace, through the pres-ence of intense low-frequency electromagnetic turbulpres-ence, are capable of accelerating and continuously supplying the magnetosphere with energetic particles with all the implica-tions that this phenomenon may have in magnetospheric dy-namics.
Acknowledgements. We sincerely thank the PIs of the Cluster
in-struments who kindly provided us the data presented in this study. I. I. Vogiatzis especially thanks A. Fazakerley for his valuable com-ments and the PEACE Operations Team for making available the PEACE data used in this paper. We also thank the OVT team for us-ing their software. O. Santolik acknowledges support of the GAAV grant A301120601.
Topical Editor I. A. Daglis thanks P. Daly and another anony-mous referee for their help in evaluating this paper.
References
Andr´e, M. and Yau, A. W.: Theories and observations of ion ener-gization and outflow in the high latitude magnetosphere, Space Sci. Rev., 80, 27–48, 1997.
Andr´e, M., Crew, G. B., Peterson, W. K., et al.: Ion heating by broadband low-frequency waves in the cusp/cleft, J. Geophys. Res., 95, 20 809–20 823, 1990.
Arvelius, S., Yamauchi, M., Nilsson, H., et al.: Statistics of
high-altitude and high-latitude O+ ion outflows observed by
Clus-ter/CIS, Ann. Geophys., 23, 1909–1916, 2005, http://www.ann-geophys.net/23/1909/2005/.
Asikainen, T. and Mursula, K.: Reconnection and energetic particles at the edge of the exterior cusp, Ann. Geophys., 24, 1949–1956, 2006,
http://www.ann-geophys.net/24/1949/2006/.
Balogh, A., Dunlop, M. W., Cowley, S. W., et al.: The Cluster mag-netic field investigation, Space Sci. Rev., 79, 65–91, 1997. Błe¸cki, J., Savin, S., Rothkaehl, H., et al.: The role of wave-particle
interactions in the dynamics of plasma in the polar cusp, Cosmic Res., 41, 332–339, 2003.
Bogdanova, Y. V., Klecker, B., Paschmann, G., et al.: Investiga-tion of the source region of ionospheric oxygen outflow in the cleft/cusp using multi-spacecraft observations by CIS onboard Cluster, Adv. Space Res., 34, 2459–2464, 2004.
Bouhram, M., Dubouloz, N., Malingre, M., et al.: Ion outflow and associated perpendicular heating in the cusp observed by Interball Auroral Probe and Fast Auroral Snapshot, J. Geophys. Res., 107, A2, doi:10.1029/2001JA000 091, 2002.
Bouhram, M., Malingre, M., Jasperse, J. R., et al.: Modelling trans-verse heating and outflow of ionospheric ions from the dayside cusp/cleft. 1 A parametric study, Ann. Geophys., 21, 1753–1771, 2003,
http://www.ann-geophys.net/21/1753/2003/.
Bouhram, M., Klecker, B., Miyake, W., et al.: On the altitude
depen-dence of transversely heated O+distributions in the cusp/cleft,
Ann. Geophys., 22, 1787–1798, 2004, http://www.ann-geophys.net/22/1787/2004/.
Chen, J. and Fritz, T. A.: Correlation of cusp MeV helium with tur-bulent ULF power spectra and its implications, Geophys. Res. Lett., 25, 4113–4116, 1998a.
Chen, J. and Fritz, T. A.: Features of the cusp energetic particle events, Adv. Space Res., 24, 103–107, 1998b.
Chen, J. and Fritz, T. A.: Origins of energetic ions in CEP events and their implications, Int. J. Geomagn. Aeron., 2, 31–44, 2000. Chen, J., Fritz, T. A., Sheldon, R. B., Spence, H. E., et al.: A new temporarily confined population in the polar cap during the August 27, 1996 geomagnetic field distortion period, Geophys. Res. Lett., 24, 1447–1450, 1997.
Chen, J., Fritz, T. A., Sheldon, R. B., Spence, H. E., et al.: Cusp en-ergetic particle events: Implications for a major acceleration re-gion of the magnetosphere, J. Geophys. Res., 103, 69–78, 1998. Cornilleau-Wehrlin, N., Chauveau, P., Louis, S., et al.: The Cluster spatio-temporal analysis of field fluctuations (STAFF) experi-ment, Space Sci. Rev., 79, 107–136, 1997.
Daglis, I. A. and Axford, W. I.: Fast ionospheric response to en-hanced activity in geospace: Ion feeding of the inner magnetotail, J. Geophys. Res., 101, 5047–5065, 1996.
Dubouloz, N., Delcourt, D., Malingre, M., et al.: Remote analy-sis of cleft ion acceleration using thermal plasma measurements from Interball Auroral Probe, Geophys. Res. Lett., 25, 2925– 2928, 1998.
Dubouloz, N., Bouhram, M., Senior, C., et al.: Spatial structure of the cusp/cleft ion fountain: A case study using a magnetic
668 I. I. Vogiatzis et al.: Supra-thermal particle acceleration in the cusp region
gacy between Interball AP and a pair of SuperDARN radars, J. Geophys. Res., 106, 261–274, 2001.
Fritz, T. A., Chen, J., and Sheldon, B.: The role of the cusp as a source for magnetospheric particles: A new paradigm?, Adv. Space Res., 25, 1445–1457, 2000.
Fritz, T. A., Chen, J., and Siscoe, G. L.: Energetic ions, large dia-magnetic cavities, and Chapman-Ferraro cusp, J. Geophys. Res., 108, A1, doi:10.1029/2002JA009476, 2003.
Gorney, D. J., Clarke, A., Croley, D., et al.: The distribution of ion beams and conics below 8000 km, J. Geophys. Res., 86, 83–89, 1981.
Grison, B., Sahraoui, F., Lavraud, B., et al.: Wave particle interac-tions in the high-altitude polar cusp: a Cluster case study, Ann. Geophys., 23, 3699–3713, 2005,
http://www.ann-geophys.net/23/3699/2005/.
Gustafsson, G., Bostrom, R., Holback, B., et al.: The electric field and wave experiment for the Cluster mission, Space Sci. Rev., 79, 137–156, 1997.
Haerendel, G. and Paschmann, G.: Entry of solar wind plasma into the magnetosphere, in: Physics of the Hot Plasma in the Magnetosphere, edited by: Hultqvist, B. and Stenflo, L., p. 23, Plenum, New York, 1975.
Haerendel, G., Paschmann, G., Sckopke, N., et al.: The frontside boundary layer of the magnetosphere and the problem of recon-nection, J. Geophys. Res., 83, 3195–3216, 1978.
Johnstone, A. D., Alsop, C., Burge, S., et al.: Peace: A Plasma Electron and Current Experiment, Space Sci. Rev., 79, 351–398, 1997.
Khotyaintsev, Y., Vaivads, A., Ogawa, Y., et al.: Cluster observa-tions of high-frequency waves in the exterior cusp, Ann. Geo-phys., 22, 2403–2411, 2004,
http://www.ann-geophys.net/22/2403/2004/.
Kistler, L. M., Mouikis, C., M¨obius, E., et al.: Contribution of
nonadiabatic ions to the cross-tail current in an O+
dom-inated thin current sheet, J. Geophys. Res., 110, A06213, doi:10.1029/2004JA010653, 2005.
Kistler, L. M., Mouikis, C., Cao, X., et al.: Ion compostition and pressure changes in storm time and nonstorm substorms in the vicinity of the near-Earth neutral line, J. Geophys. Res., 111, A11222, doi:10.1029/2006JA011939, 2006.
Le, G., Blanco-Cano, X., Russell, C. T., et al.: Electromagnetic ion cyclotron waves in the high-altitude cusp: Polar observations, J. Geophys. Res., 106, 19 067–19 079, 2001.
Lee, M. A.: Coupled hydromagnetic wave excitation and ion accel-eration upstream of the Earth’s bow shock, J. Geophys. Res., 87, 5063–5080, 1982.
Lundin, R. and Eliasson, L.: Auroral energization processes, Ann. Geophys., 9, 202–223, 1991,
http://www.ann-geophys.net/9/202/1991/.
Lundin, R., Eliasson, L., and Stasiewicz, K.: Plasma energization on auroral field lines as observed by the Viking spacecraft, Geo-phys. Res. Lett., 14, 443–446, 1987.
Maksimovic, M., Harvey, C. C., Santolik, O., et al.: Polarisation and propagation of lion roars in the duskside magnetosheath, Ann. Geophys., 19, 1429–1438, 2001,
http://www.ann-geophys.net/19/1429/2001/.
Moore, T. E., Lundin, R., Alcayde, D., et al.: Source processes in the high-altitude ionosphere, Space Sci. Rev., 88, 7–84, 1999. Nilsson, H., Joko, S., Lundin, R., et al.: The structure of high
alti-tude O+energization and outflow: a case study, Ann. Geophys.,
22, 2497–2506, 2004,
http://www.ann-geophys.net/22/2497/2004/.
Peterson, W. K., Shelley, E. G., Boarsen, S. A., et al.: Transverse ion energization and low-frequency plasma waves in the mid-altitude auroral zone: A case study, J. Geophys. Res., 93, 11 405–11 428, 1988.
Pickett, J. S., Franz, J. R., Scudder, J. D., et al.: Plasma waves ob-served in the cusp turbulent boundary layer: An analysis of high time resolution wave and particle measurements from the Polar spacecraft, J. Geophys. Res., 106, 19 081–19 100, 2001. Pissarenko, N. F., Kirpichev, I. P., Lutsenko, V. N., et al.: Cusp
en-ergetic particles observed by INTERBALL-Tail probe in 1996, Phys. Chem. Earth, 26, 241–245, 2001.
R`eme, H., Bosqued, J. M., Sauvaud, J. A., et al.: The Cluster ion spectrometry (CIS) experiment, Space Sci. Rev., 79, 303–350, 1997.
Russell, C. T.: The polar cusp, Adv. Space Res., 25, 1413–1424, 2000.
Santol´ık, O., Lefeuvre, F., Parrot, M., and Rauch, J. L.: Complete wave-vector directions of electromagnetic emissions: Applica-tion to INTERBALL-2 measurements in the nightside auroral zone, J. Geophys. Res., 106, 13 191–13 201, 2001.
Santol´ık, O., Picket, J. S., Gurnett, D. A., and Storey, L. R. O.: Magnetic component of narrow-band ion cyclotron waves in the auroral zone, J. Geophys. Res., 107, A12, doi:10.1029/2001JA000146, 2002.
Santol´ık, O., Parrot, M., and Lefeuvre, F.: Singular value decompo-sition methods for wave propagation analysis, Radio. Sci., 38(1), 1, doi:10.1029/2000RS002523, 2003.
Sauvaud, J.-A., Louarn, P., Fruit, G., et al.: Case studies of the dy-namics of ionospheric ions in the Earth’s magnetotail, J. Geo-phys. Res., 109, A01212, doi:10.1029/2003JA009 996, 2004. Savin, S., Zelenyi, L., Romanov, S., et al.: Magnetosheath-cusp
in-terface, Ann. Geophys., 22, 183–212, 2004, http://www.ann-geophys.net/22/183/2004/.
Sheldon, R. B., Spence, H. E., Sullivan, J. D., et al.: The discovery of trapped energetic electrons in the outer cusp, Geophys. Res. Lett., 25, 1825–1828, 1998.
Shiokawa, K., Miyashita, Y., Shinohara, I., and Matsuoka,
A.: Decrease in Bz prior to the dipolarization in the
near-Earth plasma sheet, J. Geophys. Res., 110, A09 219, doi:10.1029/2005JA011144, 2005.
Thelin, B., Aparicio, B., and Lundin, R.: Observations of upflowing ionospheric ions in the mid-altitude cusp/cleft region with the Viking satellite, J. Geophys. Res., 95, 5931–5939, 1990. Trattner, K. J., Fuselier, S. A., Peterson, W. K., et al.: Origins of
energetic ions in the cusp, J. Geophys. Res., 106, 5967–5976, 2001.
Vogiatzis, I. I., Fritz, T. A., Zong, Q.-G., Baker, D. N., Sarris, E. T., and Daly, P. W.: Fine-time energetic electron behavior observed by Cluster/RAPID in the magnetotail associated with X-line for-mation and subsequent current disruption, Ann. Geophys., 23, 2265–2280, 2005,
http://www.ann-geophys.net/23/2265/2005/.
Wilken, B., Axford, W. I., Daglis, I., et al.: RAPID: The imaging energetic particle spectrometer on Cluster, Space Sci. Rev., 79, 399–473, 1997.
populations during extended southward interplanetary magnetic field, J. Geophys. Res., 108, A10, doi:10.1029/2002JA009819, 2003.
Yau, A. W. and Andr´e, M.: Sources of ion outflow in the high lati-tude ionosphere, Space Sci. Rev., 80, 1–25, 1997.
Zong, Q.-G., Fritz, T. A., Korth, A., et al.: Energetic electrons as a field line topology tracer in the high latitude boundary/cusp region: Cluster/RAPID observations, Surv. Geophys., 26, 215– 240, 2005.