56
physicspp.com
What You’ll Learn
• You will develop descriptions of accelerated motion. • You will use graphs and
equations to solve problems involving moving objects. • You will describe the
motion of objects in free fall.
Why It’s Important
Objects do not always move at constant velocities. Understanding accelerated motion will help you better decribe the motion of many objects.Acceleration Cars, planes, subways, elevators, and other common forms of transportation often begin their journeys by speeding up quickly, and end by stopping rapidly.
Think About This
The driver of a dragster on the starting line waits for the green light to signal the start of the race. At the signal, the driver will step on the gas pedal and try to speed up as quickly as possible. As the car speeds up, how will its position change?
Rob Tringali/SportsChrome
Do all types of motion look
the same when graphed?
Question
How does a graph showing constant speed compare to a graph of a vehicle speeding up?
Procedure
1.Clamp a spark timer to the back edge of a lab
table.
2.Cut a piece of timer tape approximately 50 cm
in length, insert it into the timer, and tape it to vehicle 1.
3.Turn on the timer and release the vehicle.
Label the tape with the vehicle number.
4.Raise one end of the lab table 8–10 cm by
placing a couple of bricks under the back
legs. CAUTION: Make sure the lab table
remains stable.
5.Repeat steps 2–4 with vehicle 2, but hold the
vehicle in place next to the timer and release it after the timer has been turned on. Catch the vehicle before it falls.
6.Construct and Organize Data Mark the first dark dot where the timer began as
zero.Measure the distance to each dot from the zero dot for 10 intervals and record your data.
7. Make and Use Graphs Make a graph of total distance versus interval number. Place data for both vehicles on the same plot and label each graph.
Analysis
Which vehicle moved with constant speed? Which one sped up? Explain how you determined this by looking at the timer tape.
Critical Thinking Describe the shape of each graph. How does the shape of the graph relate to the type of motion observed?
3.1
Acceleration
Objectives •Defineacceleration. •Relatevelocity and
acceleration to the motion of an object.
•Createvelocity-time graphs.
Vocabulary velocity-time graph acceleration average acceleration instantaneous acceleration
U
niform motion is one of the simplest kinds of motion. You learnedin Chapter 2 that an object in uniform motion moves along a straight line with an unchanging velocity. From your own experiences, you know, however, that few objects move in this manner all of the time. In this chapter, you will expand your knowledge of motion by considering a slightly more complicated type of motion. You will be presented with situations in which the velocity of an object changes, while the object’s motion is still along a straight line. Examples of objects and situations you will encounter in this chapter include automobiles that are speeding up, drivers applying brakes, falling objects, and objects thrown straight upward. In Chapter 6, you will continue to add to your knowledge of motion by analyzing some common types of motion that are not confined to a straight line. These include motion along a circular path and the motion of thrown objects, such as baseballs.
Section 3.1 Acceleration 57
Horizons Companies
58 Chapter 3 Accelerated Motion
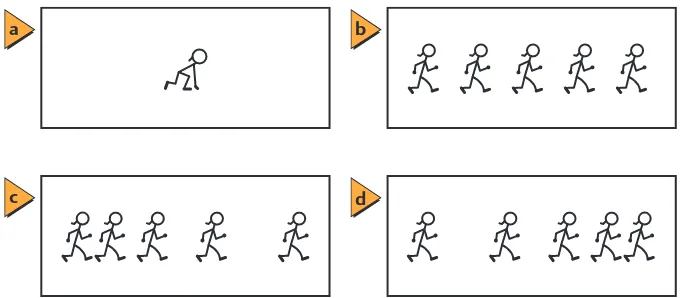
■Figure 3-1 By noting the distance the jogger moves in equal time intervals, you can determine that the jogger is standing still (a),moving at a constant speed (b),speeding up (c),and slowing down (d).
Changing Velocity
You can feel a difference between uniform and nonuniform motion. Uniform motion feels smooth. You could close your eyes and it would feel as though you were not moving at all. In contrast, when you move along a curve or up and down a roller coaster, you feel pushed or pulled.
Consider the motion diagrams shown in Figure 3-1.How would you describe the motion of the person in each case? In one diagram, the person is motionless. In another, she is moving at a constant speed. In a third, she is speeding up, and in a fourth, she is slowing down. How do you know which one is which? What information do the motion diagrams contain that could be used to make these distinctions?
[image:3.660.199.539.580.729.2]The most important thing to notice in these motion diagrams is the distance between successive positions. You learned in Chapter 2 that motionless objects in the background of motion diagrams do not change positions. Therefore, because there is only one image of the person in Figure 3-1a, you can conclude that she is not moving; she is at rest. Figure 3-1bis like the constant-velocity motion diagrams in Chapter 2. The distances between images are the same, so the jogger is moving at a constant speed. The distance between successive positions changes in the two remaining diagrams. If the change in position gets larger, the jogger is speeding up, as shown in Figure 3-1c. If the change in position gets smaller, as in Figure 3-1d,the jogger is slowing down.
What does a particle-model motion diagram look like for an object with changing velocity? Figure 3-2shows the particle-model motion diagrams below the motion diagrams of the jogger speeding up and slowing down. There are two major indicators of the change in velocity in this form of the motion diagram. The change in the spacing of the dots and the differences in the lengths of the velocity vectors indicate the changes in velocity. If an object speeds up, each subsequent velocity vector is longer. If the object slows down, each vector is shorter than the previous one. Both types of motion diagrams give an idea of how an object’s velocity is changing.
Velocity-Time Graphs
Just as it was useful to graph a changing position versus time, it also is useful to plot an object’s velocity versus time, which is called a velocity-time, or v-t graph. Table 3-1 on the next page shows the data for a car that starts at rest and speeds up along a straight stretch of road.
a
c
b
d
A Steel
Ball Race
If two steel balls are released at the same instant, will the steel balls get closer or farther apart as they roll down a ramp? 1.Assemble an inclined ramp from a piece of U-channel or two metersticks taped together. 2. Measure40 cm from the top of the ramp and place a mark there. Place another mark 80 cm from the top.
3. Predictwhether the steel balls will get closer or farther apart as they roll down the ramp. 4.At the same time, release one steel ball from the top of the ramp and the other steel ball from the 40-cm mark.
5.Next, release one steel ball from the top of the ramp. As soon as it reaches the 40-cm mark, release the other steel ball from the top of the ramp.
Analyze and Conclude
6. Explainyour observations in terms of velocities.
7.Do the steel balls have the same velocity as they roll down the ramp? Explain. 8.Do they have the same acceleration? Explain.
Section 3.1 Acceleration 59 5.00
4.00 1.00 2.00 3.00
25.0
20.0
15.0
10.0
5.00
V
elocity (m/s)
Time (s) 0.00
Velocity v. Time
mrriusne10.0 m/s2.00 s 5.00 m/s2
■Figure 3-2 The particle-model version of the motion diagram indicates the runner’s changing velocity not only by the change in spacing of the position dots, but also by the change in length of the velocity vectors.
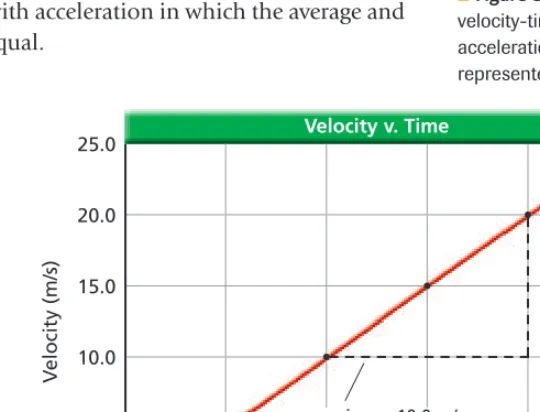
■Figure 3-3 The slope of a velocity-time graph is the acceleration of the object represented.
The velocity-time graph obtained by plotting these data points is shown in Figure 3-3. The positive direction has been chosen to be the same as that of the motion of the car. Notice that this graph is a straight line, which means that the car was speeding up at a constant rate. The rate at which the car’s velocity is changing can be found by calculating the slope of the velocity-time graph.
The graph shows that the slope is (10.0 m/s)/(2.00 s), or 5.00 m/s2. This
means that every second, the velocity of the car increased by 5.00 m/s. Consider a pair of data points that are separated by 1 s, such as 4.00 s and 5.00 s. At 4.00 s, the car was moving at a velocity of 20.0 m/s. At 5.00 s, the car was traveling at 25.0 m/s. Thus, the car’s velocity increased by 5.00 m/s in 1.00 s. The rate at which an object’s velocity changes is called the accelerationof the object. When the velocity of an object changes at a constant rate, it has a constant acceleration.
Average and Instantaneous Acceleration
[image:4.666.243.513.523.729.2]The average accelerationof an object is the change in velocity during some measurable time interval divided by that time interval. Average accel-eration is measured in m/s2. The change in velocity at an instant of time is called instantaneous acceleration.The instantaneous acceleration of an object can be found by drawing a tangent line on the velocity-time graph at the point of time in which you are interested. The slope of this line is equal to the instantaneous acceleration. Most of the situations considered in this textbook involve motion with acceleration in which the average and instantaneous accelerations are equal.
Table 3-1
Velocity v. Time
Time (s) Velocity (m/s)
0.00 1.00 2.00 3.00 4.00 5.00
0.00 5.00 10.0 15.0 20.0 25.0
60 Chapter 3 Accelerated Motion
Velocity and Acceleration How would you describe the sprinter’s velocity and acceleration as shown on the graph?
Analyze and Sketch the Problem
• From the graph, note that the sprinter’s velocity starts at
zero, increases rapidly for the first few seconds, and then, after reaching about 10.0 m/s, remains almost constant.
Known: Unknown:
vvaries a?
Solve for the Unknown
Draw a tangent to the curve at t1.0 s and t5.0 s.
Solve for acceleration at 1.0 s:
arriusne
3.4 m/s2
Solve for acceleration at 5.0 s:
ar
r i u
s n e
0.030 m/s2
The acceleration is not constant because it changes from 3.4 m/s2to 0.03 m/s2at 5.0 s.
The acceleration is in the direction chosen to be positive because both values are positive.
Evaluate the Answer
• Are the units correct? Acceleration is measured in m/s2.
3
10.3 m/s10.0 m/s 10.0 s0.00 s
The slope of the line at 5.0 s is equal to the acceleration at that time.
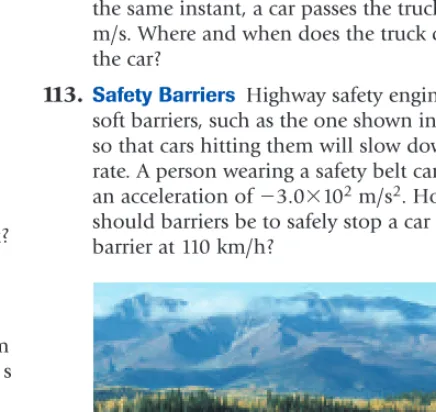
11.0 m/s2.8 m/s 2.4 s0.00 s
The slope of the line at 1.0 s is equal to the acceleration at that time.
2 1
Math Handbook
Slope page 850
vi
vi vf
vf
∆v a
vi vf
10.0 5.00
0.00 6.0 12.0
V
elocity (m/s)
Time (s) ■Figure 3-4 Looking at two
consecutive velocity vectors and finding the difference between them yields the average acceleration vector for that time interval.
Displaying Acceleration on a Motion Diagram
For a motion diagram to give a full picture of an object’s movement, it also should contain information about acceleration. This can be done by including average acceleration vectors. These vectors will indicate how the velocity is changing. To determine the length and direction of an average acceleration vector, subtract two consecutive velocity vectors, as shown in Figures 3-4aand b.That is, vvfvivf(vi). Then divide by the time interval, t. In Figures 3-4a and b, the time interval, t, is 1 s. This vec-tor, (vfvi)/1 s, shown in violet in Figure 3-4c,is the average acceleration during that time interval. The velocities viand vfrefer to the velocities at the beginning and end of a chosen time interval.
a
b
c
• Acceleration vectors are violet.
• Velocity vectors are red.
• Displacement vectors are
green.
Section 3.1 Acceleration 61
v2
v2 v
v
v1
v1 a
v2 v1 a a
v2 v v1
a
v
Begin End
Begin End
End Begin
End Begin
1. A dog runs into a room and sees a cat at the other end of the
room. The dog instantly stops running but slides along the wood floor until he stops, by slowing down with a constant acceleration. Sketch a motion diagram for this situation, and use the velocity vectors to find the acceleration vector.
2. Figure 3-5is a v-tgraph for Steven as he walks along the midway at the state fair. Sketch the corresponding motion diagram, complete with velocity vectors.
3. Refer to the v-tgraph of the toy train in Figure 3-6to answer
the following questions.
a. When is the train’s speed constant?
b. During which time interval is the train’s acceleration positive?
c. When is the train’s acceleration most negative?
4. Refer to Figure 3-6 to find the average acceleration of the train
during the following time intervals.
a. 0.0 s to 5.0 s b. 15.0 s to 20.0 s c. 0.0 s to 40.0 s
5. Plot a v-tgraph representing the following motion. An elevator
starts at rest from the ground floor of a three-story shopping
mall. It accelerates upward for 2.0 s at a rate of 0.5 m/s2,
continues up at a constant velocity of 1.0 m/s for 12.0 s, and then
experiences a constant downward acceleration of 0.25 m/s2for
4.0 s as it reaches the third floor.
■Figure 3-7 These four motion diagrams represent the four different possible ways to move along a straight line with constant acceleration (a).When the velocity vectors of the motion diagram and acceleration vectors point in the same direction, an object’s speed increases. When they point in opposite directions, the object slows down (b).
V
elocity (m/s)
Time (s)
5 6 7 8 9
4 3 2 1
0 10
30.0 20.0
10.0 40.0
0.0 6.0 4.0 2.0 12.0 10.0 8.0
V
elocity (m/s)
Time (s)
■Figure 3-5
■Figure 3-6
Positive and Negative Acceleration
Consider the four situations shown in Figure 3-7a. The first motion diagram shows an object moving in the positive direction and speeding up. The second motion diagram shows the object moving in the positive direction and slowing down. The third shows the object speeding up in the negative direction, and the fourth shows the object slowing down as it moves in the negative direction. Figure 3-7bshows the velocity vectors for the second time interval of each diagram, along with the corresponding acceleration vectors. Note ∆tis equal to 1 s.
a b
62 Chapter 3 Accelerated Motion
In the first and third situations when the object is speeding up, the velocity and accel-eration vectors point in the same direction in each case, as shown in Figure 3-7b. In the other two situations in which the accelera-tion vector is in the opposite direcaccelera-tion from the velocity vectors, the object is slowing down. In other words, when the object’s acceleration is in the same direction as its velocity, the object’s speed increases. When they are in opposite directions, the speed decreases. Both the direction of an object’s velocity and its direction of acceleration are needed to determine whether it is speeding up or slowing down. An object has a positive acceleration when the acceleration vector points in the positive direction and a negative acceleration, when the accel-eration vector points in the negative direction. The sign of accelaccel-eration does not indicate whether the object is speeding up or slowing down.
Determining Acceleration from a
v
-
t
Graph
Velocity and acceleration information also is contained in velocity-time graphs. Graphs A, B, C, D, and E, shown in Figure 3-8, represent the motions of five different runners. Assume that the positive direction has been chosen to be east. The slopes of Graphs A and E are zero. Thus, the accelerations are zero. Both Graphs A and E show motion at a constant velocity—Graph A to the east and Graph E to the west. Graph B shows motion with a positive velocity. The slope of this graph indicates a con-stant, positive acceleration. You also can infer from Graph B that the speed increased because it shows positive velocity and acceleration. Graph C has a negative slope. Graph C shows motion that begins with a positive veloc-ity, slows down, and then stops. This means that the acceleration and velocity are in opposite directions. The point at which Graphs C and B cross shows that the runners’ velocities are equal at that point. It does not, however, give any information about the runners’ positions.
Graph D indicates movement that starts out toward the west, slows down, and for an instant gets to zero velocity, and then moves east with increasing speed. The slope of Graph D is positive. Because the velocity and acceleration are in opposite directions, the speed decreases and equals zero at the time the graph crosses the axis. After that time, the velocity and acceleration are in the same direction and the speed increases.
Calculating acceleration How can you describe acceleration mathemati-cally? The following equation expresses average acceleration as the slope of the velocity-time graph.
Average Acceleration a v
t
v
t
f f
v ti
i
Average acceleration is equal to the change in velocity, divided by the time it takes to make that change.
0
V
elocity (m/s)
Time (s) A
E B
D C
East
West
■Figure 3-8 Graphs A and E show motion with constant velocity in opposite directions. Graph B shows both positive velocity and positive acceleration. Graph C shows positive velocity and negative acceleration. Graph D shows motion with constant positive acceleration that slows down while velocity is negative and speeds up when velocity is positive.
Section 3.1 Acceleration 63
Acceleration Describe the motion of a ball as it rolls up a slanted driveway. The ball starts at 2.50 m/s, slows down for 5.00 s, stops for an instant, and then rolls back down at an increasing speed. The positive direction is chosen to be up the driveway, and the origin is at the place where the motion begins. What is the sign of the ball’s acceleration as it rolls up the driveway? What is the magnitude of the ball’s acceleration as it rolls up the driveway?
Analyze and Sketch the Problem
• Sketch the situation.
• Draw the coordinate system based on the motion diagram.
Known: Unknown:
vi 2.5 m/s a?
vf0.00 m/s at t5.00 s
Solve for the Unknown
Find the magnitude of the acceleration from the slope of the graph.
Solve for the change in velocity and the time taken to make that change. vvfvi
0.00 m/s2.50 m/s Substitute vf0.00 m/s at tf5.00 s, vi2.50 m/s at ti0.00 s
2.50 m/s t tfti
5.00 s0.00 s Substitute tf5.00 s, ti0.00 s
5.00 s
Solve for the acceleration.
av
t
25..5000ms/s Substitute v 2.50 m/s, t5.00 s
0.500 m/s2or 0.500 m/s2down the driveway
Evaluate the Answer
• Are the units correct? Acceleration is measured in m/s2.
• Do the directions make sense? In the first 5.00 s, the direction of the acceleration is opposite to that of the velocity, and the ball slows down.
3 2 1
Suppose you run wind sprints back and forth across the gym. You first run at 4.0 m/s toward the wall. Then, 10.0 s later, you run at 4.0 m/s away from the wall. What is your average acceleration if the positive direction is toward the wall?
a v
t
v
t
f f
v ti
i
1 8 0
.0 .0
m s /s
0.80 m/s2
The negative sign indicates that the direction of acceleration is away from the wall. The velocity changes when the direction of motion changes, because velocity includes the direction of motion. A change in velocity results in acceleration. Thus, acceleration also is associated with a change in the direction of motion.
(4.0 m/s)(4.0 m/s)
10.0 s
Begin
End Same
point x
a
5.00 10.0
3.00 0.00 3.00
V
elocity (m/s)
Time (s) x
Math Handbook
64 Chapter 3 Accelerated Motion
12. Velocity-Time Graph What information can you obtain from a velocity-time graph?
13. Position-Time and Velocity-Time Graphs Two joggers run at a constant velocity of 7.5 m/s
toward the east. At time t0, one is 15 m east of
the origin and the other is 15 m west.
a.What would be the difference(s) in the
position-time graphs of their motion?
b.What would be the difference(s) in their
velocity-time graphs?
14. Velocity Explain how you would use a velocity-time graph to find the velocity-time at which an object had a specified velocity.
15. Velocity-Time Graph Sketch a velocity-time graph for a car that goes east at 25 m/s for 100 s, then west at 25 m/s for another 100 s.
16. Average Velocity and Average Acceleration A canoeist paddles upstream at 2 m/s and then turns around and floats downstream at 4 m/s. The turn-around time is 8 s.
a.What is the average velocity of the canoe?
b.What is the average acceleration of the canoe?
17. Critical Thinking A police officer clocked a driver going 32 km/h over the speed limit just as the driver passed a slower car. Both drivers were issued speeding tickets. The judge agreed with the officer that both were guilty. The judge-ment was issued based on the assumption that the cars must have been going the same speed because they were observed next to each other. Are the judge and the police officer correct? Explain with a sketch, a motion diagram, and a position-time graph.
3.1
Section Review
physicspp.com/self_check_quiz
6. A race car’s velocity increases from 4.0 m/s to 36 m/s over a 4.0-s time interval. What is
its average acceleration?
7. The race car in the previous problem slows from 36 m/s to 15 m/s over 3.0 s. What is
its average acceleration?
8. A car is coasting backwards downhill at a speed of 3.0 m/s when the driver gets the
engine started. After 2.5 s, the car is moving uphill at 4.5 m/s. If uphill is chosen as the positive direction, what is the car’s average acceleration?
9. A bus is moving at 25 m/s when the driver steps on the brakes and brings the bus to
a stop in 3.0 s.
a. What is the average acceleration of the bus while braking?
b. If the bus took twice as long to stop, how would the acceleration compare with what
you found in part a?
10. Rohith has been jogging to the bus stop for 2.0 min at 3.5 m/s when he looks at his
watch and sees that he has plenty of time before the bus arrives. Over the next 10.0 s, he slows his pace to a leisurely 0.75 m/s. What was his average acceleration during this 10.0 s?
11. If the rate of continental drift were to abruptly slow from 1.0 cm/y to 0.5 cm/y over
the time interval of a year, what would be the average acceleration?
There are several parallels between acceleration and velocity. Both are rates of change: acceleration is the time rate of change of velocity, and velocity is the time rate of change of position. Both acceleration and veloc-ity have average and instantaneous forms. You will learn later in this chap-ter that the area under a velocity-time graph is equal to the object’s displacement and that the area under an acceleration-time graph is equal to the object’s velocity.
Section 3.2 Motion with Constant Acceleration 65 Objectives
•Interpretposition-time graphs for motion with constant acceleration. •Determinemathematical
relationships among position, velocity, acceleration, and time.
•Applygraphical and mathematical relationships to solve problems related to constant acceleration.
3.2
Motion with Constant Acceleration
18. A golf ball rolls up a hill toward a miniature-golf hole. Assume that
the direction toward the hole is positive.
a. If the golf ball starts with a speed of 2.0 m/s and slows at a
constant rate of 0.50 m/s2, what is its velocity after 2.0 s?
b. What is the golf ball’s velocity if the constant acceleration
continues for 6.0 s?
c. Describe the motion of the golf ball in words and with a motion
diagram.
19. A bus that is traveling at 30.0 km/h speeds up at a constant rate of
3.5 m/s2. What velocity does it reach 6.8 s later?
20. If a car accelerates from rest at a constant 5.5 m/s2, how long will
it take for the car to reach a velocity of 28 m/s?
21. A car slows from 22 m/s to 3.0 m/s at a constant rate of 2.1 m/s2.
How many seconds are required before the car is traveling at 3.0 m/s?
Y
ou have learned that the definition of average velocity can bealge-braically rearranged to show the new position after a period of time, given the initial position and the average velocity. The definition of average acceleration can be manipulated similarly to show the new velocity after a period of time, given the initial velocity and the average acceleration.
Velocity with Average Acceleration
If you know an object’s average acceleration during a time interval, you can use it to determine how much the velocity changed during that time. The definition of average acceleration,
a v
t
, can be rewritten as follows:
vat
vfviat
The equation for final velocity with average acceleration can be written as follows.
In cases in which the acceleration is constant, the average acceleration,
a
, is the same as the instantaneous acceleration, a. This equation can be rearranged to find the time at which an object with constant acceleration has a given velocity. It also can be used to calculate the initial velocity of an object when both the velocity and the time at which it occurred are given.
Final Velocity with Average Acceleration vfviat
The final velocity is equal to the initial velocity plus the product of the average acceleration and time interval.
66 Chapter 3 Accelerated Motion Table 3-2
Position-Time Data for a Car
Time (s) Position (m)
0.00 1.00 2.00 3.00 4.00 5.00
0.00 2.50 10.0 22.5 40.0 62.5
Displacement (m)
Position-Time Graph for a Car
5.00 1.00 2.00 3.00 4.00
70.0
60.0
50.0
40.0
30.0
20.0
10.0
0.00
Time (s)
m605.00 s .0 m3.00 s 20.0 m 20.0 m/s
m20
3 . .
0 00
m s1
0 .00
.00 s
m
10.0 m/s
5.00 1.00 2.00 3.00 4.00 25.0
20.0
15.0
10.0
5.00
V
elocity (m/s)
Time (s) 0.00
m
5.00 m/s2
20.0 m/s15.0 m/s
4.00 s 3.00 s
4 3 2 1 0
10 9 8 7 6 5 4 3 2 1
V
elocity (m/s)
Time (s)
∆t
v
a b
Position with Constant Acceleration
You have learned that an object experiencing constant acceleration changes its velocity at a constant rate. How does the position of an object with constant acceleration change? The position data at different time intervals for a car with constant acceleration are shown in Table 3-2.
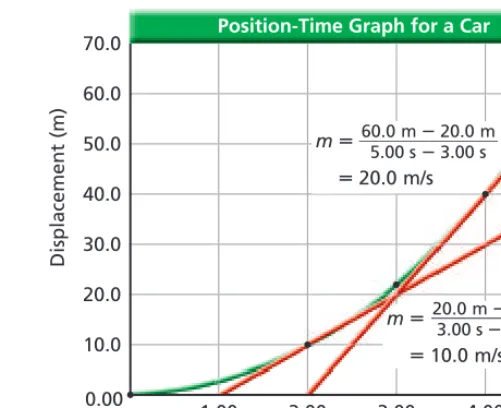
The data from Table 3-2 are graphed in Figure 3-9.The graph shows that the car’s motion is not uniform: the displacements for equal time intervals on the graph get larger and larger. Notice that the slope of the line in Figure 3-9 gets steeper as time goes on. The slopes from the position-time graph can be used to create a velocity-position-time graph. Note that the slopes shown in Figure 3-9 are the same as the velocities graphed in Figure 3-10a. A unique position-time graph cannot be created using a velocity-time graph because it does not contain any information about the object’s posi-tion. However, the velocity-time graph does contain information about the object’s displacement. Recall that for an object moving at a constant velocity, vv d/t, so dvt. On the graph in Figure 3-10b, v is the height of the plotted line above the t-axis, while t is the width of the shaded rectangle. The area of the rectangle, then, is vt, or d. Thus, the area under the v-tgraph is equal to the object’s displacement.
■Figure 3-10 The slopes of the p-tgraph in Figure 3-9 are the values of the corresponding v-t graph (a).For any v-tgraph, the displacement during a given time interval is the area under the graph (b).
■Figure 3-9 The slope of a position-time graph of a car moving with a constant acceleration gets steeper as time goes on.
22. Use Figure 3-11to determine the velocity of an airplane that is speeding up at each of the following times.
a. 1.0 s b. 2.0 s c. 2.5 s
23. Use dimensional analysis to convert an airplane’s speed of
75 m/s to km/h.
24. A position-time graph for a pony running in a field is shown
in Figure 3-12.Draw the corresponding velocity-time graph using the same time scale.
25. A car is driven at a constant velocity of 25 m/s for 10.0 min. The
car runs out of gas and the driver walks in the same direction at 1.5 m/s for 20.0 min to the nearest gas station. The driver takes 2.0 min to fill a gasoline can, then walks back to the car at 1.2 m/s and eventually drives home at 25 m/s in the direction opposite that of the original trip.
a. Draw a v-tgraph using seconds as your time unit.
Calculate the distance the driver walked to the gas station to find the time it took him to walk back to the car.
b. Draw a position-time graph for the situation using the
areas under the velocity-time graph.
0.0 1.0 2.0 3.0 82
80
78
76
74
72
70
V
elocity (m/s)
Time (s)
Displacement (m)
Time (s) x
y
■Figure 3-11
■Figure 3-12
Section 3.2 Motion with Constant Acceleration 67
Finding the Displacement from a v-tGraph The v-t graph below shows the motion of an airplane. Find the displacement of the airplane at t1.0 s and at t2.0 s.
Analyze and Sketch the Problem
• The displacement is the area under the v-tgraph.
• The time intervals begin at t0.0.
Known: Unknown:
v 75 m/s d? t1.0 s
t2.0 s
Solve for the Unknown
Solve for displacement during t1.0 s.
dvt
(75 m/s)(1.0 s) Substitute v 75 m/s, t1.0 s
75 m
Solve for displacement during t2.0 s.
dvt
(75 m/s)(2.0 s) Substitute v 75 m/s, t2.0 s
150 m
Evaluate the Answer
• Are the units correct? Displacement is measured in meters.
• Do the signs make sense? The positive sign agrees with the graph.
• Is the magnitude realistic? Moving a distance equal to about one football field is reasonable for an airplane.
3 2 1
0.0 1.0 2.0 3.0 82
80
78
76
74
72
V
elocity (m/s)
Time (s)
∆t
∆t
Math Handbook
Operations with Significant Digits pages 835–836
0
V
elocity (m/s)
Time (s)
vf
ti tf
vi
[image:13.660.44.179.37.120.2]■Figure 3-13 The displacement of an object moving with constant acceleration can be found by computing the area under the v-tgraph.
Table 3-3
Equations of Motion for Uniform Acceleration
Equation Variables Initial Conditions
vfviatf tf, vf, a vi
dfdivitf12atf2 t
f, df, a di, vi
vf2v
i22a(dfdi) df, vf, a di, vi
Drag Racing A dragster
driver tries to obtain maximum acceleration over a 402-m (quarter-mile) course. The fastest time on record for the 402-m course is 4.480 s. The highest final speed on record is 147.63 m/s (330.23 mph).
The area under the v-t graph is equal to the object’s displacement. Consider the v-tgraph in Figure 3-13for an object moving with constant acceleration that started with an initial velocity of vi. What is the object’s displacement? The area under the graph can be calculated by dividing it into a rectangle and a triangle. The area of the rectangle can be found by drectanglevit, and the area of the triangle can be found by
dtriangle1
2vt. Because average acceleration, a, is equal to v/t,
vcan be rewritten as at. Substituting vatinto the equation for the triangle’s area yields dtriangle12(at)t, or 12a(t)2. Solving for the total
area under the graph results in the following:
d drectangle dtrianglevi(t) 1
2a(t)
2
When the initial or final position of the object is known, the equation can be written as follows:
dfdivi(t) 1
2a(t)
2 or d
fdivi(t)
1 2a(t)
2
If the initial time is ti0, the equation then becomes the following.
An Alternative Expression
Often, it is useful to relate position, velocity, and constant acceleration without including time. Rearrange the equation vfviatf to solve for time: tfvf
a
vi
.
Rewriting dfdivitf1
2atf2by substituting tfyields the following:
dfdivivf
a
vi
1
2a
vf a
vi
2This equation can be solved for the velocity, vf, at any time, tf.
The three equations for motion with constant acceleration are summa-rized in Table 3-3.Note that in a multi-step problem, it is useful to add additional subscripts to identify which step is under consideration.
Velocity with Constant Acceleration vf2v
i22a(dfdi) The square of the final velocity equals the sum of the square of the initial velocity and twice the product of the acceleration and the displacement since the initial time.
Position with Average Acceleration dfdivitf1 2atf2 An object’s position at a time after the initial time is equal to the sum of its initial position, the product of the initial velocity and the time, and half the product of the acceleration and the square of the time.
68 Chapter 3 Accelerated Motion
26. A skateboarder is moving at a constant velocity of 1.75 m/s when she starts up an incline that causes her to slow down with a
constant acceleration of 0.20 m/s2. How much time passes from
when she begins to slow down until she begins to move back down the incline?
27. A race car travels on a racetrack at 44 m/s and slows at a constant
rate to a velocity of 22 m/s over 11 s. How far does it move during this time?
28. A car accelerates at a constant rate from 15 m/s to 25 m/s while
it travels a distance of 125 m. How long does it take to achieve this speed?
29. A bike rider pedals with constant acceleration to reach a velocity
of 7.5 m/s over a time of 4.5 s. During the period of acceleration, the bike’s displacement is 19 m. What was the initial velocity of the bike?
Section 3.2 Motion with Constant Acceleration 69
Displacement An automobile starts at rest and speeds up at 3.5 m/s2after the traffic light turns green. How far will it have gone when it is traveling at 25 m/s?
Analyze and Sketch the Problem
• Sketch the situation.
• Establish coordinate axes.
• Draw a motion diagram.
Known: Unknown:
di0.00 m df?
vi 0.00 m/s
vf25 m/s
a a 3.5 m/s2
Solve for the Unknown
Solve for df.
vf2v
i22a(dfdi)
df divf2
2
a vi2
0.00 m Substitute di0.00 m, vf25 m/s, vi0.00 m/s
89 m
Evaluate the Answer
• Are the units correct? Position is measured in meters.
• Does the sign make sense? The positive sign agrees with both the pictorial and physical models.
• Is the magnitude realistic? The displacement is almost the length of a football field. It seems large, but 25 m/s is fast (about 55 mph); therefore, the result is reasonable.
3
(25 m/s)2(0.00 m/s)2
2(3.5 m/s2)
2 1
a
Begin
Begin End
End
x
v
Math Handbook
Order of Operations page 843
70 Chapter 3 Accelerated Motion
Two-Part Motion You are driving a car, traveling at a constant velocity of 25 m/s, when you see a child suddenly run onto the road. It takes 0.45 s for you to react and apply the brakes. As a result, the car slows with a steady acceleration of 8.5 m/s2and comes to a stop. What is the total distance that the car moves before it stops?
Analyze and Sketch the Problem
• Sketch the situation.
• Choose a coordinate system with the motion
of the car in the positive direction.
• Draw the motion diagram and label vand a.
Known: Unknown:
vreacting 25 m/s dreacting?
treacting 0.45 s dbraking?
a abraking 8.5 m/s2 d total?
vi, braking25 m/s
vf, braking0.00 m/s
Solve for the Unknown
Reacting:
Solve for the distance the car travels at a constant speed.
dreactingvreactingtreacting
dreacting(25 m/s)(0.45 s) Substitute vreacting25 m/s, treacting0.45 s
11 m Braking:
Solve for the distance the car moves while braking.
vf, braking2v
reacting22abraking(dbraking)
Solve for dbraking.
dbraking
37 m
The total distance traveled is the sum of the reaction distance and the braking distance.
Solve for dtotal.
dtotaldreactingdbraking
11 m 37 m Substitute dreacting11 m, dbraking37 m
48 m
Evaluate the Answer
• Are the units correct? Distance is measured in meters.
• Do the signs make sense? Both dreactingand dbrakingare positive, as they should be.
• Is the magnitude realistic? The braking distance is small because the magnitude of the acceleration is large.
3
Substitute vf, braking0.00 m/s,
vreacting25 m/s, abraking 8.5 m/s2 (0.00 m/s)2(25 m/s)2
2(8.5 m/s2)
vf, braking2v reacting2
2a
braking
2 1
a
Begin
Reacting Braking
Begin 0
End End
x v
Math Handbook
physicspp.com/self_check_quiz Section 3.2 Motion with Constant Acceleration 71
34.Acceleration A woman driving at a speed of 23 m/s sees a deer on the road ahead and applies the brakes when she is 210 m from the deer. If the deer does not move and the car stops right before it hits the deer, what is the acceleration provided by the car’s brakes?
35. Displacement If you were given initial and final velocities and the constant acceleration of an object, and you were asked to find the displace-ment, what equation would you use?
36.Distance An in-line skater first accelerates from 0.0 m/s to 5.0 m/s in 4.5 s, then continues at this constant speed for another 4.5 s. What is the total distance traveled by the in-line skater?
37. Final Velocity A plane travels a distance of
5.0102m while being accelerated uniformly from
rest at the rate of 5.0 m/s2. What final velocity does
it attain?
38.Final Velocity An airplane accelerated uniformly
from rest at the rate of 5.0 m/s2for 14 s. What final
velocity did it attain?
39. Distance An airplane starts from rest and
accel-erates at a constant 3.00 m/s2 for 30.0 s before
leaving the ground.
a.How far did it move?
b.How fast was the airplane going when it took off?
40. Graphs A sprinter walks up to the starting blocks at a constant speed and positions herself for the start of the race. She waits until she hears the starting pistol go off, and then accelerates rapidly until she attains a constant velocity. She maintains this velocity until she crosses the finish line, and then she slows down to a walk, taking more time to slow down than she did to speed up at the beginning of the race. Sketch a velocity-time and a position-time graph to represent her motion. Draw them one above the other on the same time scale.
Indicate on your p-t graph where the starting
blocks and finish line are.
41. Critical Thinking Describe how you could calcu-late the acceleration of an automobile. Specify the measuring instruments and the procedures that you would use.
3.2
Section Review
30. A man runs at a velocity of 4.5 m/s for 15.0 min. When going up an increasingly steep
hill, he slows down at a constant rate of 0.05 m/s2for 90.0 s and comes to a stop.
How far did he run?
31. Sekazi is learning to ride a bike without training wheels. His father pushes him with a
constant acceleration of 0.50 m/s2for 6.0 s, and then Sekazi continues at 3.0 m/s for
another 6.0 s before falling. What is Sekazi’s displacement? Solve this problem by constructing a velocity-time graph for Sekazi’s motion and computing the area underneath the graphed line.
32. You start your bicycle ride at the top of a hill. You coast down the hill at a constant
acceleration of 2.00 m/s2. When you get to the bottom of the hill, you are moving at
18.0 m/s, and you pedal to maintain that speed. If you continue at this speed for 1.00 min, how far will you have gone from the time you left the hilltop?
33. Sunee is training for an upcoming 5.0-km race. She starts out her training run by moving
at a constant pace of 4.3 m/s for 19 min. Then she accelerates at a constant rate until she crosses the finish line, 19.4 s later. What is her acceleration during the last portion of the training run?
You have learned several different tools that you can apply when solv-ing problems dealsolv-ing with motion in one dimension: motion diagrams, graphs, and equations. As you gain more experience, it will become easier to decide which tools are most appropriate in solving a given problem. In the following section, you will practice using these tools to investigate the motion of falling objects.
D
rop a sheet of paper. Crumple it, and then drop it again. Drop a rock or a pebble. How do the three motions compare with each other? Do heavier objects fall faster than lighter ones? A light, spread-out object, such as a smooth sheet of paper or a feather, does not fall in the same man-ner as something more compact, such as a pebble. Why? As an object falls, it bumps into particles in the air. For an object such as a feather, these little collisions have a greater effect than they do on pebbles or rocks. To under-stand the behavior of falling objects, first consider the simplest case: an object such as a rock, for which the air does not have an appreciable effect on its motion. The term used to describe the motion of such objects is free fall, which is the motion of a body when air resistance is negligible and the action can be considered due to gravity alone.Acceleration Due to Gravity
About 400 years ago, Galileo Galilei recognized that to make progress in the study of the motion of falling objects, the effects of the substance through which the object falls have to be ignored. At that time, Galileo had no means of taking position or velocity data for falling objects, so he rolled balls down inclined planes. By “diluting” gravity in this way, he could make careful measurements even with simple instruments.
Galileo concluded that, neglecting the effect of the air, all objects in free fall had the same acceleration. It didn’t matter what they were made of, how much they weighed, what height they were dropped from, or whether they were dropped or thrown. The acceleration of falling objects, given a special symbol, g, is equal to 9.80 m/s2. It is now known that there are small
vari-ations in gat different places on Earth, and that 9.80 m/s2is the average value.
The acceleration due to gravityis the acceleration of an object in free fall that results from the influence of Earth’s gravity. Suppose you drop a rock. After 1 s, its velocity is 9.80 m/s downward, and 1 s after that, its velocity is 19.60 m/s downward. For each second that the rock is falling, its downward velocity increases by 9.80 m/s. Note that gis a positive num-ber. When analyzing free fall, whether you treat the acceleration as positive or negative depends upon the coordinate system that you use. If your coor-dinate system defines upward to be the positive direction, then the accel-eration due to gravity is equal to g; if you decide that downward is the positive direction, then the acceleration due to gravity is g.
A strobe photo of a dropped egg is shown in Figure 3-14. The time interval between the images is 0.06 s. The displacement between each pair of images increases, so the speed is increasing. If the upward direction is chosen as positive, then the velocity is becoming more and more negative. Ball thrown upward Instead of a dropped egg, could this photo also illus-trate a ball thrown upward? If upward is chosen to be the positive direc-tion, then the ball leaves the hand with a positive velocity of, for example, 20.0 m/s. The acceleration is downward, so ais negative. That is, a g
9.80 m/s2. Because the velocity and acceleration are in opposite directions, the speed of the ball decreases, which is in agreement with the strobe photo.
3.3
Free Fall
Objectives
•Defineacceleration due to gravity.
•Solveproblems involving objects in free fall. Vocabulary
free fall
acceleration due to gravity
■Figure 3-14 An egg accelerates at 9.80 m/s2in free fall. If the
upward direction is chosen as positive, then both the velocity and the acceleration of this egg in free fall are negative.
72 Chapter 3 Accelerated Motion Richard Megna/Fundamental Photographs
Section 3.3 Free Fall 73 After 1 s, the ball’s velocity is reduced by 9.80 m/s, so it now is traveling
at 10.2 m/s. After 2 s, the velocity is 0.4 m/s, and the ball still is moving upward. What happens during the next second? The ball’s velocity is reduced by another 9.80 m/s, and is equal to 9.4 m/s. The ball now is moving downward. After 4 s, the velocity is 19.2 m/s, meaning that the ball is falling even faster. Figure 3-15ashows the velocity-time graph for the ball as it goes up and comes back down. At around 2 s, the velocity changes smoothly from positive to negative. Figure 3-15bshows a closer view of the v-tgraph around that point. At an instant of time, near 2.04 s, the ball’s velocity is zero. Look at the position-time graphs in Figure 3-15c and d,which show how the ball’s height changes. How are the ball’s posi-tion and velocity related? The ball reaches its maximum height at the instant of time when its velocity is zero.
At 2.04 s, the ball reaches its maximum height and its velocity is zero. What is the ball’s acceleration at that point? The slope of the line in the v-tgraphs in Figure 3-15a and 3-15b is constant at 9.80 m/s2.
Often, when people are asked about the acceleration of an object at the top of its flight, they do not take the time to fully analyze the situation, and respond that the acceleration at this point is zero. However, this is not the case. At the top of the flight, the ball’s velocity is 0 m/s. What would happen if its acceleration were also zero? Then the ball’s velocity would not be changing and would remain at 0 m/s. If this were the case, the ball would not gain any downward velocity and would simply hover in the air at the top of its flight. Because this is not the way objects tossed in the air behave on Earth, you know that the acceleration of an object at the top of its flight must not be zero. Further, because you know that the object will fall from that height, you know that the acceleration must be downward.
2.00 2.04 2.08
0.50 0.00 0.50
V
elocity (m/s)
Time (s)
2.00 2.04 2.08 20.39
20.40 20.41
Displacement (m)
Time (s)
0 1 2 3 4
20.0 0.00 20.0
V
elocity (m/s)
Time (s)
0 1 2 3 4
0 25
Displacement (m)
Time (s)
■Figure 3-15 In a coordinate system in which the upward direction is positive, the velocity of the thrown ball decreases until it becomes zero at 2.04 s. Then it increases in the negative direction as the ball falls (a, b).The p-t graphs show the height of the ball at corresponding time intervals (c, d).
a b
c d
74 Chapter 3 Accelerated Motion
42. A construction worker accidentally drops a brick from a high
scaffold.
a. What is the velocity of the brick after 4.0 s?
b. How far does the brick fall during this time?
43. Suppose for the previous problem you choose your coordinate
system so that the opposite direction is positive.
a. What is the brick’s velocity after 4.0 s?
b. How far does the brick fall during this time?
44. A student drops a ball from a window 3.5 m above the sidewalk.
How fast is it moving when it hits the sidewalk?
45. A tennis ball is thrown straight up with an initial speed of 22.5 m/s.
It is caught at the same distance above the ground.
a. How high does the ball rise?
b. How long does the ball remain in the air? Hint: The time it takes
the ball to rise equals the time it takes to fall.
46. You decide to flip a coin to determine whether to do your physics
or English homework first. The coin is flipped straight up.
a. If the coin reaches a high point of 0.25 m above where you
released it, what was its initial speed?
b. If you catch it at the same height as you released it, how much
time did it spend in the air?
Free-fall rides Amusement parks use the concept of free fall to design rides that give the riders the sensation of free fall. These types of rides usually consist of three parts: the ride to the top, momentary suspension, and the plunge downward. Motors provide the force needed to move the cars to the top of the ride. When the cars are in free fall, the most massive rider and the least massive rider will have the same acceleration. Suppose the free-fall ride at an amusement park starts at rest and is in free fall for 1.5 s. What would be its velocity at the end of 1.5 s? Choose a coordinate system with a positive axis upward and the origin at the initial position of the car. Because the car starts at rest, vi would be equal to 0.00 m/s. To calculate the final velocity, use the equation for velocity with constant acceleration.
vfviatf
0.00 m/s (9.80 m/s2)(1.5 s)
15 m/s
How far does the car fall? Use the equation for displacement when time and constant acceleration are known.
dfdivitf1 2atf2
0.00 m (0.00 m/s)(1.5 s) 1
2(9.80 m/s
2)(1.5 s)2
Section 3.3 Free Fall 75
47. Maximum Height and Flight Time Acceleration due to gravity on Mars is about one-third that on Earth. Suppose you throw a ball upward with the same velocity on Mars as on Earth.
a.How would the ball’s maximum height compare
to that on Earth?
b.How would its flight time compare?
48.Velocity and Acceleration Suppose you throw a ball straight up into the air. Describe the changes in the velocity of the ball. Describe the changes in the acceleration of the ball.
49.Final Velocity Your sister drops your house keys down to you from the second floor window. If you catch them 4.3 m from where your sister dropped them, what is the velocity of the keys when you catch them?
50. Initial Velocity A student trying out for the foot-ball team kicks the footfoot-ball straight up in the air. The ball hits him on the way back down. If it took 3.0 s from the time when the student punted the ball until he gets hit by the ball, what was the foot-ball’s initial velocity?
51. Maximum Height When the student in the previ-ous problem kicked the football, approximately how high did the football travel?
52. Critical Thinking When a ball is thrown verti-cally upward, it continues upward until it reaches a certain position, and then it falls downward. At that highest point, its velocity is instantaneously zero. Is the ball accelerating at the highest point? Devise an experiment to prove or disprove your answer.
3.3
Section Review
physicspp.com/self_check_quiz
You notice a water balloon fall past your classroom window. You
estimate that it took the balloon about tseconds to fall the length of
the window and that the window is about ymeters high. Suppose the
balloon started from rest. Approximately how high above the top of the
window was it released? Your answer should be in terms of t, y, g, and
numerical constants.
Remember to define the positive direction when establishing your coordi-nate system. As motion problems increase in complexity, it becomes increasingly important to keep all the signs consistent. This means that any displacement, velocity, or acceleration that is in the same direction as the one chosen to be positive will be positive. Thus, any displacement, veloc-ity, or acceleration that is in the direction opposite to the one chosen to be positive should be indicated with a negative sign. Sometimes it might be appropriate to choose upward as positive. At other times, it might be easier to choose downward as positive. You can choose either direction you want, as long as you stay consistent with that convention throughout the solution of that particular problem. Suppose you solve one of the practice problems on the preceding page again, choosing the direction opposite to the one you previously designated as the positive direction for the coordi-nate system. You should arrive at the same answer, provided that you assigned signs to each of the quantities that were consistent with the coor-dinate system. It is important to be consistent with the coorcoor-dinate system to avoid getting the signs mixed up.
76
Acceleration Due to Gravity
Small variations in the acceleration due to gravity, g, occur at different places on Earth. This is because gvaries with distance from the center of Earth and is influenced by the subsurface geology. In addition, gvaries with latitude due to Earth’s rotation.
For motion with constant acceleration, the displacement is dfdivi(tfti) 12a(tfti)2. If d
i0 and ti0, then the displacement is dfvitf
1 2atf2.
Dividing both sides of the equation by tfyields the following:df/tfvi12atf. The slope of a graph of df/tfversus tf, is equal to 12a. The initial velocity, vi, is determined by the y-intercept. In this activity, you will be using a spark timer to collect free-fall data and use it to determine the acceleration due to gravity, g.
■Measurefree-fall data.
■Make and use graphsof velocity versus time. ■Compare and contrastvalues of gfor different
locations.
■Keep clear of falling masses.
spark timer timer tape 1-kg mass C-clamp
stack of newspapers masking tape
1. Attach the spark timer to the edge of the lab
table with the C-clamp.
2. If the timer needs to be calibrated, follow your
teacher’s instructions or those provided with the timer. Determine the period of the timer and record it in your data table.
3. Place the stack of newspapers on the floor,
directly below the timer so that the mass, when released, will not damage the floor.
4. Cut a piece of timer tape approximately 70 cm
in length and slide it into the spark timer.
5. Attach the timer tape to the 1-kg mass with a
small piece of masking tape. Hold the mass next to the spark timer, over the edge of the table so that it is above the newspaper stack.
6. Turn on the spark timer and release
the mass.
7. Inspect the timer tape to make sure that there
are dots marked on it and that there are no gaps in the dot sequence. If your timer tape is defective, repeat steps 4–6 with another piece of timer tape.
8. Have each member of your group perform the
experiment and collect his or her own data.
9. Choose a dot near the beginning of the timer
tape, a few centimeters from the point where
the timer began to record dots, and label it 0.
Label the dots after that 1, 2, 3, 4, 5,etc. until
you get near the end where the mass is no longer in free fall. If the dots stop, or the distance between them begins to get smaller, the mass is no longer in free fall.
Procedure
Materials
Safety Precautions Objectives
QUESTION
How does the value of gvary from place to place?
Alternate CBL instructions can be found on the Web site.
physicspp.com
Horizons Companies
Communicatethe average value of gto
others. Go to physicspp.com/internet_lab
and post the name of your school, city, state, elevation above sea level, and average
value of gfor your class. Obtain a map for
your state and a map of the United States. Using the data posted on the Web site by
other students, mark the values for gat the
appropriate locations on the maps. Do you notice any variation in the acceleration due to gravity for different locations, regions and elevations?
77
10. Measure the total distance to each numbered
dot from the zero dot, to the nearest millimeter and record it in your data table. Using the timer period, record the total time associated with each distance measurement and record it in your data table.
1. Use Numbers Calculate the values for speed and record them in the data table.
2. Make and Use Graphs Draw a graph of speed versus time. Draw the best-fit straight line for your data.
3. Calculate the slope of the line. Convert your
result to m/s2.
1. Recall that the slope is equal to 12a. What is the
acceleration due to gravity?
2. Find the relative error for your experimental
value of gby comparing it to the accepted
value.
Relative error
100
3. What was the mass’s velocity, vi, when you
began measuring distance and time?
What is the advantage of measuring several centimeters away from the beginning of the timer tape rather than from the very first dot?
Why do designers of free-fall amusement-park rides design exit tracks that gradually curve toward the ground? Why is there a stretch of straight track?
Real-World Physics
Going Further
Accepted valueExperimental value
Accepted value
Conclude and Apply Analyze
To find out more about accelerated motion, visit the Web site: physicspp.com
Data Table
Time period (#/s)Interval Distance (cm) Time (s) Speed (cm/s)
1
2
3
4
5
6
7
8
78 Extreme Physics
Time Dilation
at High Velocities
Can time pass
differently in two ref-erence frames? How can one of a pair of twins age more than the other?Light Clock
Consider the following thought experiment using a light clock. A light clock is a vertical tube with a mirror at each end. A short pulse of light is introduced at one end and allowed to bounce back and forth within the tube. Time is measured by counting the num-ber of bounces made by the pulse of light. The clock will be accurate because the speed of a pulse of light is always c, which is 3108m/s, regardless of thevelocity of the light source or the observer. Suppose this light clock is placed in a very fast spacecraft. When the spacecraft goes at slow speeds, the light beam bounces vertically in the tube. If the spacecraft is moving fast, the light beam still bounces vertically—at least as seen by the observer in the spacecraft.
A stationary observer on Earth, however, sees the pulse of light move diagonally because of the movement of the spacecraft. Thus, to the stationary observer, the light beam moves a greater distance. Distancevelocity time, so if the distance traveled by the light beam increases, the product (velocitytime) also must increase.
Because the speed of the light pulse, c, is the same for any observer, time must be increasing for the stationary observer. That is, the station-ary observer sees the moving clock ticking slower than the same clock on Earth.
Suppose the time per tick seen by the station-ary observer on Earth is ts, the time seen by the observer on the spacecraft is to, the length of the light clock is cto, the velocity of the space-craft is v, and the speed of light is c. For every tick, the spacecraft moves vtsand the light pulse moves cto. This leads to the following equation:
ts
To the stationary observer, the closer vis to
c,the slower the clock ticks. To the observer on the spacecraft, however, the clock keeps perfect time.
Time Dilation
This phenomenon is called time dilation and it applies to every process associated with time aboard the spacecraft. For example, biological aging will proceed more slowly in the spacecraft than on Earth. So if the observer on the spacecraft is one of a pair of twins, he or she would age more slowly than the other twin on Earth. This is called the twin paradox. Time dilation has resulted in a lot of speculation about space travel. If spacecraft were able to travel at speeds close to the speed of light, trips to distant stars would take only a few years for the astronaut.to
1vc2 21. Calculate Find the time dilation ts/to
for Earth’s orbit about the Sun if
vEarth10,889 km/s.
2. Calculate Derive the equation for ts
above.
3. Discuss How is time dilation similar to or different from time travel?
Going Further
Observer on Earth
D D
Observer inside the spacecraft
Light clock
Mirror Mirror Mirror Mirror
t0
3.1 Acceleration
Vocabulary
• velocity-time graph (p. 58)
• acceleration (p.59)
• average acceleration
(p. 59)
• instantaneous acceleration (p. 59)
3.2 Motion with Constant Acceleration
3.3 Free Fall
Vocabulary • free fall (p. 72)
• acceleration due to gravity (p. 72)
Key Concepts
•
A velocity-time graph can be used to find the velocity and acceleration of an object.•
The average acceleration of an object is the slope of its velocity-time graph.•
Average acceleration vectors on a motion diagram indicate the size and direction of the average acceleration during a time interval.•
When the acceleration and velocity are in the same direction, the object speeds up; when they are in opposite directions, the object slows down.•
Velocity-time graphs and motion diagrams can be used to determine the signof an object’s acceleration.
a
vt v
t f
f
v ti i
Key Concepts
•
If an object’s average acceleration during a time interval is known, the change in velocity during that time can be found.•
The area under an object’s velocity-time graph is its displacement.•
In motion with constant acceleration, there are relationships among theposition, velocity, acceleration, and time.
•
The velocity of an object with constant acceleration can be found using the following equation.vf2vi22a(dfdi)
dfdivitf12atf2
vfviat
Key Concepts
•
The acceleration due to gravity on Earth, g, is 9.80 m/s2downward. Thesign associated with gin equations depends upon the choice of the coordinate system.
•
Equations for motion with constant acceleration can be used to solve problems involving objects in free fall.79
physicspp.com/vocabulary_puzzlemaker