UDK 629.11.011.5 /.7:629.1—453:519.61/.64
Problematika overitve nosilnosti karoserije avtobusa pri prevrnitvenem testu
Problems of Bus Body Strength Verification During ECE 66 Roll Over Test
BOJAN MURŠIČ-ROBERT KUNC-MATJAŽ JENKO-MATIJA FAJDIGA - TOMAŽ JUREJEVČIČ
Premis ECE 66 določa za odobritev velikih potniških vozil tri metode praktičnega pre izkušanja trdnosti karoserije in eno alternativno, ki jo odobri strokovnjak s tega področja. Ker so eksperimentalne metode preizkušanja drage, ima četrta metoda veliko prednost. V prispevku so predstavljeni modeliranje in rezultati numeričnega preračuna detajla karoserije avtobusa. Prikazano je praktično preizkušanje enakega detajla. V sklepu so zapisane ugotovitve o natančnosti numeričnega izračuna ob primerjavi z rezultati preizkušanja.
The ECE Regulation No. 66 prescribes three test methods for the verification of strength of superstructure, and one additional method approved by the competent expert. Because of the high costs of the testing included in the first three methods, the fourth method has a great advantage. Modelling of the part of the superstructure and the results provided by calculation are presented in the paper. Planning of the testing bench for testing the same part of the superstructure and the results obtained by the testing are shown. In the conclusion, the findings about the accuracy of the calculation in comparison with the test results are presented.
0 UVOD
Po predpisu Evropske komisije ECE 66, ki določa enotne pogoje za odobritev velikih potniških vozil glede na trdnost karoserije, naj bi bila vsaka vrsta vozila preverjena z eno od naslednjih me tod:
— preizkus s prevrnitvijo celotnega vozila, — preizkus s prevrnitvijo dela vozila ali enega od delov celotnega vozila,
— preverjanje trdnosti karoserije z izračunom v skladu z dodatkom predpisa in
— alternativna metoda, ki jo odobri strokov njak s tega področja.
Preverjanje s praktičnim prevračanjem je predvsem za manjše izdelovalce avtobusov drago, kar daje prednost četrti izmed navedenih metod, torej preverjanju z računsko metodo. Za izvedbo te naloge je na tržišču na voljo veliko računalni ških programskih paketov, ki temeljijo na metodi končnih elementov.
Kakovost rezultatov računalniških simuliranj je različna (seveda je odvisna tudi in predvsem od modela, ki ga sestavi uporabnik sam), zato jih je treba preveriti z rezultati praktičnih preizkušanj togosti detajlov karoserije.
1 RAČUNSKA METODA
Najprej je bil s programskim paketom ANSYS izdelan računalniški model ravninskega okvira karoserije avtobusa.
0 GENERAL OVERVIEW
Each type of vehicle should be checked against ECE Regulation No. 66, which determines unified conditions to be met for production of large passenger vehicles regarding strength of body and/or chassis. This check can be done by one of the following set of methods:
— roll-over test of the full representative of a vehicle
— roll-over test of the part of a vehicle — check of the body strength w ith a calcula tion in accordance w ith ECE Reg. No.66.
— check against the alternative method approved by an expert.
Checking against real roll-over is expensive especially for smaller companies, thus an advanta ge is given to the fourth of the specified methods, i.e. the alternative method. The task can be done with the aid of several methods (for example FEM), which are implemented in a lot of software that is nowadays available on the market.
The quality of such computer simulation results is variable (depending primarily on the quality of the model built by a user), therefore results should be checked against the set of experimental tests measuring the stiffness of body details.
1 NUMERICAL APPROACH
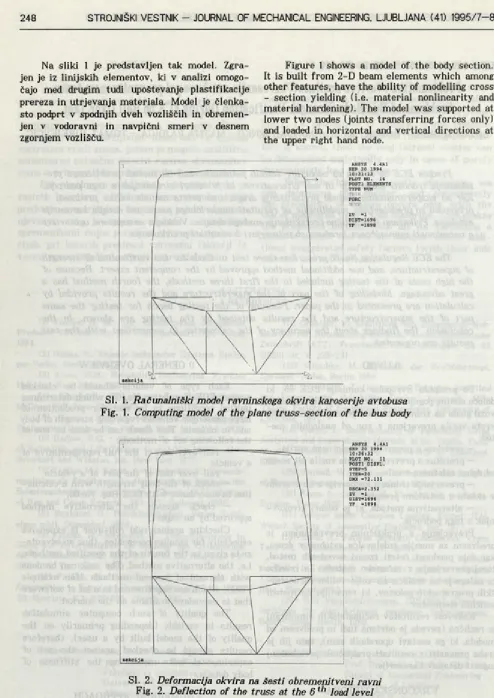
Na sliki 1 je predstavljen tak model. Zgra jen je iz linijskih elementov, ki v analizi omogo čajo med drugim tudi upoštevanje plastifikacije prereza in utrjevanja materiala. Model je členka- sto podprt v spodnjih dveh vozliščih in obremen jen v vodoravni in navpični smeri v desnem zgornjem vozlišču.
Figure 1 shows a model of the body section. It is built from 2-D beam elements which among other features, have the ability of modelling cross - section yielding (i.e. material nonlinearity and material hardening). The model was supported at lower two nodes (joints transferring forces only) and loaded in horizontal and vertical directions at the upper right hand node.
Sl. 1. Računalniški model ravninskega okvira karoserije avtobusa
Fig. 1. Computing model of the plane truss-section of the bus body
A N S Y S 4 . 4A1 S E P 20 1994 10:26:32 P L OT NO. 11 POSTI DISPL. STEP=5 ITER=20 D M X = 7 2. 13 1 D S C A = 2 .352 ZV =1 DI S T = 1 6 9 6 Y F = 1 89 8
SI. 2. Deformacija okvira na šesti obremenitveni ravni
Fig. 2. Deflection of the truss at the 6 th load level
s e k c i j a
A N S Y S 4.4A1 SEP 20 1994 1 0 :1 9: 10 P L O T NO. 18 P O S T I L I N E S T RE SS S T EP =6
IT ER =2 0 MZ I M Z J MA X = 0 . 142E+07 EL E M = 1
‘ ? i
Z V *1 D I S T = 1 6 9 6 Y F = 1 89 8
- 0 . 17 6E+07 - 0 . 14 1E +0 7 - 0 . 10 6E +0 7 - 7 0 3 7 8 9 -3 50 62 6 2537 35 5 7 0 1 70 8 8 6 4 0 . 10 6E +0 7 0 . 14 2E +0 7
Sl. 3. Potek upogibnih momentov na šesti obremenitveni ravni
Fig. 3. Bending moment allocation at 6 th load level
Sl. 4. Potek napetosti na šesti obremnitveni ravni
Fig. 4. Bending stress allocation at 6 thload level
Rezultati kažejo, da se deformira v bistvu le nadgradnja avtobusa, šasija pa je dovolj toga, da ne utrpi večjih deformacij. Zaradi tega se pojavljajo kritična mesta na spoju šasije in nadgradnje ter na spoju stranske stene in strehe, kjer se nape tosti zvišajo na 296 MPa. Ker je meja plastičnosti za uporabljeni material pri 290 MPa, to pomeni, da je del okvira na tem mestu v plastičnem področju.
Po teh rezultatih smo se odločili, da se bo praktično preizkusil detajl okvira, katerega ra čunalniški model je predstavljen na naslednji sliki (sl. 5).
The results show that in essence only the su perstructure part of the bus body deforms, the chassis on the other hand remains sufficiently stiff so that it does not suffer deformation. A conse quence is the occurrence of critical details at the region of the chassis — superstructure connection and at the superstructure’ s lateral wall and the roof, where maximum stress is 296 MPa. Because the yield stress is 290 MPa for the material used it can be concluded that the truss region in the vicinity of the specified connections yields.
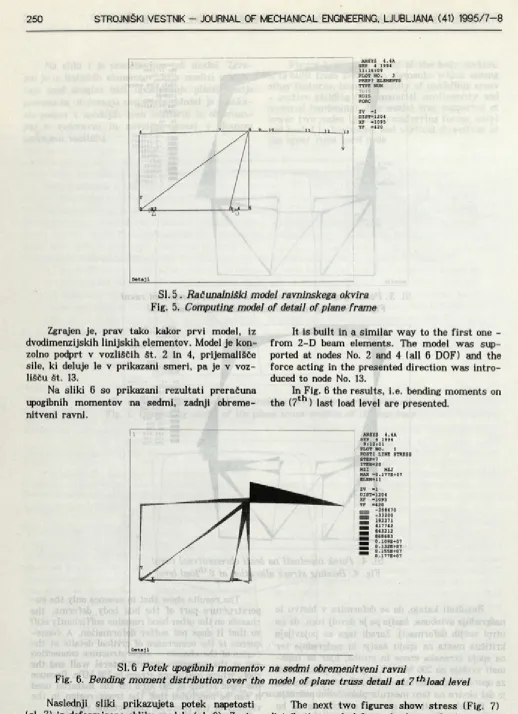
A N S Y S 4. 4 A SEP 4 1994 11 :1 6: 09 P L O T N O . 3 PR EP 7 E L E M E N T S T Y P E N U M TOTS RDIS FORC ZV =1 DI ST - 1 2 0 4 X F -1 09 5 Y F -420
SI. 5 . Računalniški model ravninskega okvira
Fig. 5. Computing model of detail of plane frame
Zgrajen je, prav tako kakor prvi model, iz dvodimenzijskih linijskih elementov. Model je kon- zolno podprt v vozliščih št. 2 in 4, prijemališče sile, ki deluje le v prikazani smeri, pa je v voz lišču št. 13.
Na sliki 6 so prikazani rezultati preračuna upogibnih momentov na sedmi, zadnji obreme nitveni ravni.
It is built in a similar way to the first one - from 2-D beam elements. The model was sup ported at nodes No. 2 and 4 (all 6 DOF) and the force acting in the presented direction was intro duced to node No. 13.
In Fig. 6 the results, i.e. bending moments on the (7t n ) last load level are presented.
A N S Y S 4 . 4A S E P 6 1994
9:12:01 P L O T N O . 1 POSTI LI N E ST RE SS ST EP=7
IT ER -2 0 MZI MZJ MA X = 0 . 177E+07 EL EM -1 1 ZV -1 D I ST -1 20 4 X F -1 09 5 Y F -420 rr~n -2 58 67 0
-3 32 00 M H 192271 “ 41 77 42 2 643212 " 86 8683 J 0.10 9E +0 7 2 0 . 132E+07 J 0 . 155E+07 0 . 177E+07
SI. 6 Potek upogibnih momentov na sedmi obremenitveni ravni
Fig. 6. Bending moment distribution over the model of plane truss detail at 7 th load level
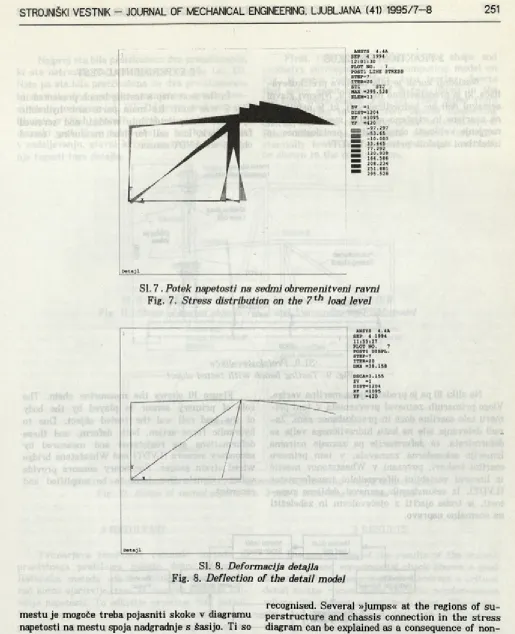
Naslednji sliki prikazujeta potek napetosti (sl. 7) in deformirano obliko modela (sl. 8). Zani mivejša je vsekakor slika 7, na kateri je moč opa ziti plastično območje dela detajla okvira. Na tem
A N S Y S 4 . 4A S E P 4 1994 1 2 :0 1: 30 P L O T N O . 7 P O S T I L I N E S T R E S S ST EP =7
I T ER -2 0 ST I S T J M A X = 2 9 5 . 5 2 8 E L E M = 13 Z V =1 D I S T = 1 2 0 4 X F = 1 09 5 Y F *4 20
™ -97.297
5 = - 1 0. 00 3 “ 3 3 .6 45
7 7 . 2 9 2 " 12 0. 93 9
Z 16 4. 58 6 " 2 0 8. 23 4 “ 2 5 1. 88 1 2 9 5 . 5 2 8
SI. 7. Potek napetosti na sedmi obremenitveni ravni
Fig. 7. Stress distribution on the 7 th load level
De t a j l
A N S Y S 4 . 4A S E P 4 1994 11:5 5: 27 P L O T N O . 7 P O S T I DlSPL. ST EP =7 I T ER -2 0 D M X = 3 8 . 1 5 8 D S C A = 3 .155 Z V =1 D I S T — 1204 X F = 1 0 9 5 Y F = 4 20
SI. 8. Deformacija detajla
Fig. 8. Deflection of the detail model
mestu je mogoče treba pojasniti skoke v diagramu napetosti na mestu spoja nadgradnje s šasijo. Ti so posledica kotne ojačitve z vzdolžno spreminjajočim se prerezom.
Ker uporabljeni programski paket ne omogoča modeliranja z linijskimi elementi, katerim bi se v vzdolžni smeri prerez spreminjal, je bila kotna ojačitev nadomeščena z dvema elementoma z večjima prerezoma. Tako je kljub večjemu upo- gibnemu momentu napetost manjša zaradi večjega prereza.
recognised. Several »jumps« at the regions of su perstructure and chassis connection in the stress diagram can be explained as a consequence of non- uniform geometry at that region, they are the con sequence of cantilever shaped joint reinforcement.
2 PRAKTIČNI PREIZKUS
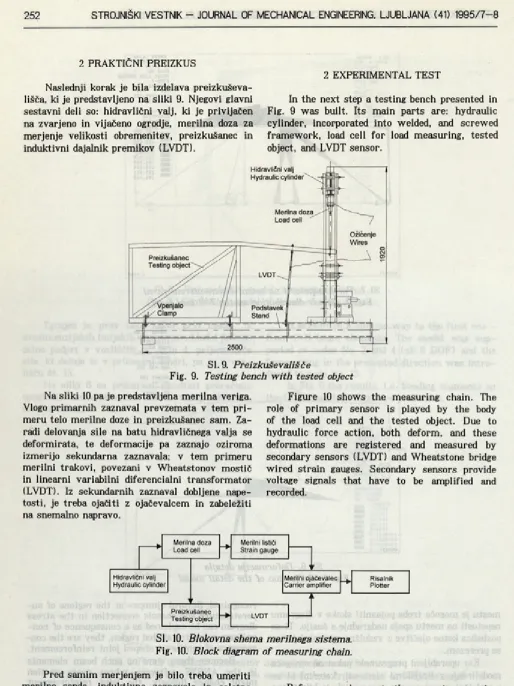
Naslednji korak je bila izdelava preizkuševa- lišča, ki je predstavljeno na sliki 9. Njegovi glavni sestavni deli so: hidravlični valj, ki je privijačen na zvarjeno in vijačeno ogrodje, merilna doza za merjenje velikosti obremenitev, preizkusanec in induktivni dajalnik premikov (LVDT).
2 EXPERIMENTAL TEST
In the next step a testing bench presented in Fig. 9 was built. Its main parts are: hydraulic cylinder, incorporated into welded, and screwed framework, load cell for load measuring, tested object, and LVDT sensor.
Na sliki 10 pa je predstavljena merilna veriga. Vlogo primarnih zaznaval prevzemata v tem pri meru telo merilne doze in preizkuSanec sam. Za radi delovanja sile na batu hidravličnega valja se deformirata, te deformacije pa zaznajo oziroma izmerijo sekundarna zaznavala; v tem primeru merilni trakovi, povezani v Wheatstonov mostič in linearni variabilni diferencialni transformator (LVDT). Iz sekundarnih zaznaval dobljene nape tosti, je treba ojačiti z ojačevalcem in zabeležiti na snemalno napravo.
Figure 10 shows the measuring chain. The role of primary sensor is played by the body of the load cell and the tested object. Due to hydraulic force action, both deform, and these deformations are registered and measured by secondary sensors (LVDT) and Wheatstone bridge wired strain gauges. Secondary sensors provide voltage signals that have to be amplified and recorded.
SI. 10. Blokovna shema merilnega sistema.
Fig. 10. Block diagram of measuring chain.
Pred samim merjenjem je bilo treba umeriti merilno sondo, induktivno zaznavalo in celotno merilno verigo. Obremenjevanje preizkušancev je bilo izvedeno s hidravličnim agregatom in va ljem do največjega giba bata hidravličnega va lja.
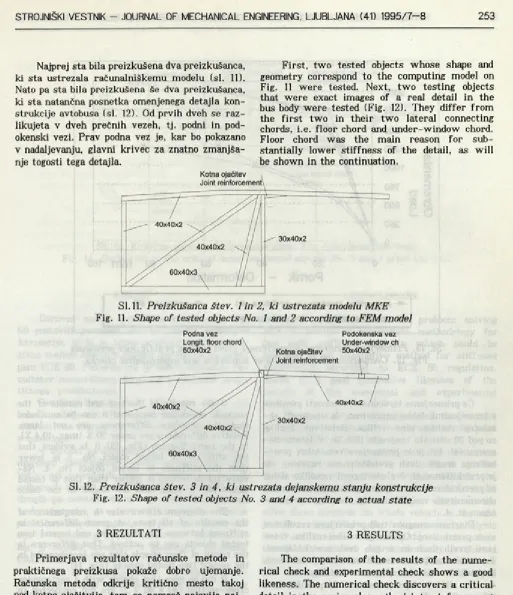
Najprej sta bila preizkušena dva preizkušanca, ki sta ustrezala računalniškemu modelu (sl. 11). Nato pa sta bila preizkušena še dva preizkušanca, ki sta natančna posnetka omenjenega detajla kon strukcije avtobusa (sl. 12). Od prvih dveh se raz likujeta v dveh prečnih vezeh, tj. podni in pod- okenski vezi. Prav podna vez je, kar bo pokazano v nadaljevanju, glavni krivec za znatno zmanjša nje togosti tega detajla.
First, two tested objects whose shape and geometry correspond to the computing model on Fig. 11 were tested. Next, two testing objects that were exact images of a real detail in the bus body were tested (Fig. 12). They differ from the first two in their two lateral connecting chords, i.e. floor chord and under-window chord. Floor chord was the main reason for sub stantially lower stiffness of the detail, as will be shown in the continuation.
SI. 11. Preizkušanca štev. 1 in 2, k i ustrezata modelu MKE
Fig. 11. Shape of tested objects No. 1 and 2 according to FEM model
Podna vez Podokenska vez
Sl. 12. Preizkušanca štev. 3 in 4, ki ustrezata dejanskemu stanju konstrukcije
Fig. 12. Shape of tested objects No. 3 and 4 according to actual state
3 REZULTATI
Primerjava rezultatov računske metode in praktičnega preizkusa pokaže dobro ujemanje. Računska metoda odkrije kritično mesto takoj nad kotno ojačitvijo, tam se namreč pojavijo naj večje napetosti. To odkritje preizkus tudi potrdi. Na tem mestu se zaradi tlačnih napetosti spodnja pasnica »naguba«, prav tako tudi stojini profilne cevi.
Iterativni numerični izračun je bil končan na sedmi obremenitveni ravni, ker je pomik ele menta št. 13 presegel določeno mejo. Na opazova nem detajlu, ki je bil plastificiran, je bila tedaj zunanja obremenitev med 1750 N in 2000 N. Praktična preizkusa pa sta pokazala, da oba pre izkušanca to obremenitev še zdržita, tako da kri terij priporočila ECE 66 ni bil ogrožen.
3 RESULTS
The comparison of the results of the nume rical check and experimental check shows a good likeness. The numerical check discovers a critical detail in the region above the joint reinforcement where the highest stress took place. The expe rimental check confirms this. At that region the top face and the side walls of the con nected vertical chord 40 x 40 x 2 suffer local buckling.
Pomik - Deformation
m numerični Izračun preizkus #1 preizkus # 2
preizkus # 3 preizkus # 4
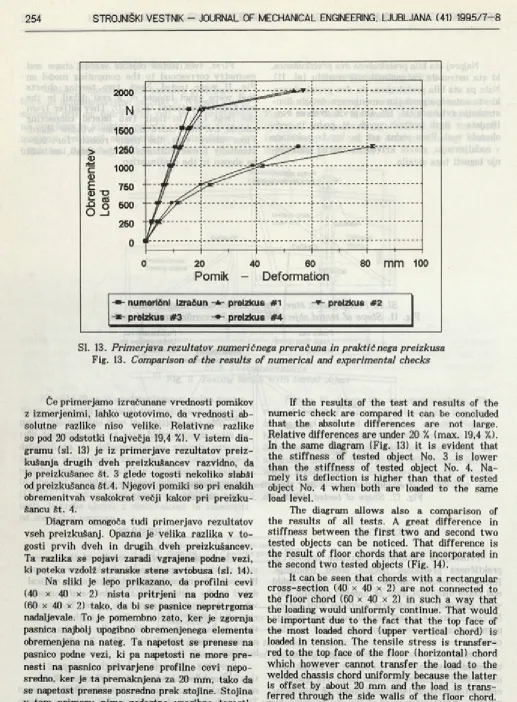
Sl. 13. Primerjava rezultatov numeričnega preračuna in praktičnega preizkusa
Fig. 13. Comparison of the results of numerical and experimental checks
Če primerjamo izračunane vrednosti pomikov z izmerjenimi, lahko ugotovimo, da vrednosti ab solutne razlike niso velike. Relativne razlike so pod 20 odstotki (največja 19,4 %). V istem dia gramu (sl. 13) je iz primerjave rezultatov preiz kušanja drugih dveh preizkušancev razvidno, da je preizkušanec št. 3 glede togosti nekoliko slabši od preizkušanca št. 4. Njegovi pomiki so pri enakih obremenitvah vsakokrat večji kakor pri preizku- šancu št. 4.
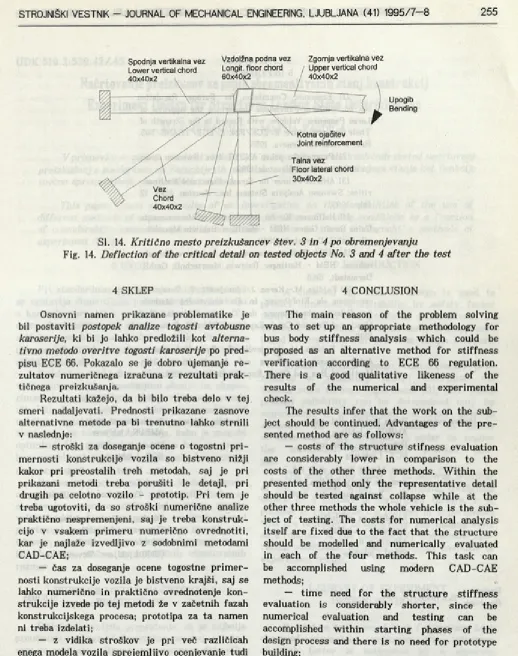
Diagram omogoča tudi primerjavo rezultatov vseh preizkušanj. Opazna je velika razlika v to gosti prvih dveh in drugih dveh preizkušancev. Ta razlika se pojavi zaradi vgrajene podne vezi, ki poteka vzdolž stranske stene avtobusa (sl. 14).
Na sliki je lepo prikazano, da profilili cevi (40 X 40 X 2) nista pritrjeni na podno vez (60 X 40 X 2) tako, da bi se pasnice nepretrgoma nadaljevale. To je pomembno zato, ker je zgornja pasnica najbolj upogibno obremenjenega elementa obremenjena na nateg. Ta napetost se prenese na pasnico podne vezi, ki pa napetosti ne more pre nesti na pasnico privarjene profilne cevi nepo sredno, ker je ta premaknjena za 20 mm, tako da se napetost prenese posredno prek stojine. Stojina v tem primeru nima zadostne upogibne togosti, zato se podna vez deformira, zaradi česar so de formacije upogibno najbolj obremenjenega elementa še večje.
If the results of the test and results of the numeric check are compared it can be concluded that the absolute differences are not large. Relative differences are under 20 % (max. 19,4 %). In the same diagram (Fig. 13) it is evident that the stiffness of tested object No. 3 is lower than the stiffness of tested object No. 4. Na mely its deflection is higher than that of tested object No. 4 when both are loaded to the same load level.
The diagram allows also a comparison of the results of all tests. A great difference in stiffness between the first two and second two tested objects can be noticed. That difference is the result of floor chords that Eire incorporated in the second two tested objects (Fig. 14).
Spodnja vertikalna vez Lower vertical chord 40x40x2
Vzdolžna podna vez Zgornja vertikalna vez Upper vertical chord 40x40x2
Kotna ojačitev Joint reinforcement
Talna vez Floor lateral chord 30x40x2
Upogib Bending
Sl. 14. Kritično mesto preizkušancev štev. 3 in 4 po obremenjevanju
Fig. 14. Deflection of the critical detail on tested objects No. 3 and 4 after the test
4 SKLEP 4 CONCLUSION
Osnovni namen prikazane problematike je bil postaviti postopek analize togosti avtobusne
karoserije, ki bi jo lahko predložili kot alterna
tivno metodo overitve togosti karoserije po pred
pisu ECE 66. Pokazalo se je dobro ujemanje re zultatov numeričnega izračuna z rezultati prak tičnega preizkušanja.
Rezultati kažejo, da bi bilo treba delo v tej smeri nadaljevati. Prednosti prikazane zasnove alternativne metode pa bi trenutno lahko strnili v naslednje:
— stroški za doseganje ocene o togostni pri mernosti konstrukcije vozila so bistveno nižji kakor pri preostalih treh metodah, saj je pri prikazani metodi treba porušiti le detajl, pri drugih pa celotno vozilo - prototip. Pri tem je treba ugotoviti, da so stroški numerične analize praktično nespremenjeni, saj je treba konstruk cijo v vsakem primeru numerično ovrednotiti, kar je najlaže izvedljivo z sodobnimi metodami CAD-CAE;
— čas za doseganje ocene togostne primer nosti konstrukcije vozila je bistveno krajši, saj se lahko numerično in praktično ovrednotenje kon strukcije izvede po tej metodi že v začetnih fazah konstrukcijskega procesa; prototipa za ta namen ni treba izdelati;
— z vidika stroškov je pri več različicah enega modela vozila sprejemljivo ocenjevanje tudi za vsako različico posebej;
— prakti&ii del ocenjevanja se lahko izvaja tudi med samim proizvodnim procesom kot kon trolni postopek za ugotavljanje in vzdrževanje kakovosti proizvodnje, oziroma preverjanje kako vosti materiala na vhodni točki v proizvodni pro ces.
The main reason of the problem solving was to set up an appropriate methodology for bus body stiffness analysis which could be proposed as an alternative method for stiffness verification according to ECE 66 regulation. There is a good qualitative likeness of the results of the numerical and experimental check.
The results infer that the work on the sub ject should be continued. Advantages of the pre sented method are as follows:
— costs of the structure stifness evaluation are considerably lower in comparison to the costs of the other three methods. Within the presented method only the representative detail should be tested against collapse while at the other three methods the whole vehicle is the sub ject of testing. The costs for numerical analysis itself are fixed due to the fact that the structure should be modelled and numerically evaluated in each of the four methods. This task can be accomplished using modern CAD-CAE methods;
— time need for the structure stiffness evaluation is considerably shorter, since the numerical evaluation and testing can be accomplished within starting phases of the design process and there is no need for prototype building;
— stiffness evaluation of the particular option of the same type of product can be done without considerable raise in cost;
5 LITERATURA 5 REFERENCES
111 Economic Commision for Europe: Regulation No. 66: Uniform Provisions Concerning the Approval of Large Passenger Vehicles with Regard to the Strength of Their Superstructure: E/E C E /324, E/EC E/TR A N S/505, Rev. 1/Add. 65, Geneva, 1985.
121 Programski paket ANSYS 4.4a: Swanson Ana lysis Sistems Inc., Houston, 1989.
131 ANSYS Prim er for Stress: Structural Nonlinea rities: Swanson Analysis Sistems Inc., Houston, USA, 12 July, 1989.
141 Hoffmann, K.: An Introduction to Measurements Using Strain Gages. HBM - Hottinger Baldwin Messtech nik GmbH, Darmstadt, 1989.
151 HBM: Bedienungsanweisung: Induktive Wegauf nehmer. HBM - Hottinger Baldwin Messtechnik GmbH, Darmstadt, 1989.
161 Fajdiga, M.- Kerne, J ,- Jurejevčič, T.: Versuchs resultaten als Einführung in die analytische Methode der Belastungsbestimmung des Omnibus-Chassis, 21 st Meeting of Bus and Coach Experts, S 304-312, Budapest.
171 Fajdiga, M ,-Jurejevčič, T.: Optimierung eines Autobusschassis in Bezug auf Zuverlässigkeit. 24th Meeting of Bus and Coach Experts, Budapest, 1993. 1990.
Naslov avtorjev: Bojan Muršič, dipl. inž. Authors’ Addresses: Bojan Muršič, Dipl. ing., AMBUS, Ljubljana
Robert Kunc, dipl. inž. SCT, Ljubljana
mag. Matjaž Jenko, dipl. inž. prof. dr. Matija Fajdiga, dipl. inž. mag. Tomaž Jurejevčič, dipl. inž. vsi
Fakulteta za strojništvo Univerze v Ljubljani Aškerčeva 6
61000 Ljubljana
Faculty od Mechanical Engineering University of Ljubljana
Aškerčeva 6
61000 Ljubljana, Slovenia AMBUS,Ljubljana Robert Kunc, Dipl. Ing., SCT, Ljubljana