journal homepage: http://civiljournal.semnan.ac.ir/
Comparative Review of the Performance Based
Design of Building Structures Using Static
Non-Linear Analysis, Part A: Steel Braced Frames
R. C. Barros
1, M. T. Braz-César
2, H. Naderpour
3*and S.M. Khatami
41. Associate Professor, Faculty of Engineering, University of Porto (FEUP), Porto, Portugal. 2. Ph.D. Student, Faculty of Engineering, University of Porto (FEUP), Porto, Portugal. 3. Assistant Professor, Faculty of Civil Engineering, Semnan University, Semnan, Iran. 4. Ph.D. Student, Faculty of Civil Engineering, Semnan University, Semnan, Iran.
* Corresponding author: [email protected]
ARTICLE INFO ABSTRACT
Article history:
Received: 14 October 2013
Accepted: 24 November 2013 The objective of this review to be submitted in two independent parts, for steel frames and for RC frames, is to
compare their structural performance with respect to the proposed N2-method, and so also of the consequent convenience of using pushover methodology for the seismic analysis of these structures. A preliminary investigation is presented on a pushover analysis used for the seismic performance of metallic braced frames equipped with diagonal X-bracing and K-bracing systems. Three steel frames are analysed corresponding to 3, 6 and 10 floor regular buildings that were modelled in the MIDAS/Civil finite element software. To obtain the pushover curve a non-linear static methodology is used. For the RC frames three commercial programs (SAP 2000, SeismoStruck and MIDAS/Civil) are used in order to perform a parametric study based on pushover analyses. The equivalent strut method is applied to simulate the influence of the masonry infill panels; to evaluate the influence of these on the capacity curves, several strut width values are considered. The parametric study also addresses the influence of other parameters on the structural behaviour and non-linear capacity curves of the RC frame, namely: length and position of the plastic hinges and different loading patterns (uniform, modal and triangular distributions).
Keywords:
Performance based design Static non-linear analysis, Pushover
Bracing system Dynamic analysis
1. Introduction
In the design of structures under seismic actions, several methodologies can be used to describe the structural seismic response. The recent role of performance based design led to
behaviour, namely through material and/or geometric non-linearity, is included in the methodology.
Pushover analysis is a static nonlinear procedure in which the magnitude of the structural loading is incrementally increased in accordance with a certain predefined pattern. With the increase in the magnitude of the loading, weak links and failure modes of the structure are found. The loading is considered monotonic, the effects of the cyclic behaviour and load reversals are being estimated by using a modified monotonic force-deformation criteria and damping approximations are used. In other words: local nonlinear effects, such as flexural hinges at the member joints, are modelled and the structure is deformed or “pushed” until enough hinges form to develop a collapse mechanism or until the plastic deformation limit of a certain hinge is reached – that is, the structure is pushed-over a threshold reference situation.
For the case of a building with applied horizontal actions, such as seismic actions, the nonlinear flexural deformations occur near the elements extremities. The elements can be idealized admitting that the nonlinear behaviour is described as inelastic deformations lumped in certain extensions with fixed lengths near the extremities. In another way, it can also be considered that the distribution of the inelastic deformations occurs along a certain specific length of the element.
In order to avoid all the limitations of this nonlinear static procedure, some analysis methods have been proposed. One of them, quite simple and applicable to structures with multiple degrees of freedom, has been proposed by Fajfar and Fischinger [1]. This method, known as N2-method, is actually presented in Eurocode 8 (EC8) [2]. In the next paragraphs the method is fully described, as it appears in the above-mentioned regulation and as utilized by Cesar and Barros [3] [4] in a
parametric study of multi-storey steel buildings, and by Pereira, Barros and Cesar for concrete buildings [5] [6]. Further, comprehensive design aide has been edited with significant success by Elghazouli [7].
Nowadays the static non-linear analysis is considered as a valid alternative to the dynamic nonlinear analysis, in order to verify the structural safety of RC frames under seismic actions. Nevertheless this consideration cannot be generalized for all types of structures, and it is always necessary to know the limitations and potentialities of the methodologies.
Although the dynamic nonlinear analysis is the most accurate methodology, its non-linear characteristics require knowledge of the structural behaviour and inherent theoretical developments and it also demands costly computational resources. Such conditions are not often timely compatible with the design procedure, besides the fact that most of the designs do not justify the application of such elaborated models.
However, the design engineers need intuitive tools to determine the structural response under seismic actions, in particular for those that are strongly conditioned by dynamic actions. In this sense several researchers try to develop simplified analysis and design methodologies based on non-linear analysis, for the determination of the structural response, which can be routinely used by the structural designers.
2. NON-LINEAR STATIC
ANALYSIS
2.1. Introduction
Concisely, the methodologies for analysis of buildings under seismic actions can be divided in linear procedures and non-linear procedures [8]. The linear procedures include the Linear Static Procedure (LSP) and the Linear Dynamic Procedure (LDP); the non-linear procedures include the Non-Linear Static Procedure (NLSP) and the Non-Linear Dynamic Procedure (NLDP).
The linear procedures use linear stress-strain relationships and introduce corrections associated to the building global deformation and to the behaviour of materials – indirectly incorporating the non-linear dynamic response – to obtain a credible seismic behaviour. These procedures are valid for regular structures (in plan and elevation) or for buildings in which the structural response is very close to (or just deviates a few from) the elastic domain.
When the structures present strong irregularities or when the response occurs significantly in the linear domain, non-linear analysis (static or dynamic) should be used. Despite the fact that the dynamic behaviour of most structures is dominated by the first mode of vibration, this behaviour cannot be generalized to all kind of structures. In fact although the NLSP was initially applied to structures that did not present great sensibility for higher modes of vibration, some multimode load patterns have been developed and applied. This is effectively the case of structures with significant mass and/or stiffness asymmetries, for which the effects of higher modes of vibration can be conveniently incorporated in the pushover analysis (Almeida and Barros [9], Barros and Almeida [10], Chopra and Goel [11]). Successful applications of this technique have been obtained for asymmetric structures with displacement dependent passive energy dissipation devices (Li and Li [12] [13]).
These NLSP are non-linear static analyses of the structures with control of displacements and imposed loading (or pushover) that allow controlling the magnitude of the structural displacements and evaluating the seismic performance of the structure. The work developed herein is based in this pushover analysis [3]. Although this procedure is more correct than the procedures based on a linear analysis, its applicability should be thought carefully since it does not present sufficient sensibility to capture changes in the structural response as the stiffness degrades or when higher modes are also predominant in the response.
The non-linear dynamic analysis is the most realistic methodology and is based on the timely variation of the structural behaviour (of the materials and of the geometry) – therefore including material and geometric nonlinearities – under seismic actions. The NLDP best represents the seismic behaviour and performance of the structures; because of its realistic nature its applicability becomes complex, either for the calculation numerical processes and the computational resources involved, or for the necessary experience sensibility and advanced knowledge of the design engineer namely in the definition of the constitutive models.
2.2. Pushover Analysis
The pushover analysis is a simplified methodology to obtain the structural response to seismic actions through a non-linear static analysis. This analysis evaluates the performance of the structures through control of its displacements (at local and global levels), still giving information about the ductility and the resistant strength capacity.
(instead of assuming a uniform ductility throughout).
As already referred by Cesar and Barros [4] several methodologies exist associated to this type of analysis, among which the following: (i) the method proposed by the Applied Technology Council (ATC) in the report ATC-40 [14] for the analysis of concrete structures, based in simplified pushover methods (Method of the Spectrum of Resistant Capacity); (ii) the method proposed by the Federal Emergency Management Agency (FEMA) in the regulations FEMA 273/274 [8] and FEMA 356 [15], that present the guidelines for the design and seismic rehabilitation of buildings through pushover analysis (Method of the Displacement Coefficient); (iii) the method N2 proposed in Eurocode 8 (EC 8) [2] [7] and whose algorithm is comparable to the one proposed in FEMA 273/274 [8].
The resolution algorithm for this type of pushover analysis includes three stages: (i)
defining the resistant capacity of the structure through the application of horizontal incremental loads (or displacements); (ii) determining the seismic action and the response of the structure based on a non-linear behaviour to establish the level of objective proposed performance that consists in the determination of the objective displacement (target displacement) or of the point of seismic performance (performance point); (iii) evaluating the performance of the structure for the predetermined loading level (corresponding to the target displacement or to the performance point).
One of the most critical phases of this process is the definition of the lateral loading to be applied to the structure, which can be either constant in height or associated with the vibration modes, the number of floors, etc. The loading pattern (Table 1) should be selected so that the final performance of the structure really translates its response.
Table 1. Loading Pattern: FEMA 356 and EC 8.
FEMA 356 EC 8 (2003) – Method N2
Modal* (fundamental mode)
b n
j k j j
k i i
i F
h m
h m F
1
Fb – basal shear
Fi – inertia forces at floor level i
mi – mass of floor level i
hi – coefficient associated with fundamental mode
(height of floor level i)
k=1.0 for T<0.5s
k=0.75+T/2 for 0.5≤T<2.5s
k=2.0 for T≥2.5
*Can be multimodal (association of 3 first modes, as proposed by Chopra and Goel)
Uniform (see detail under EC 8)
Modal
b n
j j j
i i
i F
m m F
1
Fb – basal shear
Fi – inertia forces at floor level i
mi – mass of floor level i
i – modal coefficient at floor level i
Uniform
b n
j j i
i F
m m F
1
A loading associated to the fundamental mode cannot satisfy this approach if the structure presents a behaviour governed by higher mode effects; or still, when a constant loading is applied along height that is non conforming
displacement-controlled (that is, the lateral load is applied until a certain lateral displacement is achieved). Usually, the gravity loads are force-controlled and the lateral loads are displacement-controlled.
The implementation of these types of analyses on the new regulations for structural design in Portugal imposes the need to study and to validate these methodologies.
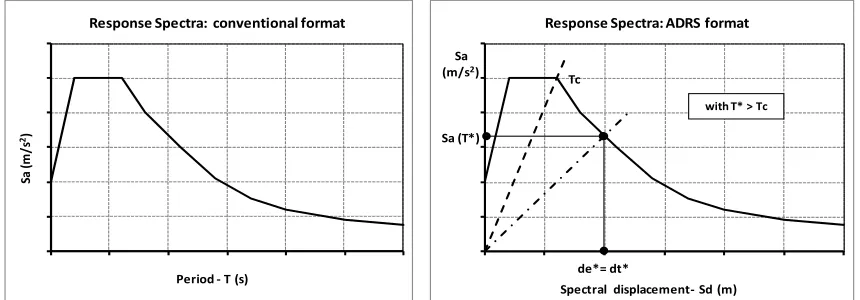
In the case of EC 8, the proposed methodology is based on the method N2 [2] [7] [16] whose spectrum representation presents the spectral values of the acceleration in function of the spectral values of the displacement; that is to say, it is presented in the format Acceleration Displacement Response Spectrum (or ADRS) as represented in Figure 1.
Fig. 1. Response spectra: conventional format and ADRS. Concisely an algorithm is presented for
application of this methodology, which is composed by the following phases:
(1) The structure is modelled and the constitutive relations are selected to define the behaviour of the materials. The seismic action is defined according to the regulatory design criteria;
(2) The loading pattern should contemplate at least two distributions: modal and uniform. In the modal case, an acceleration distribution is assumed proportional to the fundamental mode and the inertia forces Fi at each floor
level i are given by:
1
i i
i n b
j j j
m
F F
m
(1)In this equation Fb is the basal shear, mi is the
mass associated to the floor i and Øi is the
modal coefficient associated to the floor i. If the fundamental mode is considered linear, then the modal coefficient is proportional to
the height of the floor (hi) and the equation
will be:
1
i i
i n b
j j j
m h
F F
m h
(2)Finally, the curve of the resistant capacity is determined from the basal shear in function of the maximum displacement dmax (in the top of
the building) through the progressive application of the lateral load pattern until the required performance is reached associated to the maximum displacement.
(3) The initial structure has to be treated as a SDOF system, since its response is obtained from the response spectra. Thus, the resistant capacity is determined for an equivalent SDOF. The transformation, to convert the capacity curves for an equivalent SDOF, is done through the following relationship:
Fb
F* (3)
0,0 2,0 4,0 6,0 8,0 10,0 12,0
Sa (m/s2)
Spectral displacement- Sd (m) Response Spectra: ADRS format
Tc
Sa (T*)
de*= dt*
with T* > Tc
0,0 2,0 4,0 6,0 8,0 10,0 12,0
Sa
(
m
/s
2)
Period - T (s)
d
d* (4)
whose transformation factor Γ is given by:
n
j j j
n
j j j
m m
1 2 1
(5)
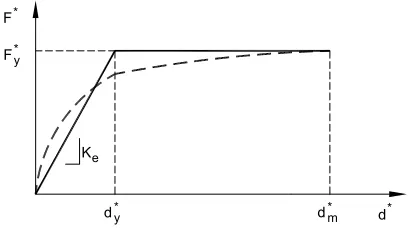
It is necessary to simplify the capacity curve for an elasto-perfectly plastic regime (Figure 2). In this graph Fy* represents the resistant
strength capacity of the system with an equivalent SDOF and dy* represents the
idealized yield displacement of the equivalent SDOF system. With these values the elastic period T, of the equivalent SDOF system, is determined.
Fig. 2. Idealization of the capacity curve (EC 8). (4) The idealized target displacement dt* is
determined, depending on the dynamic characteristics of the equivalent SDOF system, enabling to quantify the seismic response of the idealized equivalent SDOF system and to obtain the seismic performance of the equivalent SDOF system.
For medium and long periods, such that T≥Tc
2 2 *
4
T S
dt a (6)
For low periods, such that T <Tc, and inelastic
behaviour
2 *
2
1
1 1
4
c
t a
T T
d S q
q T
(7)
with
F*/m*
S q
y a
(8)
and
n
j j j
m m
1
(9)
In these equations: T is the period of the equivalent SDOF system, Sa is the spectral
acceleration for the period T, and Tc is the
period that defines the transition between constant velocity and constant acceleration (defined in the ADRS format response spectra of Figure 1, as the intersection between the straight line and the descending branch of the graph Sa vs Sd);
(5) After determining the performance point of the equivalent SDOF system it is necessary to determine the seismic performance of the structure. The loading pattern is applied until the maximum displacement dmax is reached, whose value is
obtained multiplying the target displacement by the transformation factor Γ;
(6) Finally, the resistant capacity and the floors drifts are verified, for a target displacement dt ≤dmax/1,5 .
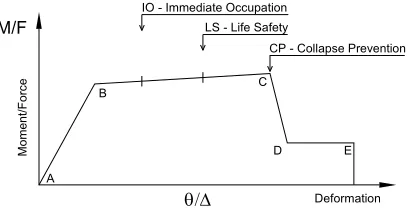
Another very important aspect in this pushover analysis is the definition of the material model that is used to simulate the ductility of the structural members of the complete structure. Figure 3 presents the simplified force-deformation relationship used to model the beam elements or columns, and the deformation criteria (for actions controlled by deformation) for the several materials used [8] [17]. In the first line AB a linear response is shown with a yield point at B. The inclination of the second line BC is usually low (0 to 10% of the value of the inclination of the elastic regime AB) and it represents some hardening. The third line CD represents the degradation of the resistant capacity while the line DE corresponds to the plastification of the structural element. The criteria of acceptable deformation is included by appropriate deformation ratios for primary elements (P)
*
y d*m
F*y
Ke
F*
d*
and secondary elements (S), which are also presented qualitatively in Figure 3 for three safety levels: Collapse Prevention (CP), Life Safety (LS) for the human life and Immediate
Occupation (IO) for usefulness or serviceability of the structure.
Fig. 3. Constitutive relationship for pushover analyses (FEMA 356). The values attributed to each point of the curve
vary in function of the type of structural element, and they still depend on other parameters as specified in the ATC-40 and in the FEMA-356. In simple framed structures the non-linear behaviour occurs in sections or nodes that can be previously identified and introduced in the calculation model through hinges with non-linear behaviour defined with material characteristics as represented in Figure 3.
3. Comparative Pushover Analyses of
Steel Frames
3.1. Introduction to models
The pushover analysis presented in this section is based in the algorithm included in the software MIDAS/Civil [18]. The application of this software in the determination of the seismic performance of structures is validated by several researchers whose works served as base for the definition of the models presented in this study (Williams and Albermani [19]).
In agreement with the criteria of seismic design, the forces induced in the structure during a high intensity earthquake surpass the yield limits causing great inelastic deformations. These deformations, caused by a combination of gravity loads and lateral loads, are located in the zones that possess larger internal forces and that constitute the so-called
critical zones in which occurs energy dissipation through plastification mechanisms.
The plastification mechanisms should represent conveniently the capacities of the resistant elements, especially with respect to the capacity associated to non-linear deformations namely the rotation capacity. Such elements should not present a significant loss of resistance for larger deformations. The designer should conceptualize and define the seismic-resistant members and select construction dispositions that guarantee the correct formation of the plastic hinges in the places chosen previously.
The analysis process begins with the elaboration of the 2D or 3D structural model and later on defining the location of the plastic hinges and the criteria associated to their behaviour. The software includes a data base with several predefined behaviours (according to FEMA 273/274) and it still allows the introduction of bilinear and tri-linear relationships defined by the user. Although these predefined characteristics can be useful in a preliminary analysis, the designer should validate its applicability for final analyses (preferentially through experimental validation).
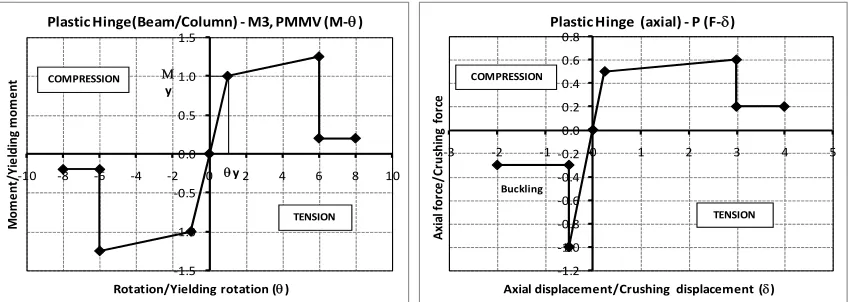
The hinges are defined through constitutive relationships as presented in Figure 3 by the diagram moment-curvature, which translates the non-linear behaviour expected at each
A
C B
E D
IO - Immediate Occupation LS - Life Safety
CP - Collapse Prevention
Moment/Forc
e
Deformation
plastification section. The hinge-type chosen for column locations (usually in the column extremities) has to consider the interaction between the axial force and the bending moments (P-M2-M3 hinge), but the interaction surface is user-defined. In the case of MIDAS/Civil it is possible to define an interaction surface or allow that the software
calculates the envelope through the characteristics of the structural members. The beam members are simulated just considering the contribution of the bending moment (M3 hinge), locating the bending hinges at appropriate sections in the extremities of the members.
Fig. 4. Plastic hinges: (a) bending hinge (M/My vs θ/θy); (b) hinge also under axial force.
When stiffening walls exist, which introduce significant rigidity in the structural global assemblage, they should be incorporated in the calculation model to obtain a model leading to a realistic capacity curve. The contour walls (even if they do not present any resistant function) can be simulated through a model of equivalent connecting rods with a behaviour defined by a shear plastic hinge located in the center of the wall panel (Cesar, Oliveira and Barros; [20]). In the case of an experimentally verified yielding of another type, as the crushing failure of the compression connecting rod, a model should be used that represents such behaviour including the instability effect by axial compression (corresponding to a model of equivalent connecting rods with a flexure hinge, also with axial force, located in the diagonals) [3] [4].
3.2. Description and characterization of the
application models
In this section are presented the models used to study the seismic behaviour of several structural systems. The purpose of this work is to study three metallic steel framed structures (regular in plan and elevation), constituting 3
or 6 or 10 floors structural frameworks, through a pushover analysis.
The structures were modelled using the commercial FEM package MIDAS/Civil, and for each structure three structural resisting solutions (one solution without bracing and two bracing solutions) were considered: (i) the structure is built without any bracing element; (ii) the building presents glass facades and a bracing system composed by diagonals in X-braces; (iii) the building presents glass facades and the bracing system, by architectural or by strength reasons, is constituted by K-braces.
The first structural case intends to simulate the occurrence of an earthquake during the construction phase, considering that the framed structure is totally built but it does not possess other bracing or stiffening members. The second and the third structural cases intend to simulate construction options enforced by architectural or by strength requirements.
Therefore the bracing system is constituted by metallic steel elements (diagonal X-braces or K-braces) placed at the corners of the
-1.5 -1.0 -0.5 0.0 0.5 1.0 1.5
-10 -8 -6 -4 -2 0 2 4 6 8 10
M
o
m
e
n
t/
Y
ie
ld
in
g m
o
m
e
n
t
Rotation/Yielding rotation ()
Plastic Hinge(Beam/Column) - M3, PMMV (M-)
COMPRESSION
TENSION
y
y
-1.2 -1.0 -0.8 -0.6 -0.4 -0.2 0.0 0.2 0.4 0.6 0.8
-3 -2 -1 0 1 2 3 4 5
A
xia
l fo
rc
e
/C
ru
sh
in
g
fo
rc
e
Axial displacement/Crushing displacement () Plastic Hinge (axial) - P (F-)
Buckling COMPRESSION
peripheral 2D-frames of the 3D-building. The pushover analyses were done to evaluate the capacity of these 2D-frames, since global structural capacity depends on the resistant capacity of these substructures especially for the structural model adopted in which the slabs are represented as infinitely rigid diaphragms (simulated through the functionality “Rigid Link-Plane” in MIDAS/Civil).
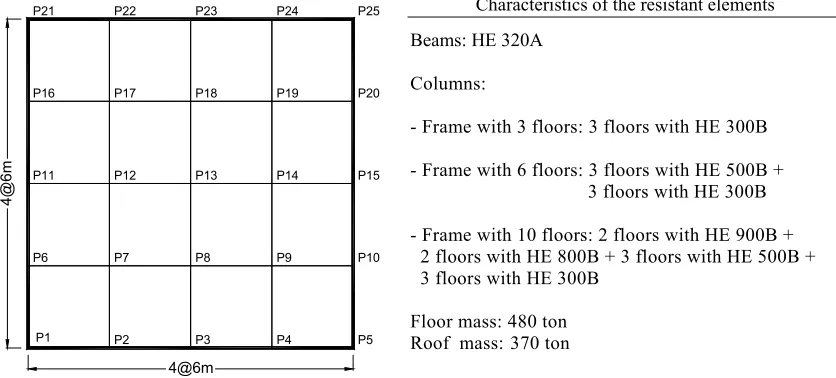
The results of the two structural cases (ii) and (iii) were compared with the results obtained in the case (i) when the resistant structure is only composed by a skeleton of beams and columns. The structural elements were predesigned in agreement with Portuguese design code RSAEEP and its characteristics are synthesized in Figure 5. The seismic design was elaborated in agreement with the EC8 criteria for soil type B and a damping ratio of 5%. For the quantification of this action two elastic response spectra were used, associated with seismic actions of type 1 (moderate earthquake at short focal distance)
and type 2 (strong earthquake at higher focal distance) in seismic zone 1 defined in the proposal of the EC8 National Annex of 2006 for Portugal.
Relatively to the distribution of the lateral loads, two patterns of lateral loading were considered: (i) uniform distribution, corresponding to a constant lateral acceleration; (ii) proportional distribution to the first vibration mode associated with the floor masses.
The gravity loads (G) include the own weight of the beams, columns and slabs and still the walls (external and interior partitions) floor coverings and wall coatings and revetments. Besides the load of 2 kN/m2 used for the wall partitions, still was considered a life-use overload (Q) of 3 kN/m2. The mass was calculated through the combination of actions: G + ψ2 × Q, with ψ2=0.4 (accounting for
reduction in the live load mass, when earthquake occurs).
Characteristics of the resistant elements Beams: HE 320A
Columns:
- Frame with 3 floors: 3 floors with HE 300B
- Frame with 6 floors: 3 floors with HE 500B + 3 floors with HE 300B
- Frame with 10 floors: 2 floors with HE 900B + 2 floors with HE 800B + 3 floors with HE 500B + 3 floors with HE 300B
Floor mass: 480 ton
Roof mass:370 ton
Fig. 5. Plan view and characteristics of the buildings resistant elements. The metallic steel members are of the class S
275 and they present an elastic longitudinal modulus E=210 GPa. The steel braces used in the structural solutions (ii) and (iii) are commercial profiles HE 100A and the bracing schemes (K-bracing and X-bracing) are located at the periphery frames corners.
In this study, the procedure to model the critical zones of the resistant elements was the following: (1) plastic hinges of simple bending (M), in the extremities of the beams; (2) plastic hinges of composed deviated biaxial bending (P-M2-M3) in the extremities of the columns; (3) plastic hinges of axial force (P) in the diagonals of metallic steel bracings.
P1 P2 P3 P4 P5
P6 P7 P8 P9 P10
P11 P12 P13 P14 P15
P16 P17 P18 P19 P20
P21 P22 P23 P24 P25
4@6m
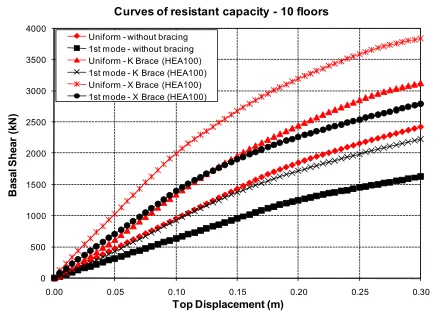
Figures 6, 7 and 8 represent the curves of resistant capacity of the frames (3, 6 and 10 floors) characterizing the performance of the structures for two schemes of distribution of the lateral loads (uniform and proportional) acting on the three structural configurations (without bracing; with X-braces; with K-braces).
In these curves it is possible to identify several important parameters in the seismic response of the analyzed structures, namely the yielding displacement and the stiffness variation with the increase of the load. This representation still supplies information about the non-linear behaviour of the structure.
Fig. 6. Curves of resistant capacity: Basal shear vs Top displacement (3 floors).
Fig. 7. Curves of resistant capacity: Basal shear vs Top displacement (6 floors).
Fig. 8. Curves of resistant capacity: Basal shear vs Top displacement (10 floors). 0
500 1000 1500 2000 2500
0,00 0,02 0,04 0,06 0,08 0,10
B
asal
S
h
ear
(
kN
)
Top Displacement (m) Curves of resistant capacity - 3 floors
Uniform - without bracing 1st mode - without bracing Uniform - K Brace (HEA100) 1st mode - K Brace (HEA100) Uniform - X Brace (HEA100) 1st mode - X Brace (HEA100)
0 500 1000 1500 2000 2500 3000 3500
0,00 0,02 0,04 0,06 0,08 0,10 0,12 0,14
B
asal
S
h
ear
(
kN
)
Top Displacement (m) Curves of resistant capacity - 6 floors
Uniform - without bracing 1st mode - without bracing Uniform - K Brace (HEA100) 1st mode - K Brace (HEA100) Uniform - X Brace (HEA100) 1st mode - X Brace (HEA100)
0 500 1000 1500 2000 2500 3000 3500 4000
0.00 0.05 0.10 0.15 0.20 0.25 0.30
B
asal
S
h
ear
(
kN
)
Top Displacement (m) Curves of resistant capacity - 10 floors
In a first observation it is verified that the resistant capacity depends on the loading pattern. For the analyzed structures, a uniform distribution of lateral loads led to higher resistant capacity. This effect is more significant with increasing number of floors. Notice that, in a simplified manner, the distribution associated to the first mode can be substituted by a triangular distribution since such configurations are very similar.
As it would be expected the worst performance corresponds to the un-braced structures; for the same top displacement of each of the three un-braced frames, corresponds a lower basal shear comparatively to the braced structural configurations.
When bracing members are added, the corresponding structural configurations have higher resistant capacity. The K-bracing system and the X-bracing system are modelled as pin-articulated struts and yield by axial force. The K-bracing configuration although stiffer (than configuration without braces) did not provide as high resistance as with the X-bracing configuration. The percentual increase of resistant capacity, when including a bracing system, decreases with increasing number of floors. This unexpected behaviour is associated to the reduced section of the strut bracing members (higher sections are generally used) and to the yielding model used for the hinges (yielding by axial force).
In fact structural solutions using K-braces were analyzed for several yielding modes of these bracing members (hinges P, hinges M and hinges P-M2-M3) to determine an inferior limit in the collapse mode of these elements; that was obtained with hinges of axial effort, the ones that conditioned these results in the present study. The worst performance of the
K-bracing system, as compared with the diagonal X-bracing system, is associated with a premature yielding by axial force at the connection with the slab.
The resistant capacity of the structure depends on the structural configuration model used (idealized by the structural designer) and the yielding of the structure – whose collapse mode is linked to the choice of the critical zones and to the yielding relationship – cannot correspond to the real collapse mode if the adopted non-linear behaviour does not correspond to the effective behaviour.
Because of that parametric studies are needed to identify the critical zones associated to bracing system configurations and the corresponding yielding modes, as form of validation of the structural models used in the calculation programs of various analysis and design software. This information is of paramount importance for the seismic design of structures. According to some researchers, this type of analysis is more adequate for low-rise structures and those that present higher frequencies.
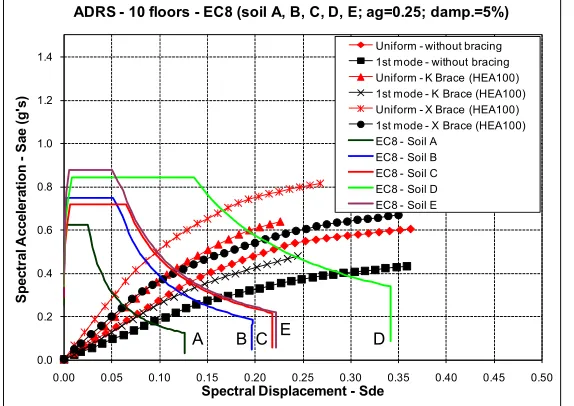
Figures 9, 10 and 11 represent the spectra of resistant capacity of the frames (3, 6 and 10 floors) and the response spectra in the format ADRS, for each structural configuration (as regards to stiffening bracing system). In these graphs the response spectra were evaluated according to EC 8, for soils A-B-C-D and E, damping ratio of 5% and peak ground acceleration of 0,25g.
Fig. 9. Capacity spectra and response spectra ADRS (frame with 3 floors).
Fig. 10. Capacity spectra and response spectra ADRS (frame with 6 floors).
Fig. 11. Capacity spectra and response spectra ADRS (frame with 10 floors). 0.0
0.2 0.4 0.6 0.8 1.0 1.2 1.4 1.6 1.8
0.00 0.05 0.10 0.15 0.20 0.25 0.30
E
sp
ect
ra
l A
ccel
er
at
io
n
-S
ae (
g
's
)
Espectral Displacement - Sde
ADRS - 3 floors - EC8 (soil A, B, C, D, E; ag=0.25; damp.=5%)
Uniform - without bracing 1st mode - without bracing Uniform - K Brace (HEA100) 1st mode - K Brace (HEA100) Uniform - X Brace (HEA100) 1st mode - X Brace (HEA100) EC8 - Soil A
EC8 - Soil B EC8 - Soil C EC8 - Soil D EC8 - Soil E
0.0 0.2 0.4 0.6 0.8 1.0 1.2 1.4 1.6 1.8
0.00 0.05 0.10 0.15 0.20 0.25 0.30
S
p
ect
ra
l A
ccel
er
at
io
n
-S
ae (
g
's
)
Spectral Displacement - Sde
ADRS - 6 floors - EC8 (soil A, B, C, D, E; ag=0.25; damp.=5%)
Uniform - without bracing 1st mode - without bracing Uniform - K Brace (HEA100) 1st mode - K Brace (HEA100) Uniform - X Brace (HEA100) 1st mode - X Brace (HEA100) EC8 - Soil A
EC8 - Soil B EC8 - Soil C EC8 - Soil D EC8 - Soil E
0.0 0.2 0.4 0.6 0.8 1.0 1.2 1.4
0.00 0.05 0.10 0.15 0.20 0.25 0.30 0.35 0.40 0.45 0.50
S
p
ect
ra
l A
ccel
er
at
io
n
-S
ae (
g
's
)
Spectral Displacement - Sde
ADRS - 10 floors - EC8 (soil A, B, C, D, E; ag=0.25; damp.=5%)
Uniform - without bracing 1st mode - without bracing Uniform - K Brace (HEA100) 1st mode - K Brace (HEA100) Uniform - X Brace (HEA100) 1st mode - X Brace (HEA100) EC8 - Soil A
EC8 - Soil B EC8 - Soil C EC8 - Soil D EC8 - Soil E
A B C E
D
A B C E D
A B C E
The transformation of the MDOF system into an equivalent SDOF system is based on the application of a reduction factor, which even without being constant for every case causes an expected overall reduction in capacity. In this context, the 3-floor frames present building seismic responses associated to low periods (T<Tc) and the 10-floor frames present seismic responses associated to medium or long periods (T>Tc) in agreement with criteria of method N2. This behaviour can be expected in the equivalent SDOF system since there is a general reduction in all capacity curves as mentioned before. Also, the increase of number of floors implied an increase in the spectral displacement and a decrease in the spectral acceleration.
The next step is the transformation of the MDOF capacity curve to an equivalent SDOF in order to compute the performance point in the response spectra. This new curve is obtained applying the transformation factor and the desired point can be determined through the intersection of this new resistant capacity curve with the response spectrum. Such methodologies for the determination of the seismic performance point are addressed in
the context of ATC-40 and the method N2 (in EC-8) and, as explained earlier, are based on the definition of the point of seismic performance of an equivalent SDOF system (1-EDF system).
Although the study that was carried out involved the analysis of all structural systems, only the system of 3 floors frame without bracing will be addressed herein to exemplify the purpose of this procedure (Figure 12); its application is similar for all other cases, according with the methodology for low and long periods as described in method N2 (in EC-8).
To perform the MDOF system reduction to an equivalent SDOF system it is necessary to determine the transformation factor Γ, expressed by equation (5). This factor is a function of the structural mass and the modal configuration associated with the 1st vibration mode. After calculating this transformation factor, the reduced capacity curve of the equivalent SDOF (1-EDF) system can be obtained dividing the basal shear and top displacement, in the MDOF capacity curve, by this factor (Figure 12).
Fig. 12. Equivalent Bilinear curve for 1st mode without bracing (frame with 3 floors).
The equivalent SDOF (1-EDF) capacity curve is then simplified to an elastic-perfectly plastic equivalent regime. To obtain this simplified curve it is necessary to determine both the
resistant strength capacity (Fy*) and the
idealized yield displacement (dy*) of the
equivalent SDOF (1-EDF) system. Since both curves must have the same dissipation energy, 0
500 1000 1500 2000 2500
0.00 0.02 0.04 0.06 0.08 0.10
B
asal
S
h
ear
(
kN
)
Top Displacement (m)
Curves of resistant capacity - 3 floors
the area below the simplified curve must be equal to the integrated area of the curve for the equivalent SDOF (1-EDF) system. The strength capacity has the same value as the one obtained for the maximum basal shear associated with the collapse mechanism in the equivalent SDOF curve and the yielding displacement is obtained applying the equal energy principle (Figure 12).
This is a fundamental step in the seismic performance characterization of the structure since a slight change in the bilinear curve can significantly influence the structural response and the corresponding seismic performance. Notice that the bilinear curve shown in Figure 12 has a reduced initial stiffness as compared with the equivalent SDOF curve; that leads to a less stiff structure and consequently to a higher fundamental period system.
The initial stiffness must be chosen according with the regime in which the structure is expected to operate. If the seismic structural performance is expected to occur at a quasi-linear regime with slight inelastic hinge behaviour then the initial stiffness assumes a very important role in the bilinear curve definition.
If a deep nonlinear behaviour is expected in the medium inelastic deformation range, then the chosen yielding values become more significant and the value assumed by the initial stiffness can be somehow neglected or disregarded.
With the bilinear equivalent curve defined it is possible to determine the equivalent period T* according to the following equation:
* *
*
*
2 y
y
m d T
F
(10)
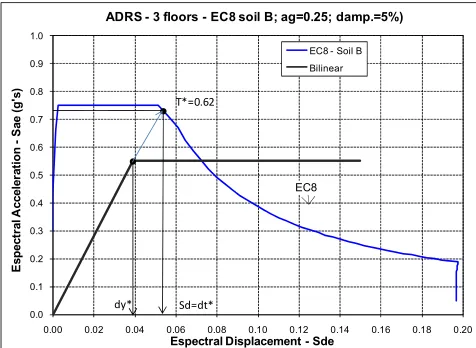
After determining the bilinear equivalent curve translating the elastic-perfectly plastic behaviour of the equivalent SDOF, it is necessary to perform a unit transformation to an ADRS format in order to characterize the performance point. This point is determined extending the initial stiffness bilinear branch to intersect the elastic spectral response. In this case (3 floors frame without bracing) the performance displacement is equal to dmax=dt*=Sd=0.053 m , as shown in Figure 13.
Also a ductility factor can be determined dividing the performance displacement by the yielding displacement.
Fig. 13. Performance point for 1st mode without bracing (frame with 3 floors).
At this point the maximum (top) displacement of the MDOF system is obtained from the performance point amplified by the transformation factor:
*
max top t d
d d S (11)
The seismic structural performance is then computed increasing the loading pattern and assuming this top displacement as the control 0.0
0.1 0.2 0.3 0.4 0.5 0.6 0.7 0.8 0.9 1.0
0.00 0.02 0.04 0.06 0.08 0.10 0.12 0.14 0.16 0.18 0.20
E
sp
ect
ra
l A
ccel
er
at
io
n
-S
ae
(g
's
)
Espectral Displacement - Sde
ADRS - 3 floors - EC8 soil B; ag=0.25; damp.=5%)
EC8 - Soil B Bilinear
dy* Sd=dt*
T*=0.62
displacement. With this process it is possible to access structural damage, hinge evolution, internal forces and inter-stories displacements.
These results can be compared with the resistant capacity values associated with the desired seismic performance. Obviously, this information is very important for seismic analysis and design purposes. Similar conclusions can be obtained by applying this methodology to the other structural systems.
The equivalent SDOF capacity curve is determine by a MDOF reduced curve for all cases and the behaviour that was observed in the original capacity curve is also visible in the reduced curves. Generally the bracing system increase the overall inelastic performance compared with the frames without these bracing systems. As expected lower top displacement are obtained with the corresponding decrease in the inelastic range.
The presented methodology is of paramount importance for the evaluation of the seismic performance of buildings and structures, because it is easily applicable and permits to obtain realistic non-linear response of structures (conditioning their seismic design). It still presents other advantages (Krawinkler and Seneviratna [21]) namely the identification of the structural critical zones (where localized losses of resistant capacity occur) and the visualization of the collapse sequence. Although some drawbacks have been pointed in the past [21] (some of them already overcome, like the inclusion of effects of higher modes) and still exist, like the insensibility for variations of the geometry and of the dynamic characteristics of the structure, if it is used appropriately this method constitutes a very good means for estimating the non-linear structural capacity.
REFERENCES
[1] Fajfar, P., Fischinger, M. (1988). “N2 – A method for non-linear seismic analysis of regular buildings”. Proceedings of the 9th World Conference in Earthquake
Engineering, Tokyo-Kyoto, Japan, Vol. 5, pp. 111-116.
[2] EC 8, (2003). “Eurocode 8: Design of structures for earthquake resistance; Part 1: General Rules, Seismic actions and rules for buildings”. CEN, Brussels.
[3] Cesar, M.B., Barros, R.C. (2007). “Estudo Preliminar sobre o Desempenho Sísmico de Pórticos Metálicos Contraventados a partir de Análises Estáticas Não-Lineares (Pushover)”. Proceedings of ‘Métodos Numéricos e Computacionais em Engenharia CMNE 2007 e XXVIII CILAMCE’, Congresso Ibero Latino-Americano sobre Métodos Computacionais em Engenharia, FEUP, Porto, CMNE/CILAMCE 2007, Paper 1184, pp. 1-18.
[4] Cesar, M.B., Barros, R.C. (2009). “Seismic performance of metallic braced frames by pushover analyses”. Proceedings of the Computational Methods in Structural Dynamics and Earthquake Engineering (COMPDYN 2009), Rhodes, Greece.
[5] Pereira, V.G., Barros, R.C., Cesar, M.B. (2009). “A parametric study of a R/C frame based on pushover analysis”. Proceedings of the 3rd International Conference on Integrity, Reliability & Failure (IRF 2009), Porto, Portugal.
[6] Pereira, V.G., Barros, R.C., Cesar, M.B. (2009). “Pushover analyses of a R/C frame by distinct software”. Proceedings of the 12th International Conference on the Enhancement and Promotion of Computational Methods in Engineering and Science (EPMESC XII), Hong-Kong and Macao.
[7] Elghazouli, A.Y. (2009). “Seismic design of buildings to Eurocode 8”. Spon Press, Abingdon, Oxon, UK.
[9] Almeida, R.F., Barros, R.C. (2003). “A new multimode load pattern for pushover analysis: the effect of higher modes of vibration”. Earthquake Resistant Engineering Structures IV, WIT Press, U.K., Vol. 13, pp. 3-13.
[10] Barros, R.C., Almeida, R. (2005). “Pushover analysis of asymmetric three-dimensional buildings frames”. Journal of Civil Engineering & Management, Vol. XI, No. 1, pp. 3-12.
[11] Chopra, A.K., Goel, R.K. (2004). “A modal pushover analysis procedure to estimate seismic demands for unsymmetric-plan buildings”. Earthquake Engineering & Structural Dynamics, Vol. 33, No. 8, pp. 903-927.
[12] Li, H.N., Li, G. (2007). “Simplified method for pushover curves of asymmetric structure with displacement-dependent passive energy dissipation devices”. Advances in Structural Engineering, Vol. 10, No. 5, pp. 537-549. [13] LI, G., LI, H.N. (2008). “Direct
displacement-based design for buildings with passive energy dissipation devices”. Gongcheng Lixue/Engineering Mechanics, Vol. 25, Issue 3, pp. 49-57.
[14] ATC, (1996). “Seismic evaluation and retrofit of concrete buildings”. Report ATC-40, Applied Technology Council, Redwood City CA.
[15] FEMA-356, (2000). “Prestandard and commentary for the seismic rehabilitation of buildings”. Report FEMA 356, Federal Emergency Management Agency, Washington.
[16] Fajfar, P. (2000). “A nonlinear analysis method for performance-based seismic design”. Earthquake Spectra, EERI, Vol. 16, pp. 573-592.
[17] Bento, R., Falcão, S., Rodrigues, F. (2004). “Avaliação sísmica de estruturas de edifícios com base em análises estáticas não lineares”. SISMICA 2004 – 6º Congresso Nacional de Sismologia e Engenharia Sísmica, Guimarães, Portugal.
[18] MIDASIT, (2005). “MIDAS/Civil – General purpose analysis and optimal design system
for civil structures”, MIDAS Information Technology Co, Ltd., Korea.
[19] Williams, M.S., Albermani, F. (2003). “Evaluation of displacement-based analysis and design methods for steel frames with passive energy dissipaters”. Civil Engineering Research Bulletin No. 24, University of Queensland, Australia.
[20] Braz-Cesar, M., Oliveira, D.V., Carneiro-Barros, R. (2008). “Numerical validation of the experimental cyclic response of RC frames”. Chapter 12 in the book Trends in Computational Structures Technology, Stirlingshire, Scotland, pp. 267-291.