M E T H O D O L O G Y
Open Access
The use of haplotype-specific transcripts
improves sample annotation consistency
Nicole Hartmann
1*†, Evert Luesink
1†, Edward Khokhlovich
1, Joseph D Szustakowski
1, Lukas Baeriswyl
1,
Joshua Peterson
1, Andreas Scherer
2, Nirmala R Nanguneri
1and Frank Staedtler
1Abstract
Background:Exact sample annotation in expression microarray datasets is essential for any type of pharmacogenomics research.
Results:Candidate markers were explored through the application of Hartigans’dip test statistics to a publically available human whole genome microarray dataset. The marker performance was tested on 188 serial samples from 53 donors and of variable tissue origin from five public microarray datasets. A qualified transcript marker panel consisting of three probe sets for human leukocyte antigens HLA-DQA1 (2 probe sets) and HLA-DRB4 identified sample donor identifier inconsistencies in six of the 188 test samples. About 3% of the test samples require root-cause analysis due to unresolvable inaccuracies.
Conclusions:The transcript marker panel consisting of HLA-DQA1 and HLA-DRB4 represents a robust, tissue-independent composite marker to assist control donor annotation concordance at the transcript level. Allele-selectivity of HLA genes renders them good candidates for “fingerprinting” with donor specific expression pattern.
Keywords: HLA-DQA1, HLA-DRB4, Microarray quality control (QC), Biomarkers, Dip test, mRNA
Background
Clinical molecular research and biomarker development rely on a high level of data quality. Ensuring data quality extends beyond the establishment of reproducible tech-nical processes involved in measurement of variables. Obtaining accurate clinical metadata is of utmost im-portance for meaningful clinical research, as they are necessary for finding clinical treatment or disease-biomarkers relationships [1]. Drawing conclusions based on incorrect metadata can have detrimental consequences in short-term or long-term patient care. Typical sample annotation errors may be due to sample mix-ups, database entry errors, or subjectivity, e.g. grading of a biopsy. In pharmacogenomics analyses, unrecognized annotation er-rors or sample mix-ups impact any supervised statistical analysis, such as certain steps during biomarker discovery and qualification, and patient stratification. Estimates of
sample mix-ups or annotation errors in clinical datasets range up to 18% [2]. Several statistical approaches have been devised to address annotation uncertainty during classifier development [3-5]. These sophisticated and extremely valuable approaches are applied as part of a later phase the analytical process. To begin addressing annotation uncertainty already at the database level, we have recently reported on a transcript marker for gender annotation which can be applied to clinical datasets of whole genome microarrays immediately after the gener-ation of data [6]. The so-called “REDKX”gender marker is based on heterosome genes with gender-dependent expression-characteristic. Application of this marker in-forms about the correctness of the gender annotation of a donor. In addition, control for inter-individual sample mix-up clinical datasets with multiple, e.g. longitudinal, sampling is an absolute must, and gender annotation QC is not sufficient to that goal, since sample mix-ups between individuals of the same gender would go undetected.
Of particular interest are genes with largely unchanged expression levels in samples of a donor, which would * Correspondence:[email protected]
†Equal contributors 1
Novartis Institutes for BioMedical Research (NIBR), Biomarker Development, Fabrikstrasse 10.13, CH-4002 Basel, Switzerland
Full list of author information is available at the end of the article
have a significantly different expression level in another donor. At best, those probe sets would display an inter-individual bimodal “on/off”-expression characteristic. Bimodal distribution of (signal intensity) data is a de-viation from the assumed normal distribution of mea-surements within a population, and can be recognized by the presence of two modes, each characterized by a peak. Bimodality can occur by differential expression, heterosome-specific expression, or, as observed e.g. in can-cer biology, by genomic lesions in some donors but not in others [7]. Candidate genes with bimodal expression characteristics exhibit heterosome-specific and/or haplotype-specific expression. Some Affymetrix probe sets were designed in polymorphic mRNA sequences and are (unin-tentionally) haplotype specific. Messenger RNA (mRNA) derived from a donor with a certain haplotype or poly-morphism does not hybridize with the same affinity to a locus of different haplotype or lacking the polymorphism, resulting in an extremely different expression level for the latter sample. The reason for the decreased or increased affinity is of technical nature: hybridization of a labelled mRNA fragment to a site with a single nucleotide poly-morphism (SNP) causes nucleotide mispairing, leading to the creation of a virtual bubble at the site of the SNP. The result is a less stringent binding of the mRNA fragment to the probe target, and lower signal intensity. Hence, sites with SNPs could be used for indirect genotyping, or “fin-gerprinting”[8,9].
In order to systematically assess deviation from unim-odality of individual probe sets we have utilized the principle of the dip statistic. The dip test had been pro-posed as a test statistic for unimodality [10]. It estimates the maximum difference between the empirical distribu-tion funcdistribu-tion and the unimodal distribudistribu-tion funcdistribu-tion that minimizes that maximum difference. In order to as-sess the significance of the Dip Test statistic, we ran 1 × 10⁶simulations, where a sample of the same size as the dataset in question, was drawn from a normal distribu-tion, and a Dip Test applied to each of the draws in order to generate 1 × 10⁶ simulated Dip Test statistics. As a result, we were able to derive an empirical p-value for each probe set. Here we report on the application of the Hartigans’ dip test to transcriptome wide clinical gene expression microarray datasets, in the search of probe sets which would help flag samples with potential donor-ID annotation mix-up.
Results
The transcript marker was trained on a publically available dataset of 47 Affymetrix HG-U133_Plus_2 mi-croarrays from a study of systemic juvenile idiopathic arth-ritis (GSE7753, http://www.ncbi.nlm.nih.gov/geo) [11]. After normalization and intensity filtering (see Methods), 21,044 probe sets entered the Hartigans’ dip test. To
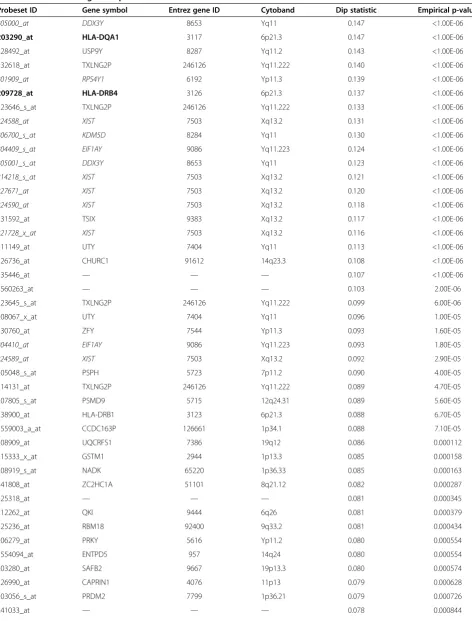
Table 1 Result of Hartigans’dip test
Probeset ID Gene symbol Entrez gene ID Cytoband Dip statistic Empirical p-value
205000_at DDX3Y 8653 Yq11 0.147 <1.00E-06
203290_at HLA-DQA1 3117 6p21.3 0.147 <1.00E-06
228492_at USP9Y 8287 Yq11.2 0.143 <1.00E-06
232618_at TXLNG2P 246126 Yq11.222 0.140 <1.00E-06
201909_at RPS4Y1 6192 Yp11.3 0.139 <1.00E-06
209728_at HLA-DRB4 3126 6p21.3 0.137 <1.00E-06
223646_s_at TXLNG2P 246126 Yq11.222 0.133 <1.00E-06
224588_at XIST 7503 Xq13.2 0.131 <1.00E-06
206700_s_at KDM5D 8284 Yq11 0.130 <1.00E-06
204409_s_at EIF1AY 9086 Yq11.223 0.124 <1.00E-06
205001_s_at DDX3Y 8653 Yq11 0.123 <1.00E-06
214218_s_at XIST 7503 Xq13.2 0.121 <1.00E-06
227671_at XIST 7503 Xq13.2 0.120 <1.00E-06
224590_at XIST 7503 Xq13.2 0.118 <1.00E-06
231592_at TSIX 9383 Xq13.2 0.117 <1.00E-06
221728_x_at XIST 7503 Xq13.2 0.116 <1.00E-06
211149_at UTY 7404 Yq11 0.113 <1.00E-06
226736_at CHURC1 91612 14q23.3 0.108 <1.00E-06
235446_at — — — 0.107 <1.00E-06
1560263_at — — — 0.103 2.00E-06
223645_s_at TXLNG2P 246126 Yq11.222 0.099 6.00E-06
208067_x_at UTY 7404 Yq11 0.096 1.00E-05
230760_at ZFY 7544 Yp11.3 0.093 1.60E-05
204410_at EIF1AY 9086 Yq11.223 0.093 1.80E-05
224589_at XIST 7503 Xq13.2 0.092 2.90E-05
205048_s_at PSPH 5723 7p11.2 0.090 4.00E-05
214131_at TXLNG2P 246126 Yq11.222 0.089 4.70E-05
207805_s_at PSMD9 5715 12q24.31 0.089 5.60E-05
238900_at HLA-DRB1 3123 6p21.3 0.088 6.70E-05
1559003_a_at CCDC163P 126661 1p34.1 0.088 7.10E-05
208909_at UQCRFS1 7386 19q12 0.086 0.000112
215333_x_at GSTM1 2944 1p13.3 0.085 0.000158
208919_s_at NADK 65220 1p36.33 0.085 0.000163
241808_at ZC2HC1A 51101 8q21.12 0.082 0.000287
225318_at — — — 0.081 0.000345
212262_at QKI 9444 6q26 0.081 0.000379
225236_at RBM18 92400 9q33.2 0.081 0.000434
206279_at PRKY 5616 Yp11.2 0.080 0.000554
1554094_at ENTPD5 957 14q24 0.080 0.000554
203280_at SAFB2 9667 19p13.3 0.080 0.000574
226990_at CAPRIN1 4076 11p13 0.079 0.000628
203056_s_at PRDM2 7799 1p36.21 0.079 0.000726
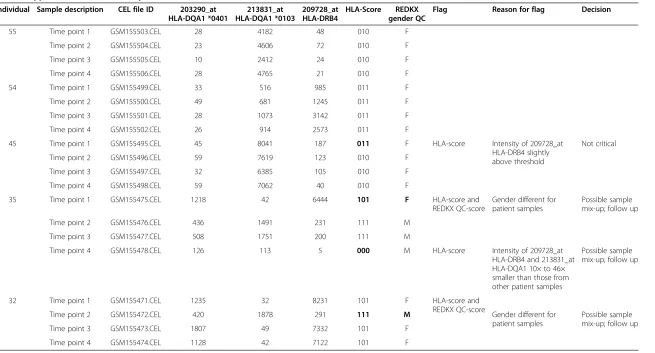
to the candidate HLA-score proposed in the present study. We have tested the HLA-score along with the REDKX gender QC marker in five publically available datasets of 188 samples from 53 donors. The normalized data for all samples can be accessed in Additional file 1: Table S1. Table 3 exemplifies many aspects of the performance of the donor ID-marker: (1) differentiation between donors, (2) identification of mislabelled samples, (3) providing additional information, where the REDKX QC marker is insufficient for donor discrimination, and (4) support of the REDKX gender QC. (1) The HLA-score for all four samples of donor 55 are the same, no quality flags for ei-ther the HLA-score or the REDKX gender score. Also, the HLA-score of the four samples from donor 54 is the same, but different from the score of donor 55. The result for those 8 samples indicates a high probability that those samples indeed come from different donors. (2) For donor 45, the HLA-score for time point 1 is different from the other HLA-score of the other three samples assigned to this donor, because the intensity value of 187 for 209728_at in the time point 1 sample is well above the threshold of 128, yielding a value of 1 in the HLA-score. The intensity values in the other samples are below the threshold, and yield a 0. This HLA-score difference should prompt the user to investigate and look closer at the data. In our experience, a slight transgression of the threshold is not critical, considering that all other marker intensity values follow a similar pattern as in the case of donor 45. (3) Two incidences were found in two samples from donor 35. Strikingly, three different HLA-marker scores
are found for the four samples of this donor. The sample time point 1 is interesting, as not only the HLA-score is different from the rest of the HLA-scores for this donor, but also the REDKX gender marker indicates that this sample belongs to a female, not to a male, as the other three samples. The sample of time point 4, which comes from a male as shown by the REDKX marker, is again very different from the two other samples from (a) male(s), at-tributed this donor. The intensities for two probe sets of time point 4 of donor 35 are about 10 to 46 times different from the corresponding values in time point 2 and 3. This intensity pattern should raise a flag and initiate a follow-up investigation to determine whether this sample is in-deed what the annotation claims. (4) Both the REDKX panel as well as the HLA-score indicate that the sample from time point 2 of donor 32 may be from a different in-dividual. The flag would initiate follow-up investigations of the cause.
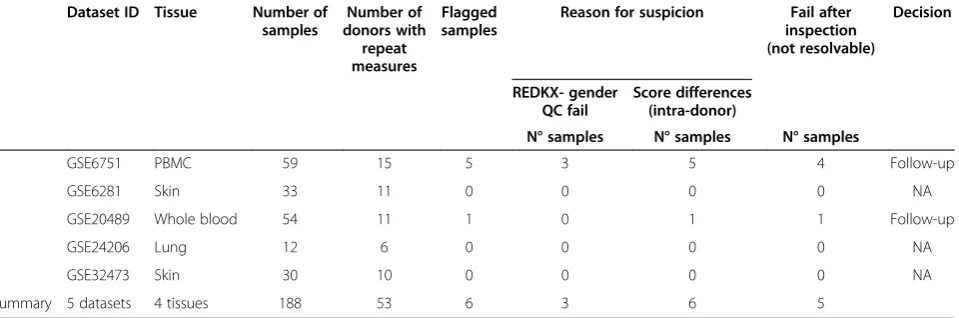
Table 4 summarizes the findings in 188 samples from 53 donors in five studies of four tissues types, whole blood, peripheral blood mononuclear cells (PBMC), and lung biopsy. Six samples were flagged for suspicious gender- and/or donor ID annotation, five of which in a single dataset. Three samples had incorrect gender an-notation according the REDKX gender QC. Based on the HLA-score results, seven samples had potentially in-correct donor identifiers. The annotation of 5 of the six flagged samples could not be resolved given the informa-tion resources provided in the public domain. Three of those five samples had incorrect gender and donor ID Table 1 Result of Hartigans’dip test(Continued)
205173_x_at CD58 965 1p13 0.078 0.000872
235104_at ERAP2 64167 5q15 0.078 0.000882
The table shows probe sets with an empirical p-value < 0.001, sorted by descending dip test statistics. About 47% of the genes in the list are located on heterosomes, among those all genes of the gender marker“REDKX”([6], italicized for visualization purposes). Probe sets for HLA-genes, which were further considered during the marker validation process, are highlighted in bold.
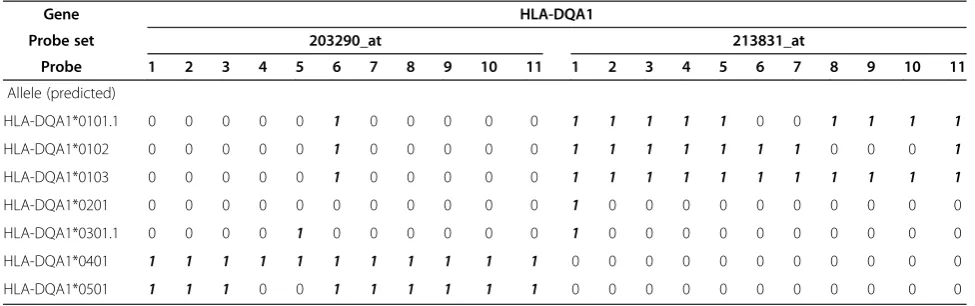
Table 2 Allele-specificity of HLA-DQA1 probe sets
Gene HLA-DQA1
Probe set 203290_at 213831_at
Probe 1 2 3 4 5 6 7 8 9 10 11 1 2 3 4 5 6 7 8 9 10 11
Allele (predicted)
HLA-DQA1*0101.1 0 0 0 0 0 1 0 0 0 0 0 1 1 1 1 1 0 0 1 1 1 1
HLA-DQA1*0102 0 0 0 0 0 1 0 0 0 0 0 1 1 1 1 1 1 1 0 0 0 1
HLA-DQA1*0103 0 0 0 0 0 1 0 0 0 0 0 1 1 1 1 1 1 1 1 1 1 1
HLA-DQA1*0201 0 0 0 0 0 0 0 0 0 0 0 1 0 0 0 0 0 0 0 0 0 0
HLA-DQA1*0301.1 0 0 0 0 1 0 0 0 0 0 0 1 0 0 0 0 0 0 0 0 0 0
HLA-DQA1*0401 1 1 1 1 1 1 1 1 1 1 1 0 0 0 0 0 0 0 0 0 0 0
HLA-DQA1*0501 1 1 1 0 0 1 1 1 1 1 1 0 0 0 0 0 0 0 0 0 0 0
annotation, two presented HLA-score data which could not be explained without further investigation, which was beyond the scope of the current project. In sum-mary, based on the HLA-score and the REDKX gender QC, 3% of the samples are not usable for further analysis and would yield incorrect results.
Discussion
Notwithstanding technical precision, annotation preci-sion is a major component contributing to high data quality. In an effort to standardize annotation, metadata da-tabases have been developed which provide user guidance
by implementation of controlled vocabulary [13]. However, Quantile-quantile plot of Hartigans’dip test statisticshuman error and subjectivity is still a common source of incorrect-ness in such databases [1]. Analysis errors and wrong con-clusions with possibly detrimental consequences can be the result if annotation errors remain undetected [4]. Current strategies of dealing with annotation errors include statis-tical tests at a relatively late stage of the analysis. We hy-pothesized that transcript markers could aid in improving detection of annotation precision at an early stage, at best before the analysis.
Our approach was to investigate, design, develop and implement quality control tools to qualify microarray data in the context of the donor sample. As an initial step we have recently developed and qualified the so-called REDKX marker which is a transcript panel marker based on expression of genes located on heterosomes, indicating gender of sample donors in clinical micro-array studies [6]. However, in studies with multiple sam-ples from donors, correct gender annotation still leaves an uncertainty about the correct assignment of a sample to a donor, as samples with the same gender annotation may come from different subjects of that gender. Hence, we devised a second annotation transcript quality con-trol marker, which would increase the detectability of samples with donor identification mislabels.
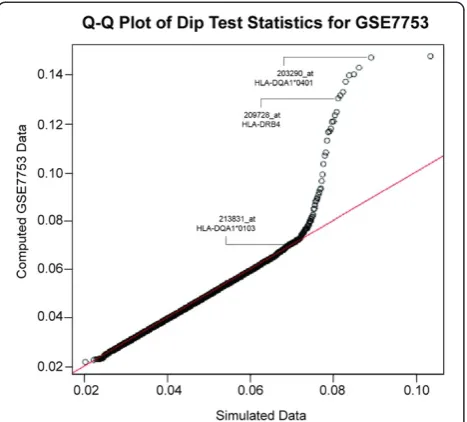
By applying the Hartigans’Dip Test statistic we identi-fied probe sets with bimodal expression pattern. Of par-ticular interest are probe sets which show allele-selectivity, such as probe sets for histocompatibility genes HLA-DQA1 and HLA-DRB4. Both genes are located on the p21 arm of chromosome 6, and could be in a linkage dis-equilibrium region. The markers do not represent expres-sion quantitative trait locus (eQTL) genes, and are expressed independent of gender. HLA genes code for cell surface proteins which are expressed by antigen present-ing cells and in the immune system serve the purpose of Figure 1Quantile-quantile plot of Hartigans’dip test statistics.
The line of identity (in red) indicates unimodal distribution of data. Simulated data are distributed along this line, while some of the probe sets from the dataset GSE7753 deviate from unimodal distribution. Three candidate marker probe sets, 203290_at (HLA-DQA1*0401), 213831_at (HLA-DQA1*0103), and 209728_at (HLA-DRB4) are pointed out.
Table 3 Application of the score to public datasets
Individual Sample description CEL file ID 203290_at HLA-DQA1 *0401
213831_at HLA-DQA1 *0103
209728_at HLA-DRB4
HLA-Score REDKX gender QC
Flag Reason for flag Decision
55 Time point 1 GSM155503.CEL 28 4182 48 010 F
Time point 2 GSM155504.CEL 23 4606 72 010 F
Time point 3 GSM155505.CEL 10 2412 24 010 F
Time point 4 GSM155506.CEL 28 4765 21 010 F
54 Time point 1 GSM155499.CEL 33 516 985 011 F
Time point 2 GSM155500.CEL 49 681 1245 011 F
Time point 3 GSM155501.CEL 28 1073 3142 011 F
Time point 4 GSM155502.CEL 26 914 2573 011 F
45 Time point 1 GSM155495.CEL 45 8041 187 011 F HLA-score Intensity of 209728_at
HLA-DRB4 slightly above threshold
Not critical
Time point 2 GSM155496.CEL 59 7619 123 010 F
Time point 3 GSM155497.CEL 32 6385 105 010 F
Time point 4 GSM155498.CEL 59 7062 40 010 F
35 Time point 1 GSM155475.CEL 1218 42 6444 101 F HLA-score and
REDKX QC-score
Gender different for patient samples
Possible sample mix-up; follow up
Time point 2 GSM155476.CEL 436 1491 231 111 M
Time point 3 GSM155477.CEL 508 1751 200 111 M
Time point 4 GSM155478.CEL 126 113 5 000 M HLA-score Intensity of 209728_at
HLA-DRB4 and 213831_at HLA-DQA1 10× to 46× smaller than those from other patient samples
Possible sample mix-up; follow up
32 Time point 1 GSM155471.CEL 1235 32 8231 101 F HLA-score and
REDKX QC-score
Time point 2 GSM155472.CEL 420 1878 291 111 M Gender different for
patient samples
Possible sample mix-up; follow up
Time point 3 GSM155473.CEL 1807 49 7332 101 F
Time point 4 GSM155474.CEL 1128 42 7122 101 F
Each sample of the dataset is labelled with a three-digit score (one“1”or“0”flag per probe set). The presence of intra-score differences elicits further follow-up investigation as to the nature and source of the difference. Intensity thresholds mark an“on”or“off”-status of the transcript expression, flagged as“1”or“0”, respectively. The thresholds were empirically determined for each marker separately. In some instances, the score difference is due to mild threshold violation, in other instances it may be due to sample mix-ups. The score picks up those samples which are being flagged by the REDKX gender QC, and detects further samples with issues (labeled in bold). REDKX panel expression values are provided in Additional file1: Table S1.
et
al.
Biomarker
Research
2014,
2
:17
Page
6
o
f
9
res.org/con
self- vs. nonself-discrimination [14]. Hence, HLA gene ex-pression patterns represent highly specific“fingerprinting” of individual donors. In general, our results receive support in the independent findings of Joehanes et al. who have suggested that gene expression levels, including those of HLA genes, could serve as“fingerprinting”data in micro-array datasets [15]. The authors came to this conclusion as part of their assessment of gene expression analysis from different blood-derived RNA sources. Here, we identify a candidate marker consisting of HLA genes in an unsuvised analysis and qualify it by training and testing its per-formance on a number of publically available datasets.
HLA genes are essential contributors to susceptibility to risk or resistance to several autoimmune diseases such as multiple sclerosis, rheumatoid arthritis, and Type 1 Diabetes [16-18]. As sequencing of the HLA locus con-tinues and more alleles are being identified, the number of allele-disease associations will grow [19-22]. For our ex-ploratory marker analysis we applied expression data for three HLA probe sets. As a consequence of the extremely high multiplexing of parameters interrogated by a micro-array it is not surprising that the behaviour of a single transcript in a large transcript population is not always 100% predictable and is the result of multiple factors such as assay and array performance. A three-digit sam-ple identifier score yields 8 different score types, not suffi-cient to completely discriminate all donors in studies with 9 or more donors. However, as shown in the case of donor 32 in GSE67511, only the combination of the REDKX gender marker and the score has the potential to further reduce sample ID ambiguities by eliciting follow-up inves-tigations should discrepancies between scores within a sample collection of a single donor arise. In the present analysis, we found that about 5% of the publically available samples used herein rewarded follow-up investigations, where half of those cases could not be resolved by
interrogating the data alone. Despite our encouraging results from public datasets of 4 tissue types, we recom-mend the optimal intensity thresholds be developed related to each tissue of interest. The reason for this sug-gestion lies in the tissue dependent expression level varia-tions as well as in technical dissimilarities, which may lead to deviations in global signal intensity, e.g. by different scaling settings.
Context-dependent biomarker qualification is driven by the application of the marker. The proposed genomic fit-for purpose biomarker approach fit-for quality control of sample ID annotations in transcriptomics clinical datasets with multiple samples per donor could be applied imme-diately. As part of our approach to this end, we have im-plemented the haplotype-based quality control as part of our microarray quality control pipeline. Microarray data files are automatically reviewed by the software after they are produced, with the analysis results cached and made available through a web interface, where likely problems are highlighted for further investigation.
In case of detected mismatches to reported metadata, a root-cause analysis will be necessary to determine the reason for the error. If the cause cannot be determined in too many cases or is systematic, the decision could be not to use the entire dataset [1].
In conclusion, we have identified a set of transcripts, which, particularly in combination with the REDKX gen-der marker, is capable that can be used as a starting point to control for sample ID annotation errors in clin-ical datasets with multiple samples per donor. In publi-cally available datasets we have identified about 3% of unresolvable annotation errors. Thus we recommend ap-plying the marker broadly in transcriptomics studies and to follow-up with root cause analysis where necessary. Direct sequencing will provide further confirmation and possible expansion of the marker panel.
Table 4 Summary of the score tests
Dataset ID Tissue Number of samples
Number of donors with
repeat measures
Flagged samples
Reason for suspicion Fail after inspection (not resolvable)
Decision
REDKX- gender QC fail
Score differences (intra-donor)
N° samples N° samples N° samples
GSE6751 PBMC 59 15 5 3 5 4 Follow-up
GSE6281 Skin 33 11 0 0 0 0 NA
GSE20489 Whole blood 54 11 1 0 1 1 Follow-up
GSE24206 Lung 12 6 0 0 0 0 NA
GSE32473 Skin 30 10 0 0 0 0 NA
Summary 5 datasets 4 tissues 188 53 6 3 6 5
Conclusions
Hartigans’Dip Test statistic is able to robustly identify probe sets with non-unimodal expression patterns, namely 203290_at (HLA-DQA1*0401), 213831_at (HLA-DQA1*0103), and 209728_at (HLA-DRB4). Combination of the so-called HLA-score and the REDKX marker panels provides a use-ful molecular quality control metric for sample annotation in clinical transcriptomics studies. Biological or clinical interpretation of gene expression data should take the haplotype specificity of these probe sets into account.
Methods Data analysis
Publically available microarray datasets were down-loaded from the data repository Gene Expression Omnibus (GEO, http://www.ncbi.nlm.nih.gov/geo/). Data analysis was performed in R [23]. The training of the marker was performed on MAS5 normalized data. The trimmed mean intensity (2%) per HG-U133 plus 2 array (www.Affymetrix. com, http://www.affymetrix.com/catalog/131455/AFFY/ Human-Genome-U133-Plus-2.0-Array#1_1, last accessed 03/2014) was scaled to 150. Intensity based filtering was applied using the criteria that the 90th percentile had to be greater than 6 on log2 scale. The dip test statistics were calculated for every probe set of 47 Affymetrix HG-U133_Plus_2 microarrays from a study of systemic juven-ile idiopathic arthritis (GSE7753, http://www.ncbi.nlm.nih. gov/geo) using the R package dip test (version 0.75-5, http://cran.r-project.org). To compute empirical p-value assessing the significance of an individual dip test statistic value, the dip test statistic was computed with 1 × 10⁶ per-mutations per probe set on a simulated dataset of the same sample size as the microarray training dataset. A proportion of simulated dip test statistic values that were greater than the observed one was used as an empirical p-value. Probe sets with empirical p-values < 0.001 were fur-ther considered. Empirical p-values were adjusted using the false discovery criterion by Benjamini and Hochberg [24]. For each probe set the interquartile range (IQR, 95th to 5th quantile) was calculated. Dip test core cut-offs using the training set data intensity-thresholds for each in-dividual marker were empirically determined based on the distributions of the mean-trimmed MAS5 normalized ex-pression (see above).
Additional file
Additional file 1: Table S1.Normalized signal intensities for marker probe sets and scores. For 188 test samples, normalized signal intensities of the marker probe sets of the HLA-score and the REDKX marker are shown, along with the panel scores.
Competing interests
The authors declare that they have no competing interests.
Authors’contributions
NH conceived of the study design and data generation; EL performed data analysis and interpretation of the data; EK performed the marker discovery and data analysis; JS conceived of the study and the design of the QC tool; LB generated microarray data; JP was involved in study design and design of the QC tool; AS performed data analysis and manuscript writing; NRN gave final approval of the manuscript; FS revised the manuscript critically for important intellectual content and gave approval of the manuscript. All authors read and approved the final manuscript.
Author details 1
Novartis Institutes for BioMedical Research (NIBR), Biomarker Development, Fabrikstrasse 10.13, CH-4002 Basel, Switzerland.2Spheromics, Kontiolahti, Finland.
Received: 23 July 2014 Accepted: 27 August 2014 Published: 30 September 2014
References
1. Goldberg SI, Niemierko A, Turchin A:Analysis of data errors in clinical research databases.AMIA Annual Symposium proceedings/AMIA Symposium AMIA Symposium2008, 242–246.
2. West M, Blanchette C, Dressman H, Huang E, Ishida S, Spang R, Zuzan H, Olson JA Jr, Marks JR, Nevins JR:Predicting the clinical status of human breast cancer by using gene expression profiles.Proc Natl Acad Sci U S A
2001,98:11462–11467.
3. Brodley CE, Friedl MA:Identifying mislabeled training data.J Artif Intell Res
1999,11:131–167.
4. Malossini A, Blanzieri E, Ng RT:Detecting potential labeling errors in microarrays by data perturbation.Bioinformatics2006,22:2114–2121. 5. Muhlenbach F, Lallich S, Zighed DA:Identifying and handling mislabelled
instances.J Intell Inf Syst2004,22:89–109.
6. Staedtler F, Hartmann N, Letzkus M, Bongiovanni S, Scherer A, Marc P, Johnson KJ, Schumacher MM:Robust and tissue-independent gender-specific transcript biomarkers.Biomarkers2013,18:436–445. 7. Tomlins SA, Rhodes DR, Perner S, Dhanasekaran SM, Mehra R, Sun XW,
Varambally S, Cao X, Tchinda J, Kuefer R, Lee C, Montie JE, Shah RB, Pienta KJ, Rubin MA, Chinnaiyan AM:Recurrent fusion of TMPRSS2 and ETS transcription factor genes in prostate cancer.Science2005,310:644–648. 8. Benovoy D, Kwan T, Majewski J:Effect of polymorphisms within
probe-target sequences on olignonucleotide microarray experiments.
Nucleic Acids Res2008,36:4417–4423.
9. Zhang L, Wu C, Carta R, Zhao H:Free energy of DNA duplex formation on short oligonucleotide microarrays.Nucleic Acids Res2007,35:e18. 10. Hartigan JA, Hartigan PM:The dip test of unimodality.Ann Stat1985,
13:70–84.
11. Fall N, Barnes M, Thornton S, Luyrink L, Olson J, Ilowite NT, Gottlieb BS, Griffin T, Sherry DD, Thompson S, Glass DN, Colbert RA, Grom AA:Gene expression profiling of peripheral blood from patients with untreated new-onset systemic juvenile idiopathic arthritis reveals molecular heterogeneity that may predict macrophage activation syndrome.
Arthritis Rheum2007,56:3793–3804.
12. Hoarau JJ, Cesari M, Caillens H, Cadet F, Pabion M:HLA DQA1 genes generate multiple transcripts by alternative splicing and polyadenylation of the 3’untranslated region.Tissue Antigens2004,63:58–71.
13. Rustici G, Scherer A, Quackenbush J:Data, Analysis, and Standardization. InBatch Effects and Noise in Microarray Experiments: Sources and Solutions.
Wiley and Sons; 2009:215–229. ISBN 970-0-470-74138-2.
14. Tsai S, Santamaria P:MHC class II polymorphisms, autoreactive T-cells, and autoimmunity.Front Immunol2013,4:321.
15. Joehanes R, Johnson AD, Barb JJ, Raghavachari N, Liu P, Woodhouse KA, O’Donnell CJ, Munson PJ, Levy D:Gene expression analysis of whole blood, peripheral blood mononuclear cells, and lymphoblastoid cell lines from the Framingham Heart Study.Physiol Genomics2012,44:59–75. 16. Chistiakov DA, Savost’anov KV, Baranov AA:Genetic background of
juvenile idiopathic arthritis.Autoimmunity2014,47:351–360.
complex in multiple sclerosis: HLA and non-HLA effects.PLoS Genet2013, 9:e1003926.
18. Roark CL, Anderson KM, Simon LJ, Schuyler RP, Aubrey MT, Freed BM: Multiple HLA epitopes contribute to type 1 diabetes susceptibility.
Diabetes2014,63:323–331.
19. Trachtenberg EA, Holcomb CL:Next-generation HLA sequencing using the 454 GS FLX system.Methods Mol Biol2013,1034:197–219. 20. Jazi MM, Solgi G, Roosta HA, Noshad S, Moslemi N, Sadrimanesh R, Moradi
B, Amirzargar AA:HLA-DRB and HLA-DQA/HLA-DQB allele and haplotype frequencies in Iranian patients with aggressive periodontitis.J Periodontal Res2013,48:533–539.
21. Morris DL, Taylor KE, Fernando MM, Nititham J, Alarcon-Riquelme ME, Barcellos LF, Behrens TW, Cotsapas C, Gaffney PM, Graham RR, Pons-Estel BA, Gregersen PK, Harley JB, Hauser SL, Hom G, International MHC, Autoimmunity Genetic N, Langefeld CD, Noble JA, Rioux JD, Seldin MF, Systemic Lupus Erythematosus Genetics Consortium, Criswell LA, Vyse TJ:Unraveling multiple MHC gene associations with systemic lupus erythematosus: model choice indicates a role for HLA alleles and non-HLA genes in Europeans.Am J Hum Genet
2012,91:778–793.
22. Witter K, Halliwell JA, Mautner J, Jolesch A, von Welser G, Rampp I, Spannagl M, Kauke T, Dick A:Group-specific amplification of HLA-DQA1 revealed a number of genomic full-length sequences including the novel HLA alleles DQA1*01:10 and DQA1*01:11.Tissue Antigens2014,83:49–51. 23. Team RDC:R: A Language and Environment for Statistical Computing.Vienna:
R Foundation for Statistical Computing; 2008.
24. Benjamini Y, Hochberg Y:Controlling the false discovery rate: a practical and powerful approach to multiple testing.J R Stat Soc1995,57:289–300.
doi:10.1186/2050-7771-2-17
Cite this article as:Hartmannet al.:The use of haplotype-specific transcripts improves sample annotation consistency.Biomarker Research 20142:17.
Submit your next manuscript to BioMed Central and take full advantage of:
• Convenient online submission
• Thorough peer review
• No space constraints or color figure charges
• Immediate publication on acceptance
• Inclusion in PubMed, CAS, Scopus and Google Scholar
• Research which is freely available for redistribution