R E S E A R C H
Open Access
HiSSI: high-order SNP-SNP interactions
detection based on efficient significant
pattern and differential evolution
Xia Cao
1, Jie Liu
1, Maozu Guo
2,3and Jun Wang
1*From14th International Symposium on Bioinformatics Research and Applications (ISBRA’18) Beijing, China. 8-11 June 2018
Abstract
Background: Detecting single nucleotide polymorphism (SNP) interactions is an important and challenging task in genome-wide association studies (GWAS). Various efforts have been devoted to detect SNP interactions. However, the large volume of SNP datasets results in such a big number of high-order SNP combinations that restrict the power of detecting interactions.
Methods: In this paper, to combat with this challenge, we propose a two-stage approach (called HiSSI) to detect high-order SNP-SNP interactions. In the screening stage, HiSSI employs a statistically significant pattern that takes into account family wise error rate, to control false positives and to effectively screen two-locus combinations candidate set. In the searching stage, HiSSI applies two different search strategies (exhaustive search and heuristic search based on differential evolution along withχ2-test) on candidate pairwise SNP combinations to detect high-order SNP interactions.
Results: Extensive experiments on simulated datasets are conducted to evaluate HiSSI and recently proposed and related approaches on both two-locus and three-locus disease models. A real genome-wide dataset: breast cancer dataset collected from the Wellcome Trust Case Control Consortium (WTCCC) is also used to test HiSSI.
Conclusions: Simulated experiments on both two-locus and three-locus disease models show that HiSSI is more powerful than other related approaches. Real experiment on breast cancer dataset, in which HiSSI detects some significantly two-locus and three-locus interactions associated with breast cancer, again corroborate the effectiveness of HiSSI in high-order SNP-SNP interaction identification.
Keywords: Genome-wide association studies, High-order SNP interactions, Statistically significant pattern, Family wise error rate, Differential evolution
Background
It has been widely recognized that single nucleotide polymorphisms (SNPs) are associated with a variety of human complex diseases. Genome-wide association study (GWAS) has became a powerful tool for detecting SNPs and detected hundreds of single SNPs associated with complex diseases [1]. However, these single SNPs can only
*Correspondence:[email protected]
1College of Computer and Information Science, Southwest University, 400715 Beibei, Chongqing, China
Full list of author information is available at the end of the article
explain a portion of the theoretical estimated heritability of complex diseases [2]. Complex diseases are influenced by various genetic variants and environmental factors. Therefore, SNP-SNP interactions defined as various joint effects of genetic variations should also be considered to better understand etiology of complex diseases.
Existing approaches for searching two-locus SNP interactions can be grouped into three categories: exhaus-tive search, stochastic search and machine learning based search. Methods based on exhaustive search enumerate all possible SNP combinations of two-locus
and perform interaction tests for each combination. Ritchie et al. [3] proposed the multifactor dimensional-ity reduction (MDR) approach, which partitions genotype combinations into two classes and exhaustively searches the best SNP combination by predicting the disease sta-tus. Stochastic methods use the random sampling proce-dures to search the space of SNP combinations. Zhang et al. [4] proposed a Bayesian epistasis association map-ping approach, which iteratively uses the Markov chain Monte Carlo to search two-locus interactions. Machin-ing learnMachin-ing methods [5], such as random forest, neural networks and support vector machines, also have been applied to discover SNP interactions. Bureau et al. [6] focused on measures of predictive importance and applied random forest to discover predictive polymorphisms or markers of a phenotype, which are likely to affect disease susceptibility.
There are some challenges in detecting high-order SNP interactions. The first is the computational challenge. Although the overall complexity is linear with the number of individuals, it becomes exponential with the increase of locus. For example, for a dataset containing 1 mil-lion SNPs, the number of combinations to be tested is tremendous: 5×10¹¹ pairwise interactions, 1.7×10¹⁷ 3-way interactions, 8.3×10275-way interactions [7]. There-fore, exhaustively searching high-order epistatic interac-tions would be a heavy computational burden. The second is the statistical challenge. To balance the false-positive rate and false-negative rate, many stringent significance thresholds should be applied.
Several high-order SNP interactions detection
approaches were developed to attack the aforementioned challenges. Xie et al. [8] proposed EDCF (Epistasis Detector based on the Clustering of relatively Frequent items) to detect multi-locus epistatic interactions based on two-locus interaction models. EDCF is a two-stage method, it firstly groups all genotype combinations into three clusters and then evaluates the significance of interaction modules based on χ2-test. Guo et al. [9] proposed a two-stage method called DCHE (Dynamic Clustering for High-order genome-wide Epistatic interac-tions detecting). DCHE dynamically groups all genotype combinations into three to six subgroups, and then sep-arately adoptsχ2-test to evaluate the candidate pairwise
combination in each subgroup. Yang et al. [10] proposed a stochastic search method (DECMDR). DECMDR combines the differential evolution algorithm [11] with a classification based multifactor-dimensionality
reduction to detect the significant associations
between cases and controls among all possible SNP combinations.
These high-order SNP interactions detection
approaches still have some limitations. Most of these approaches do not control false positives and apply
Bonferroni correction [12] in multiple hypothesis test for GWAS. Bonferroni correction is simple, but it is often overly conservative when the number of SNP is very huge. The correction comes at the cost of increasing the probability of producing false negatives, i.e., reducing statistical power [13,14].
In this paper, we propose a two-stage approach named HiSSI to detect high-order SNP interactions based on candidate pairwise SNP combinations. In the screening stage, a statistically significant pattern considering fam-ily wise error rate (FWER) is introduced to control false positives in multiple hypothesis test. HiSSI makes the statistically significant pattern faster and more memory-efficient via a fast Westfall-Young permutation testing [15], and obtains a corrected significant threshold to screen significant pairwise SNP combination candidates. In the search stage, HiSSI employs two different strate-gies to search high-order SNP interactions. For a small set, HiSSI uses the exhaustive search. For a large set, HiSSI employs a heuristic search technique named dif-ferential evolution (DE) algorithm [10, 11] along with χ2-test. We conduct simulation studies with various
two-locus and three-locus disease models to compara-tively study the power of HiSSI and that of state-of-the-art approaches, including EDCF [8], DCHE [9] and DECMDR [10]. The empirical study demonstrates that our proposed HiSSI is generally more powerful than these approaches. Further study on a real breast cancer (BC) dataset shows that HiSSI also detects some two-locus and three-locus combinations that are significantly asso-ciated with breast cancer. These experiments prove that HiSSI is capable to identify high-order interactions from genome-wide data.
Methods
Problem statement
Suppose a genotype dataset include N samples and M
SNPs. We useyto denote the phenotype (including case and control), P(s(i,j))to denote the pattern of pairwise SNP (i-th SNP andj-th SNP) combinations. LetN1andN0
denote the number of affected samples (i.e., cases) and the number of controls.
Suppose a SNP with a major alleleA, and a minor allele a. Three genotypes of a SNP are the homozygous refer-ence genotype (AA), the heterozygous genotype (Aa), and the homozygous variant genotype (aa). Generally, these three genotypes are encoded as {0, 1, 2}. In this paper, for k-th(k= {0, 1, 2}) genotype ofi-th(i= {1, 2,. . .,M}) SNP, we encode it as {0, 1} by the ratio of the number of case and the number of control, which can be calculated as:
Rik =
N0ik N1ik ×ω
where N0ik and N1ik denote the number of k-th
geno-type ofi-thSNP under control and case set, respectively;
ω = N1
N0 is a balance factor to control the influence of
unbalanced GWAS datasets. IfRik > 1, the genotype is
encoded by 1; otherwise, encoded by 0. In this way, each SNP is encoded by {0, 1}. For each pairwise SNP combi-nationP(s(i,j)), it is also encoded by {0, 1} instead of nine genotype combinations as follows:
P(s(i,j))=
0 Si=0and Sj=0
1 otherwise (2)
whereSiandSjdenote thei-thandj-thSNPs.
In the screening stage, HiSSI attempts to find all sig-nificant candidate pairwise SNP combinations(snpi,snpj)
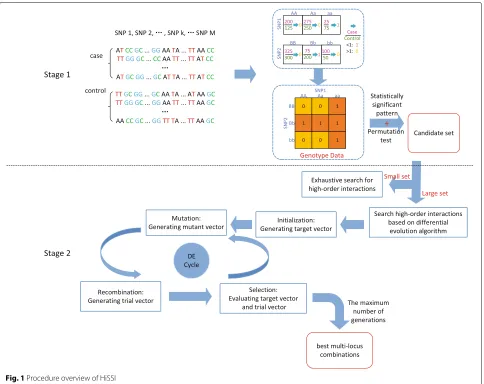
such thatP(s(i,j))is statistically associated with the phe-notypeyafter correction for multiple hypothesis testing. In the search stage, HiSSI tries to find out high-order SNP interactions based on candidate set. The whole pro-cedure of HiSSI is illustrated in Fig.1. The following two subsections elaborate on these two stages, respectively.
Stage 1: screening pairwise SNP combinations
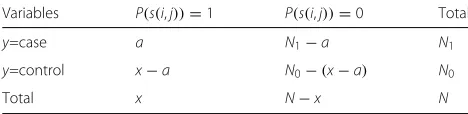
For each pairwise SNP combination P(s(i,j)), we can obtain the 2×2 contingency table forP(s(i,j))and pheno-typeyas Table1.
HiSSI evaluates the association between the phenotype yand the variableP(s(i,j))byχ2-test [16]. Supposepi,jis
the correspondingp-value of the two-locus combination (snpi,snpj) derived from the contingency table. Ifpi,j ≤
δ∗(δ∗is the corrected significant threshold), HiSSI deems the two-locus combination is significant and places it into candidate set.
HiSSI utilizes the minimum attainablep-value and the set of testable SNP combinations at significance level δ to make the permutation-testing more fast and efficient. Since the minimum attainablep-value(x)is symmetric aboutN/2 [17], there are onlyN2+1 different values of (x)denoted as {δ0,δ1,. . .,δN
2}, which is a
monotoni-cally decreasing sequence.(δ)is the testable region, one two-locus combination(snpi,snpj)is testable if and only if
the marginalx∈(δ).k=[σk l,σrk]
[N−σk
r,N−σlk]
Table 1Contingency table for two-locus combinations and phenotype
Variables P(s(i,j))=1 P(s(i,j))=0 Total
y=case a N1−a N1
y=control x−a N0−(x−a) N0
Total x N−x N
xis the number of samples whoseP(s(i,j))take value 1.ahas the same interpretation asxbut restricted to cases.
can be computed by starting from (δ0) =[ 0,N] and
iteratively shrinked to obtain(δk)from(δk−1).
At initialization, HiSSI generates J phenotypes based on J permutations, initializes J different minimum p -values {p(minj) }Jj=1 =1 (the maximum value a p-value can take) and initializes the corrected significance threshold asδ = δ1,δ1is the largest value that(x)can take other
than the trivial valueδ0 = 1, which deems all SNP pairs
that are testable and significant. Then, HiSSI computes the corresponding testability regionk andσlk. For each
two-locus combination, HiSSI computesx(i,j) and check
if the combination is testable or not in the current cor-rected significance levelδ. Ifxi,j ∈ k, the combination
is testable and needs to be processed. In such case, HiSSI does not need to exhaustively analyze all two-locus com-binations, and only needs to analyze these combinations whose marginal x is in testable region . By updating the minimump-values byJpermutations, FWER can be obtained. If FWER(δ) > α,kneeds to be increased so as to decrease FWER(δ)to control the false positives. The corrected significance thresholdδ∗ can be calculated as follows:
δ∗=max{δ|FWER(δ)≤α} (3)
The above processes are summarized in Algorithm 1.
Once the corrected significance threshold δ∗ is
obtained, for each two-locus combination, HiSSI com-putes the marginal xi,j and ai,j, which is the number of {P(si(i,j))}Ni=1 under the cases, and then computes the
corresponding p-value via χ2-test. If p
i,j ≤ δ∗, HiSSI
deems the combination is significant and places it into the candidate set.
Stage 2: high-order SNP interactions detection
In the search stage, HiSSI provides two strategies (exhaus-tive search and DE-based search) to search high-order SNP interactions based on candidate set.
Exhaustive search for small candidate set
Exhaustive search is affordable when the candidate set is small and has a larger chance to detect high-order SNP interactions than heuristic search. HiSSI applies exhaus-tive search on a small candidate set. To exhausexhaus-tively search
Algorithm 1Seek Corrected Significant Thresholdδ∗
1: Input:Genotype datasetD, phenotypey, number of
permutationsJand target FWERα
2: Output:Corrected significance thresholdδ∗
3: FunctionMain()
4: fort=1,. . .,J
5: y(t)←rand_permute(y) 6: p(mint) ←1
7: end for
8: for each two-locus combination(snpi,snpj) (i ∈
[ 0,M−1] , j∈[ 1,M])
9: Setk←1 and computeδk,kandσk 10: Computexi,j= {P(s(i,j))}Nn=1 11: ifxi,j∈kthen
12: Process_SNP()
13: end if
14: end for
15: End Function
16: FunctionProcess_SNP()
17: fort=1,. . .,J
18: Computep(i,jt)
19: p(mint) ←min(pmin(t) ,p(i,jt))
20: end for
21: whileFWER(δ) > α
22: Setk←k+1 and recomputeδk,kandσk
23: end while
24: End Function
K-SNP (K≥3) interactions, HiSSI combines all candidate SNP pairs to a set of K-SNP, and computes the corre-sponding p-value obtained by χ2-test of K-SNP. HiSSI reports these combinations whose p-values are smaller than the corrected significant thresholdsδ∗ of K SNPs, obtained by the Algorithm 1.
Heuristic search for large candidate set
For a large candidate set, HiSSI employs a heuristic search approach based on differential evolution (DE) algorithm [11,18–23] withχ2-test to identify high-order SNP inter-actions. DE is a powerful heuristic and parallel direct search approach with few control variables. Here, we take K =3 as an example to illustrate the process of detecting high-order interactions. The DE-based search strategy is presented as follows.
1. Initialization: for the candidate setC obtained from the first stage, a target vector is employed to
represent a combination of three SNPs fromC and
defined as: :
Xi,g=(f1,i,g,f2,i,g,f3,i,g|f ∈C), i=1, 2,. . .,ps
whereps is the population size, i.e., the number of
randomly generated target vectors;g means the
g-th iteration. i is the i -th target vector in the population,fj,i,g(j=1, 2, 3)represents one of the
three SNPs in thei -th target vector in the g-th generation. At the initialization (g=0),
fj,i,g(j=1, 2, 3)are randomly generated as follows:
fj,i,0=randj([ 0, 1))×(upper−lower)+lower, j=1, 2, 3
(5)
whereupper and lower are the upper and lower
bounds of the indexes of the candidate set. randj([ 0, 1))randomly generates a uniformly
distributed random value within the range [0,1). 2. Mutation: in the mutation operation, each target
vector generates a mutant vector:
Vi,g+1=Xr1,g+F·(Xr2,g−Xr3,g), i=1, 2,. . .,ps
(6)
wherer1,r2andr3∈(1, 2,. . .,ps)are the random indices of the population, and they are mutually different.Xr1,g,Xr2,gandXr3,gare the selected three
target vectors.F∈[ 0, 2]is a real and constant factor that controls the amplification of differential variation(Xr2,g−Xr3,g).
3. Recombination: in the recombination operation, the mutant vectorVi,g+1and the current target vector
Xi,gare incorporated to generate a trial vector:
Ui,g+1=(u1,i,g+1,u2,i,g+1,u3,i,g+1) (7)
where
uj,i,g+1=
vj,i,g+1, ifrandb(j)≤CRorj=rnbr(i)
xj,i,g, ifrandb(j)>CRorj =rnbr(i)
j=1, 2, 3
(8)
whererandb(j)is thej -th evaluation of a uniform random number generator with an outcome in
[ 0, 1],CR∈[ 0, 1]is the crossover constant.rnbr(i) is a randomly chosen index in(1, 2, 3), it ensures that Ui,g+1obtains at least one parameter fromVi,g+1.
4. Boundary constraints [10]: a trail vector must be checked whether it is a feasible SNP combination (i.e., no parameters in the trial vector outside of the problem space), and can be adjusted as follows:
uj,i,g+1=
⎧ ⎪ ⎨ ⎪ ⎩
randj([ 0, 1))×(upper−lower)+lower,
if(uj,i,g <loweroruj,i,g+1>upper)
xj,i,g, otherwise
(9)
5. Selection: the selection operation determines whether the target vectorXi,gis replaced by the trial
vectorUi,g+1in the next generation or not. An
evaluation function is used to evaluate the target and trial vectors. Here, HiSSI employs the chi-square test as the evaluation function. If the correspondingp-value of trial vectorUi,g+1
obtained by chi-square tese yields a better value than the correspondingp-value of target vectorXi,g,
namelyp(Ui,g+1) <p(Xi,g), then the target vector
Xi,g+1is set toUi,g+1in the next generation;
otherwise,Xi,g+1is set toXi,g.
Through the above four iterative operations (step (2)-(5)), the value of the target vector can be improved by competing between target vectors and trial vectors. These four operations are repeated until the maximum num-ber of generations (gmax) is reached, and the target vector
with the best fitness value is the detected high-order SNP interaction.
FWER control
In GWAS, SNP interaction detection leads to a multi-ple hypothesis testing problem that generates lots of false positives. To alleviate this problem, Boferroni correction [12] and permutation-testing [24], are widely used for cor-recting the multiple testing problem. However, Bonferroni correction only works when the number of test patterns is known in advance and small [14]. HiSSI applies a fast permutation-testing method [15] to strictly control the family wise error rate (FWER), defined as the possibility of producing at least one false positive. In the permutation-testing, HiSSI generates a re-sampled dataset by randomly permuting the phenotype. Then, HiSSI computes the min-imump-value across all genotype combinations. Repeat-ing the permutation for a sufficiently number (J) of times, it obtains J different minimum p-values {pmin(t) }Jt=1. The FWER can be evaluated as:
FWER(δ)= 1
J
J
t=1
1[p(mint) ≤δ] (10)
where 1[·] is an indicator function which takes value 1 if its argument is true and 0 otherwise;δ is the corrected significance threshold.
FWER control requires FWER≤ α with α being the
desired significant threshold. By doing this, the corrected significant thresholdδis chosen appropriately. The opti-mal δ∗ is obtained by solving the same optimization problem as Equation (3). In addition, the optimization problem also can yield the highest power (the probability of detecting true positives), and strictly control the FWER.
Results
[10] and HiSSI-BC on different disease models (includ-ing two-locus and three-locus) with different parameters settings. HiSSI-BC is a variant of HiSSI, it obtains the corrected significant threshold using the Bonferroni cor-rection. We adopt the same measure of power suggested by Wan et al. [25] as follows:
Power= D
D (11)
whereDis the number of datasets where exist true SNP interactions, andDis the number of all datasets. The def-inition of marginal effect sizeλof a disease locus is the same as the one used in Zhang et al. [4]:
λ= pAa/pAA
(1−pAa)/(1−pAA) −
1 (12)
where pAA and pAa denote the penetrance of genotype
AA and Aa, respectively. For the real study, we apply HiSSI on the real breast cancer (BC) GWAS dataset col-lected from Wellcome Trust Case Control Consortium (WTCCC) [26].
Experiments on simulated datasets
To do comprehensive experimental comparison, we con-duct simulation experiments on both two-locus and three-locus disease models. Since the number of candi-date SNP combinations is small after screening in the first stage, we apply exhaustive search to detect high-order interaction.
Two-locus disease models
Three two-locus disease models (Model1, Model2 and Model3) are used to compare HiSSI with EDCF [8], DCHE [9], DECMDR [10] and HiSSI-BC. Model1 and Model2 are proposed by Marchini et al. [27], where Model1 with a threshold effect, and Model2 with a multiplicative effect. Model3 is proposed by Zhang et al. [4] with an addi-tive effect. The marginal effect size is relaaddi-tively small in the simulation study, λ = 0.2 for Model1, Model2, and Model3. Minor allele frequencies (MAFs) are the same for both loci at three levels: MAF = 0.1, 0.2 and 0.4; and for Linkage disequilibrium (LD),r2 is set to 0.7 and 1.0: r2 = 0.7 is simulated for disease loci ungenotyped, but their LD markers genotyped; r2 = 1.0 is simulated for directly genotyped disease loci. We use the same simula-tion program as [4] to simulate 100 datasets under each parameter setting for each disease model. Each dataset contains 100 SNPs, and the sample size is fixed to 1000, 2000 and 4000.
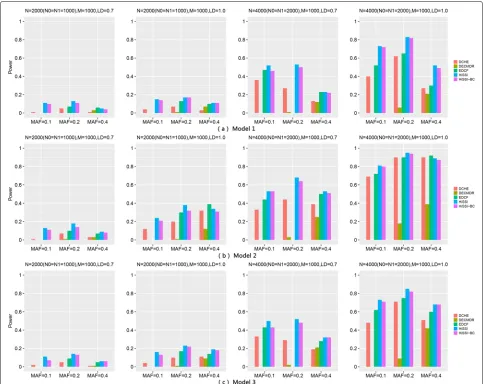
Figure2reveals the performance of different approaches on these three models. The power of all methods improves significantly when the sample size increasing from 2000 to 4000, and r2 changing from 0.7 to 1. However, the
power of most approaches decreases as the MAFs of dis-ease associated markers varying from 0.2 to 0.4. The trend is consistent with the results in [4,27].
Across all models, HiSSI outperforms HiSSI-BC, which evidences that the adopted permutation test is more effec-tive than Bonferroni correction for controlling false pos-itives in multiple hypothesis test. In addition, HiSSI also has a better performance than other approaches (EDCF, DCHE and DECMDR) for Model1–Model3 except some cases, Model1 withN = 2000, r2= 0.7, MAF = 0.4, and Model2 with r2= 1.0, MAF = 0.4. In these cases, HiSSI has a lower power than EDCF and DCHE. That is because HiSSI may lose some genetic associations, since it parti-tions two-locus genotype combinaparti-tions into two groups, which is much smaller than the number of genotypes. On the contrary, EDCF and DCHE partition genotype com-binations into more groups than HiSSI; EDCF has three groups, DCHE has three to six groups; whose numbers are larger than two and can retain more genetic infor-mation. In most cases, DECMDR has the lowest power, since it applies heuristic search and only reports the opti-mal solution. Another interesting observation is that the power of EDCF drastically decreases whenN= 4000 with r2= 0.7 and MAF = 0.2. One possible reason is that EDCF divides each three-locus combinations into three groups and uses the chi-square test with two degrees of free-dom to measure the significance, resulting in more false positives.
In addition, high-dimensional simulation datasets with 1000 SNPs, 2000 and 4000 samples on Model2 are also used to test HiSSI and other comparing approaches. The settings of MAF and LD are the same as before and the simulation datasets are also generated by the same simulation program as Zhang et al. [4].
Figure3reveals the performance of different approaches on Model2 with 1000 SNPs. Similarly, the power of all approaches significantly increases when the sample size increase from 2000 to 4000,r2varies from 0.7 to 1; and decreases when MAF varies from 0.2 to 0.4. For the model with 1000 SNPs, HiSSI still outperforms HiSSI-BC, which confirms the effectiveness of permutation test on high-dimensional datasets. HiSSI has a better performance than other approaches exceptr2= 1.0, MAF = 0.4. In such case, HiSSI has a lower power than EDCF and DCHE. EDCF loses its power whenN = 4000 withr2= 0.7 and
MAF = 0.2. All these results are consistent with the results on the small simulation datasets with Model2.
Three-locus disease models
Fig. 2Powers of different approaches on three two-locus disease models (Models 1–3) with 100 SNPs. Powers of DCHE, DECMDR, EDCF, HiSSI and HiSSI-BC on three two-locus disease models with different minor allele frequency (MAF), sample size (N) and linkage disequilibrium (LD); HiSSI-BC is a variant of HiSSI that uses the Bonferroni correction to obtain the corrected significant threshold.N0 is the number of controls,N1 is the number of cases, andMis the number of SNPs. The absence of a bar indicates no power. (a) Model1; (b) Model2; (c) Model3
model with a threshold effect. The sample size increases from 2000 to 4000; the minor allele frequencies (MAFs) is set to 0.1, 0.2, and 0.4; ther2changes from 0.7 to 1.0; and the marginal effect is set toλ = 0.3 for Model4 and Model5. We use the same simulation program in Zhang et al. [4] to simulate 100 datasets under each parameter set-ting for each disease model, and each dataset contains 100 SNPs.
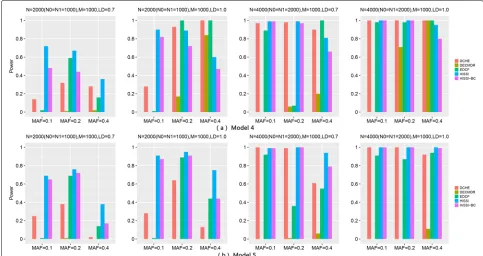
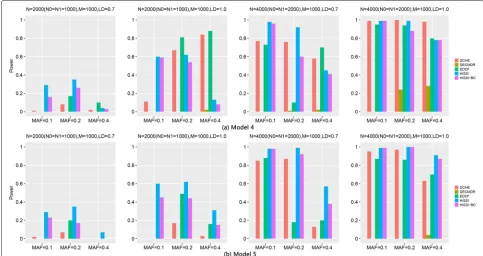
Figure4shows the performance of different approaches on two three-locus disease models for high-order interac-tions detection. The power of all approaches significantly improves with the sample size increasing from 2000 to 4000, andr2changing from 0.7 to 1. Besides, for Model5, the power of most approaches decreases with MAFs of the disease associated markers varying from 0.2 to 0.4. This trend is consistent with the results in two-locus disease model. However, the trend is not obvious for Model4 with MAF varying from 0.1 to 0.4.
For these two models, HiSSI again has a better per-formance than HiSSI-BC, which shows that permutation test is also more effective than Bonferroni correction in detecting high-order interactions. In addition, HiSSI obtains the highest power for Model4–Model5 except
some cases, Model4 with N = 2000, r2 = 1.0, MAF
= 0.2, 0.4; and N = 4000, MAF = 0.4. In these cases, HiSSI has a lower power than EDCF and DCHE. That
is due to the same reason as two-locus disease mod-els, resulting more false positives in HiSSI. For both models, the power of EDCF still drastically decreases when N = 4000 with r2 = 0.7 and MAF = 0.2, that is consistent with the results in two-locus disease model. Since EDCF, DCHE and HiSSI-BC all employ corrected Bonferroni correction to calculate the threshold, from the power between HiSSI between these methods, we can conclude that permutation test is more effective than Bonferroni correction for controlling false positives in multiple hypothesis test. In most cases, DECMDR has the lowest power, since it applies heuristic search in a larger search space and only reports the optimal solution.
Besides, high-dimensional simulation datasets with 1000 SNPs, 2000 and 4000 samples on Model4 and Model5 are also used to test HiSSI and other comparing approaches. The settings about MAF and LD are the same as the simulation datasets with 100 SNPs. Figure5reveals the performance of different approaches on Model4 and Model5 with 1000 SNPs. The trend for power of all approaches is consistent with that on the small simulation datasets. For both the two models, HiSSI still has a bet-ter power than HiSSI-BC; and HiSSI obtains the highest power except Model4 with MAF = 0.4, andN= 2000,r2= 1.0, MAF = 0.2. In these cases, the power of HiSSI is lower
Fig. 5Powers of different approaches on two three-locus disease models (Models 4–5) with 1000 SNPs. Powers of DCHE, DECMDR, EDCF, HiSSI and HiSSI-BC on two three-locus models under different minor allele frequency (MAF) and linkage disequilibrium (LD) with 1000 SNPs, 2000 and 4000 samples; HiSSI-BC is a variant of HiSSI that uses the Bonferroni correction to obtain the corrected significant threshold.N0 is the number of controls,
N1 is the number of cases, andMis the number of SNPs. The absence of a bar indicates no power. (a) Model4; (b) Model5
than EDCF and DCHE. All these results are consistent with the results on small simulation datasets.
In addition, we also conduct experiments on two mod-els (two-locus and three-locus modmod-els) without marginal effect with 100 and 1000 SNPs. The experimental set-tings, results and analysis can be found in Additional file1. All simulated models used in simulated experiments are showed in Additional file2.
Experiment on the breast cancer dataset
A real breast cancer dataset (BC) collected from WTCCC project [26] is used to further evaluate HiSSI. It is reported that breast cancer is caused by a combination of genetic and environmental risk factors [28]. The BC dataset con-tains 15347 SNPs from 1045 affected individuals and 3893 normal individuals. Quality control is performed to exclude very low rate samples and SNPs. For a SNP, if its call rate<95% across all samples, or itsp-value (Hardy-Weinberg equilibrium)<0.0001 in controls, or with MAF <0.1, the SNP will be excluded. For a sample, if its call rate < 98%, the sample will be excluded. Through the quality control, the BC dataset contains 1045 case samples and 3893 control samples with 5607 SNPs.
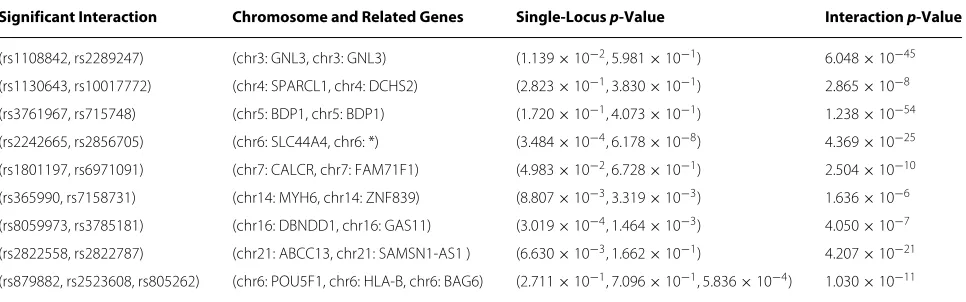
Some significant two-locus and three-locus combi-nations on BC dataset identified by HiSSI is shown in Table 2. In the two-locus combinations, (rs1108842,
rs2289247) is in gene GNL3 on chromosome 3. The
protein encoded byGNL3may interact with p53 and may be involved in tumorigenesis. (rs2242665, rs2856705) is on chromosome 6, where rs2856705 is susceptibly associated with breast cancer [29]. (rs1801197, rs6971091) is on chro-mosome 7, where rs1801197 is located in geneCALCR. It is evidenced that rs1801197/CALCRcan lead to breast cancer [29]. (rs365990, rs7158731) is on chromosome 14, where rs365990 is in geneMYH6, and rs7158731 is in gene ZNF839.MYH6encodes the alpha heavy chain subunit of cardiac myosin, and mutations in this gene cause familial hypertrophic cardiomyopathy and atrial septal defect 3. It is reported thatMYH6andZNF839 are associated with breast cancer [29]. (rs8059973, rs3785181) is on chromo-some 16, where rs8059973 is in geneDBNDD1, rs3785181 is in geneGAS11. rs8059973/DBNDD1is associated with breast cancer [29].GAS11includes 11 exons spanning 25 kb and maps to a region of chromosome 16 that is some-times deleted in breast and prostrate cancer. This gene is a putative tumor suppressor gene and is reported as being associated with breast cancer [30]. (rs2822558, rs2822787) is on chromosome 21, where rs2822558 is located in gene
ABCC13. ABCC13 is a member of the superfamily of
genes encoding ATP-binding cassette (ABC) transporters. It is reported that rs2822558/ABCC13is related to breast cancer [29].
Table 2Significant two-locus and three-locus combinations identified by HiSSI on WTCCC BC data
Significant Interaction Chromosome and Related Genes Single-Locus p-Value Interaction p-Value
(rs1108842, rs2289247) (chr3: GNL3, chr3: GNL3) (1.139×10⁻², 5.981×10⁻¹) 6.048×10−45
(rs1130643, rs10017772) (chr4: SPARCL1, chr4: DCHS2) (2.823×10⁻¹, 3.830×10⁻¹) 2.865×10⁻⁸
(rs3761967, rs715748) (chr5: BDP1, chr5: BDP1) (1.720×10⁻¹, 4.073×10⁻¹) 1.238×10−54
(rs2242665, rs2856705) (chr6: SLC44A4, chr6: *) (3.484×10⁻⁴, 6.178×10⁻⁸) 4.369×10⁻²⁵
(rs1801197, rs6971091) (chr7: CALCR, chr7: FAM71F1) (4.983×10⁻², 6.728×10⁻¹) 2.504×10⁻¹⁰
(rs365990, rs7158731) (chr14: MYH6, chr14: ZNF839) (8.807×10⁻³, 3.319×10⁻³) 1.636×10⁻⁶
(rs8059973, rs3785181) (chr16: DBNDD1, chr16: GAS11) (3.019×10⁻⁴, 1.464×10⁻³) 4.050×10⁻⁷
(rs2822558, rs2822787) (chr21: ABCC13, chr21: SAMSN1-AS1 ) (6.630×10⁻³, 1.662×10⁻¹) 4.207×10⁻²¹
(rs879882, rs2523608, rs805262) (chr6: POU5F1, chr6: HLA-B, chr6: BAG6) (2.711×10⁻¹, 7.096×10⁻¹, 5.836×10⁻⁴) 1.030×10⁻¹¹
*Indicates that the related gene is unknown.
POU5F1, which plays a key role in embryonic
develop-ment and stem cell pluripotency [31]. rs2523608 is located at geneHLA-Band belongs to human leukocyte antigen (HLA) class I heavy chain paralogs. HLA class I anti-gen expression plays a central role in the immune system and is closely related to the aggressiveness and prognosis of BC [32]. rs805262 belongs to geneBAG6, which was first characterized as part of a cluster of genes located within the human major histocompatibility complex class III region. In addition,BAG6is implicated in the control of apoptosis and is associated with basal cell carcinoma [33]. These identified significant two-locus and three-locus combinations demonstrate that HiSSI is capable to detect SNP interactions on genome-wide data.
Parameter setting
• In the screening stage, we setJ=100(number of
permutations),α=0.05(target FWER).
• In the search stage, there are four common
parameters of DE algorithm: population size (ps), generation size (g), the scaling factor (F) and crossover constant (CR). We set these parameters according to previous studies [10,34] For real dataset, we set:ps=500,g=500,F=0.5andCR=0.5.
Discussion
Comparison between HiSSI and other approaches
• Comparison between HiSSI and HiSSI-BC: HISSI-BC
is a variant of HiSSI, the main difference between HiSSI and HiSSI-BC is that HiSSI employs a fast permutation test to obtain corrected significant threshold, while HiSSI-BC uses the Bonferroni correction. For all simulation datasets on different disease models (including two-locus and three-locus), HiSSI always outperforms HiSSI-BC, which
demonstrates that permutation test is more effective than Bonferroni correction in correcting multiple testing.
• Comparison between HiSSI and EDCF, DCHE: HiSSI
utilizes a statistically significant pattern combined with permutation test to partition genotype combinations into two subgroups, which considers FWER to control false positives; while EDCF partitions genotype combinations into three subgroups, and DCHE dynamically partitions genotype combinations into three to six subgroups. Moreover, both EDCF and DCHE utilize the Bonferroni correction to correct multiple testing. The results on simulation datasets reveals HiSSI has a better performance than EDCF and DCHE, which proves the effectiveness of significant pattern in controlling false positives.
• Comparison between HiSSI and DECMDR: both
DECMDR and HiSSI utilize differential evolution (DE) algorithm to identify SNP interactions. DECMDR utilizes DE algorithm in the whole search space and uses the classification based
multifactor-dimensionality reduction (CMDR) as a fitness measure to evaluate values of solutions in the DE process. While HiSSI utilizes DE algorithm in a smaller search space based on candidate set and the chi-square test as the fitness measure in DE process, it has a higher probability to search the true
interactions. Since MDR is time-consuming and only reports the optimal solution, DECMDR has a lower power than other approaches in most cases.
The advantages and limitations of HiSSI
The development of HiSSI is to overcome of the lim-itations of existing approaches on detecting high-order SNP interactions from genome-wide data. HiSSI displays several advantages over existing methods:
• HiSSI applies a FWER-constrained statistically
• HiSSI utilizes a fast permutation testing to obtain corrected significant threshold, which avoids
analyzing all two-locus combinations, greatly reduces the total runtime; and also avoids the conservatism of Bonferroni correction.
• HiSSI provides two alternative search strategies, exhaustive search and heuristic search for different sizes of GWAS datasets.
The running time of HiSSI is relatively long compared with other approaches. It is a general problem for exist-ing approaches that employ permutation test. Although HiSSI utilizes a fast permutation test, which is faster than traditional permutation test, it is still time-consuming compared with heuristic algorithms and those approaches with Bonferroni correction. In addition, HiSSI does not directly control the main effects, which may introduce the negative influence of main effects for pairwise SNP combinations; and HiSSI only partitions genotype com-binations into two groups, which may lose some genetic association. These limitations may degrade the perfor-mance of HiSSI. Future work can be extended to address the above limitations.
Conclusions
Detecting potential SNP-SNP interactions in GWAS is an indispensable and challenging problem. In this paper, we proposed a two-stage method called HiSSI to solve the problem. In the screening stage, HiSSI controls the false positives using an efficient statistically significant pattern that considers the family wise error rate, and obtains significant candidate pairwise SNP combinations. In the search stage, HiSSI utilizes two different strategies, exhaustive search and DE-based search, to detect high-order SNP interactions. Exhaustive search is applied to a small candidate set, and DE-based search is used for a large candidate set. A series of simulation experiments on both two-locus and three-locus disease models show that HiSSI is more powerful than other related approaches in detecting SNP interactions. Further experiment on a real WTCCC dataset corroborates that HiSSI is capable to identify high-order SNP interactions from genome-wide data.
Supplementary information
Supplementary informationaccompanies this paper at https://doi.org/10.1186/s12920-019-0584-6.
Additional file 1:Experiments on models without marginal effect. Two disease models (a two-locus and a three-locus models) without marginal effect are used to test the performances of different approaches under different parameter settings.
Additional file 2:Simulated disease models. Simulated two-locus and three-locus models used in the simulation experiments are listed in tables.
Abbreviations
BC: Breast cancer; DE: Differential evolution; FWER: Family wise error rate; GWAS: Genome-Wide association study; HiSSI-BC: High-order SNP-SNP interactions detection with Bonferroni correction; HiSSI: High-order SNP-SNP interactions detection; LD: Linkage disequilibrium; MAF: Minor allele frequency; MDR: Multifactor dimensionality reduction; SNP: Single nucleotide polymorphism; WTCCC: Wellcome trust case control consortium
Acknowledgements
The two-page short paper of this work was an oral presentation in the 14th International Symposium on Bioinformatics Research and Applications (ISBRA 2018).
About this supplement
This article has been published as part of BMC Medical Genomics, Volume 12 Supplement 7, 2019: Selected articles from the 14th International Symposium on Bioinformatics Research and Applications (ISBRA-18): medical genomics. The full contents of the supplement are available athttps://bmcmedgenomics. biomedcentral.com/articles/supplements/volume-12-supplement-7.
Authors’ contributions
XC and JL implemented and conducted the experiments; JW and MG initialized and conceived the whole program; XC, JL and JW analyzed the results, drafted and finalized the manuscript; MG revised the manuscript. All the authors read and approved the final manuscript.
Funding
This work is supported by Natural Science Foundation of China (61873214, 61872300, 61871020 and 61562054), and partially supported by Chongqing Graduate Student Research Innovation Project (Grant No. CYS19113), the National Key Research and Development Plan Task of China (Grant No. 2016YFC0901902), Natural Science Foundation of CQ CSTC
(cstc2018jcyjAX0228 and cstc2016jcyjA0351), Fundamental Research Funds for the Central Universities (XDJK2019B024), the Open Research Project of The Hubei Key Laboratory of Intelligent Geo-Information Processing
(KLIGIP-2017A05), the Natural Science Fundamental Research Plan of Shaanxi Province (2016JM6038), and the Fundamental Research Funds for the Central Universities, NWSUAF, China (2452015060). The funders had no role in the study design, data collection, analysis and interpretation, decision to publish, or preparation of the manuscript.
Availability of data and materials
The source code of HiSSI is available at
http://mlda.swu.edu.cn/codes.php?name=HiSSI. The simulated disease models are specified in Additional file 2; and the simulated datasets are generated by the program in BEAM
(http://bioinformatics.ust.hk/SNPHarvester.html). The genome-wide Breast Cancer dataset is requested from Wellcome Trust Case Control Consortium (WTCCC), and its accession number is “EGAD00000000013”. WTCCC datasets cannot be shared without the permission from WTCCC. The researchers interested in WTCCC datasets can also apply them from WTCCC (https://www.wtccc.org.uk/).
Ethics approval and consent to participate
Not applicable
Consent for publication
Not applicable
Competing interests
The authors declare that they have no competing interests.
Author details
1College of Computer and Information Science, Southwest University, 400715
Beibei, Chongqing, China.2School of Electrical and Information Engineering, Beijing University of Civil Engineering and Architecture, 100044 Beijing, China. 3Beijing Key Laboratory of Intelligent Processing for Building Big Data, 100044 Beijing, China.
References
1. Welter D, MacArthur J, Morales J, Burdett T, Hall P, Junkins H, Klemm A, Flicek P, Manolio T, Hindorff L, et al. The nhgri gwas catalog, a curated resource of snp-trait associations. Nucleic Acids Res. 2013;42(D1):1001–6. 2. Kraft P, Hunter DJ. Genetic risk prediction–are we there yet? New Engl J
Med. 2009;360(17):1701–3.
3. Ritchie MD, Hahn LW, Roodi N, Bailey LR, Dupont WD, Parl FF, Moore JH. Multifactor-dimensionality reduction reveals high-order interactions among estrogen-metabolism genes in sporadic breast cancer. Am J Human Genet. 2001;69(1):138–47.
4. Zhang Y, Liu JS. Bayesian inference of epistatic interactions in case-control studies. Nature Genet. 2007;39(9):1167.
5. Upstill-Goddard R, Eccles D, Fliege J, Collins A. Machine learning approaches for the discovery of gene–gene interactions in disease data. Briefings in Bioinformatics. 2012;14(2):251–60.
6. Bureau A, Dupuis J, Falls K, Lunetta KL, Hayward B, Keith TP, Van Eerdewegh P. Identifying snps predictive of phenotype using random forests. Genet Epidemiol: Official Publ Int Genet Epidemiol Soc. 2005;28(2):171–82.
7. Ritchie MD. Finding the epistasis needles in the genoe-wide haystack. Methods in Molecular Biology. 2015;2015:19–33.
8. Xie MZ, Li J, Jiang T. Detecting genome-wide epistases based on the clustering of relatively frequent items. Bioinformatics. 2012;28(1):5–12. 9. Guo X, Meng Y, Yu N, Pan Y. Cloud computing for detecting high-order
genome-wide epistatic interaction via dynamic clustering. BMC Bioinformatics. 2014;15(1):102.
10. Yang C, Chuang L, Lin Y. Cmdr based differential evolution identifies the epistatic interaction in genome-wide association studies. Bioinformatics. 2017;33(15):2354–62.
11. Storn R, Price K. Differential evolution–a simple and efficient heuristic for global optimization over continuous spaces. J Global Opt. 1997;11(4): 341–59.
12. Weisstein EW. Bonferroni correction. From MathWorld-A Wolfram Web Resource. 2019 update. 2004.http://mathworld.wolfram.com/ BonferroniCorrection.html.
13. Nakagawa S. A farewell to bonferroni: the problems of low statistical power and publication bias. Behav Ecol. 2004;15(6):1044–5. 14. Li Y, Zhao Y, Wang G, Wang Z, Gao M. Elm-based large-scale genetic
association study via statistically significant pattern. Trans Syst, IEEE, Man, and Cybernet: Syst. 2017;PP(99):1-14.
15. Llinares-López F, Sugiyama M, Papaxanthos L, Borgwardt K. Fast and memory-efficient significant pattern mining via permutation testing. In: Proceedings of the 21th ACM SIGKDD International Conference on Knowledge Discovery and Data Mining. ACM; 2015. p. 725–34. 16. Pearson K. On the criterion that a given system of deviations from the
probable in the case of a correlated system of variables is such that it can be reasonably supposed to have arisen from random sampling, Vol. 50; 1990. p. 157–175.
17. Llinares-López F, Grimm DG, Bodenham DA, Gieraths U, Sugiyama M, Rowan B, Borgwardt K. Genome-wide detection of intervals of genetic heterogeneity associated with complex traits. Bioinformatics. 2015;31(12): 240–9.
18. Yang M, Guan J, Li C. Differential evolution with auto-enhanced population diversity: The experiments on the cec’2016 competition. In: Evolution Computation; 2016. p. 4785–9.
19. Yang M, Li C, Cai Z, Guan J. Differential evolution with auto-enhanced population diversity. IEEE Trans Cybernet. 2015;45(2):302.
20. Yang M, Cai Z, Li C, Guan J. An improved jade algorithm for global optimization. In: Evol Comput; 2014. p. 806–12.
21. Yang M, Guan J, Cai Z, Li C. A self-adaptive differential evolutionary algorithm based on population reduction with minimum distance. Int J Innov Comput Appl. 2014;6(1):13–24.
22. Yang M, Guan J, Cai Z, Wang L. Self-adapting differential evolution algorithm with chaos random for global numerical optimization. In: International Symposium on Intelligence Computation and Applications; 2010. p. 112–122.
23. Fang Z, Yang M, Zhang G, Guan J. A hybrid differential evolutionary algorithm based on the hierarchical clustering. In: Evol Comput; 2016. p. 2367–74.
24. Chaubey YP. Resampling-based multiple testing: Examples and methods for p-value adjustment. Taylor & Francis. 1993.
25. Wan X, Yang C, Yang Q, Xue H, Fan X, Tang NL, Yu W. Boost: A fast approach to detecting gene-gene interactions in genome-wide case-control studies. Am J Human Genet. 2010;87(3):325–40.
26. Burton PR, Clayton DG, Cardon LR, Craddock N, Deloukas P, Duncanson A, Kwiatkowski DP, McCarthy MI, Ouwehand WH, Samani NJ, et al. Association scan of 14,500 nonsynonymous snps in four diseases identifies autoimmunity variants. Nature Genet. 2007;39(11):1329. 27. Marchini J, Donnelly P, Cardon LR. Genome-wide strategies for detecting
multiple loci that influence complex diseases. Nature Genet. 2005;37(4): 413–7.
28. Michailidou K, Hall P, Gonzalez-Neira A, Ghoussaini M, Dennis J, Milne RL, Schmidt MK, Chang-Claude J, Bojesen SE, Bolla MK. Large-scale genotyping identifies 41 new loci associated with breast cancer risk. Nature Genet. 2013;45(4):1–2.
29. Milne RL, Burwinkel B, Michailidou K, Arias-Perez J-I, Zamora MP, Menéndez-Rodríguez P, Hardisson D, Mendiola M, González-Neira A, Pita G, et al. Common non-synonymous snps associated with breast cancer susceptibility: findings from the breast cancer association consortium. Human Mole Genet. 2014;23(22):6096–111. 30. Whitmore SA, Settasatian C, Crawford J, Lower KM, Mccallum B,
Seshadri R, Cornelisse CJ, Moerland EW, Cleton-Jansen AM, Tipping AJ. Characterization and screening for mutations of the growth
arrest-specific 11 (gas11) and c16orf3 genes at 16q24.3 in breast cancer. Genomics. 1998;52(3):325–31.
31. Cai S, Geng S, Jin F, Liu J, Qu C, Chen B. Pou5f1/oct-4 expression in breast cancer tissue is significantly associated with non-sentinel lymph node metastasis. BMC Cancer. 2016;16(1):175.
32. Hicklin, Daniel J, Marincola, Francesco M, Ferrone, Soldano. Hla class i antigen downregulation in human cancers: T-cell immunotherapy revives an old story. Mole Med Today. 1999;5(4):178–86.
33. Zhang M, Liang L, Morar N, Dixon AL, Lathrop GM, Ding J, Moffatt MF, Cookson WOC, Kraft P, Qureshi AA. Integrating pathway analysis and genetics of gene expression for genome-wide association study of basal cell carcinoma. Human Genet. 2012;131(4):615–23.
34. Price K, Storn RM, Lampinen JA. Differential Evolution: a Practical Approach to Global Optimization; 2006.
Publisher’s Note