97
Using Learning Analytics to Evaluate
Course Design and Student Behaviour in an
Online
Wine Business Course
Kerry Wilkinsona, Imogen McNamaraa, David Wilsonb and Karina Riggsa
Corresponding author: Karina Riggs ([email protected] )
aSchool of Agriculture, Food and Wine, The University of Adelaide Waite Campus, Glen Osmond SA 5064, Australia
bAdelaide Medical School, The University of Adelaide, Adelaide SA 5005, Australia
Keywords: learning analytics, learning outcomes, online learning, student engagement, student experience
International Journal of Innovation in Science and Mathematics Education, 27(3), 97–108, 2019 Special Issue: Agricultural Education
Abstract
This case study describes the use of learning analytics to evaluate the transition of a postgraduate wine business course from face-to-face to online delivery using e-learning course design principles. Traditionally, Foundations of Wine Science lectures were delivered face-to-face, however the decision to transition the course from semester to trimester format presented an opportunity for online delivery of lectures. This was initially achieved through audio recordings, then video lectures, supported by a range of digital learning resources intended to engage, support and enhance student learning and the student experience. Descriptive analysis of learning analytics, comprising assessment results, student evaluations of learning and teaching, and data sourced from the Learning Management System, was performed to evaluate the impact of online delivery of course content on student performance, satisfaction and engagement. The use of audio lecture recordings negatively impacted students’ perception of the overall quality of the course (including course organisation, learning strategies and learning resources). The subsequent implementation of e-learning designed video lectures was considered superior to audio recordings, albeit final grades were not significantly different between the delivery modes. However, student engagement was equal to, or better than facto-face delivery, when content was designed specifically for an e-learning environment.
Introduction
98
by students providing them with an opportunity to take control of their own learning, to gauge their performance, and to make informed choices about what to study. In a study conducted by Purdue University, 74% of students indicated their motivation increased due to course signals and that seeing their own engagement is a positive spur to stay engaged (Arnold & Pistilli, 2012). Objections by students to the use of their data for learning analytics is not widely reported in case studies or the literature.
Adaptive learning systems are emerging to help students develop skills and knowledge in a self-paced way. The clickstream data can be used by educators to obtain an understanding about how and when content is being used and how effective it is. As Universities continue to exploit Learning Management Systems (LMS) such as Blackboard, Moodle and Canvas, and adopt blended or online approaches to learning and teaching (Littlejohn & Pegler, 2007), the volume of learning analytics data available increases, affording a more detailed understanding of student engagement and study behaviour within online learning environments (Phillips et al., 2011). Learning analytics has the potential to transform the way impact and outcomes in learning environments are measured, to develop new ways of achieving excellence in teaching and learning and to provide students with richer information that can be used to make the best choices about their education.
This paper describes the use of learning analytics, comprising student grades, student evaluations of learning and teaching, and LMS data to assess student performance, satisfaction and engagement in a postgraduate wine business course, as it was being transitioned from face-to-face to online delivery over three years (2015 to 2017). In this way, this research aimed to demonstrate the way in which learning analytics can be used to inform decisions about teaching practice; in particular, the impact of audio versus video lectures, and the provision of interactive learning resources, on student engagement and the overall student experience in an online course.
Background
Foundations of Wine Science (FWS) is a core course within the University of Adelaide’s postgraduate Wine Business offerings. The course comprises theoretical and practical components: the theoretical component provides students with a broad understanding of sensory evaluation (the olfactory and taste systems), viticulture (grapevine structure and function, the seasonal cycle of vine growth and development, and factors affecting fruit composition, yield and quality) and oenology (the unit processes involved in winemaking, and their influence on wine style and quality); while the practical component, held during a 4 day intensive residential school, focuses on grapevine anatomy, variety identification, berry ripening, and development of skills in technical wine evaluation (i.e. training in the recognition and evaluation of different wine styles and their characteristic sensory attributes). Assessment is both formative (online quizzes and tutorials) and summative (practical reports, 10%; an assignment, 10%; sensory examinations, 35%; and a written examination, 45%).
99
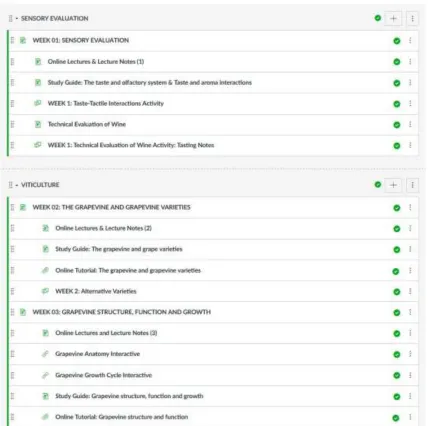
In 2017, the University also migrated the LMS from Blackboard to Canvas, and an e-learning designed approach was implemented for the establishment of FWS in the new Canvas LMS. Course content was organised into six modules: (i) course information; (ii) sensory; (iii) viticulture; (iv) oenology; (v) residential school (comprising the practical component of the course, which is taught intensively) and (vi) academic resources. The inclusion of a quick links table on the course homepage enabled students to access the majority of FWS content in only 1-2 clicks (compared with the 3-4 clicks previously required in the Blackboard LMS).
Figure 1: Screenshot from the Canvas Learning Management System showing the arrangement of course content (weeks 1 to 3) within the sensory and viticulture modules.
100
designed approach to production: i.e. videos were brief (typically <10 to 15 min) and focused on specific learning objectives, utilised audio and visual elements to convey knowledge, employed signaling to highlight key concepts, and used a conversational presentation style to maintain engagement. These strategies have been specifically recommended for the production of educational videos in order to maximise their benefit by addressing cognitive load, maintaining engagement and promoting active learning (Brame, 2016).
a)
b)
c)
101
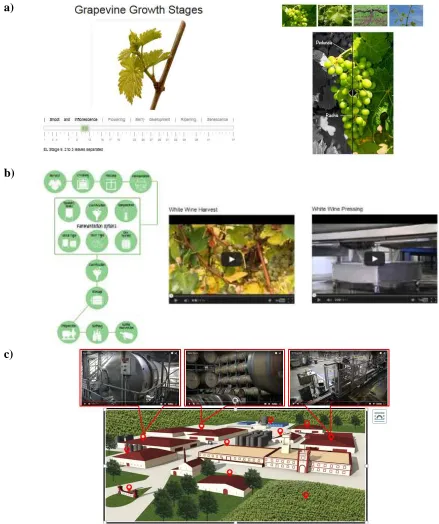
Importantly, video lectures were embedded within the Canvas LMS together with other digital learning resources (lecture notes, study guides, readings, learning interactives and discussion boards) to create a learning environment that aimed to engage, support and enhance both student learning and the overall student experience. This included a range of learning interactives developed for a massive open online course (MOOC) on wine, Wine101x: the World of Wine: From Grape to Glass ( https://www.edx.org/course/world-wine-grape-glass-adelaidex-wine101x-2), which were incorporated into the sensory, viticulture and oenology modules to complement content delivered via video lectures, and to provide a richer, more engaging learning environment. These included: interactive ‘sliders’ depicting grapevine anatomy and the key stages of grapevine growth and development (Figure 2a); winemaking flowcharts comprising video demonstrations of key winery operations (Figure 2b); a winemaking game, in which participants make a series of decisions throughout the winemaking process to influence a simulated wine judging; and an online fieldtrip showcasing grape and wine production at the Yalumba winery (Figure 2c).
Methods
This study used learning analytics, comprising assessment results, student experience of learning and teaching (SELT) surveys and LMS data (including page views per student and the frequency, timing and duration of LMS access by students) to evaluate the impact of online delivery of FWS on student performance, satisfaction and engagement/behaviour. Student grades and SELT data were obtained for FWS from 2015 to 2017, while LMS data was sourced from Canvas in 2017. Learning analytics data were subjected to descriptive analysis using a reconstructive approach (van den Akker, 1999) and/or analysis of variance using GenStat (15th Edition, VSN International Limited, Herts, UK).
Results and discussion
Student performance and satisfaction
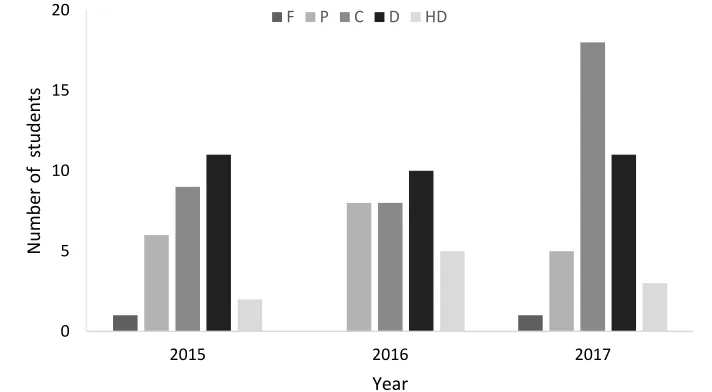
The transition from traditional face-to-face lectures to audio lectures and then video lectures from 2015 to 2017 did not impact the final grades achieved by students. Average marks were 71.1 ± 1.6, 71.8 ± 1.8 and 72.2 ± 1.9 %, respectively; with no significant difference (P=0.904) between grade bands (fail to high distinction) observed between cohorts of students (Figure 3).
However, the implementation of online delivery via audio recordings resulted in a downward shift in course SELT scores in 2016 (Table 1); with significantly lower scores returned for SELT questions relating to course organisation and overall course satisfaction in 2016 compared with 2015 (P=0.004 and 0.048, respectively). The audio recordings failed to engage students and negatively impacted their learning experience. The qualitative SELT comments made by one student, ‘The online aspects are difficult to engage with and also feel like a very solitary experience. There is no real engagement with the other students or the lecturer…’, reflect student’s limited access to the lecturer and engagement with peers, as well as the length and quality of the audio recordings (recordings were typically 2 hours each, and sound quality varied considerably).
102
As a consequence, course SELT scores were comparable to those achieved in 2015, i.e. prior to online delivery, being >6.0/7.0 (Table 1); the SELT scores returned for questions relating to course organisation and course satisfaction were significantly higher in 2017 than in 2016 (P=0.004 and 0.048, respectively). Qualitative SELT responses further reflected students’ improved course satisfaction: ‘The online material is exceptional and well organised’ and ‘This course provides a platform for independent learning’. Students may have felt more engaged
with the lecturer when they could see and interpret body language and facial expressions.
Figure 3: Histogram of final grades for Foundations of Wine Science students in 2015 (n=29), 2016 (n=31) and 2017 (n=38); where F = fail (< 50%), P = pass (50–64%), C = credit (65–74%), D = distinction (75–84%) and HD = high distinction (≥85%).
Student engagement and learning behaviour
When interpreting the LMS data (from Canvas in 2017), 100% of students were found to have accessed the lecture notes in written form (i.e. as a PDF). In contrast, only 55% of students accessed the video lectures, with the average number of views per student ranging from 1.19 to 1.56. The lower percentage of video views likely reflects the student demographic. The majority of postgraduate FWS students are international (i.e. >80%), mainly originating from China, a significant proportion of whom have limited English communication skills and/or limited familiarity with wine due to cultural differences and social etiquette involving consumption of alcohol. The demographic of the student impacts the way in which they use, interact, navigate and engage with online materials, providing insight into patterns of behaviour for learners; i.e. the preference of some international students to study from written course materials, particularly when English is a second language, compared to listening to the pronunciation of words in audio/video content, especially for content comprising highly technical nomenclature. This is supported by Ramburuth and McCormick (2001) who compared the learning styles of Asian international and Australian students, and found Asian international students had a lower preference for auditory learning. The written form of lecture notes can easily be translated into other languages, suggesting transcripts of lecture recordings could be included as an additional learning resource for international students. This highlights the need to provide a variety of learning resources that take into account the diverse ways in which different students learn.
0 5 10 15 20
2015 2016 2017
N
u
m
b
er
o
f
stu
d
en
ts
Year
103
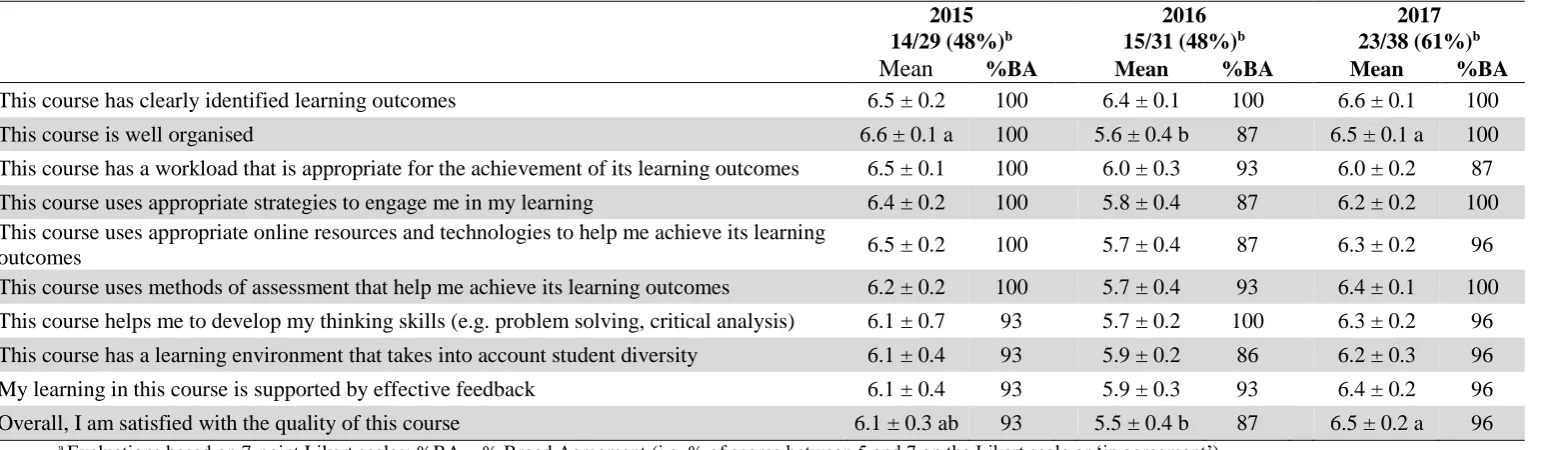
Table 1: Course Student Experience of Learning and Teaching scoresa for Foundations of Wine Science in 2015 (face-to-face), 2016 (online
using audio recordings) and 2017 (online using video lectures).
2015 2016 2017
14/29 (48%)b 15/31 (48%)b 23/38 (61%)b
Mean %BA Mean %BA Mean %BA
This course has clearly identified learning outcomes 6.5 ± 0.2 100 6.4 ± 0.1 100 6.6 ± 0.1 100
This course is well organised 6.6 ± 0.1 a 100 5.6 ± 0.4 b 87 6.5 ± 0.1 a 100
This course has a workload that is appropriate for the achievement of its learning outcomes 6.5 ± 0.1 100 6.0 ± 0.3 93 6.0 ± 0.2 87 This course uses appropriate strategies to engage me in my learning 6.4 ± 0.2 100 5.8 ± 0.4 87 6.2 ± 0.2 100 This course uses appropriate online resources and technologies to help me achieve its learning
outcomes 6.5 ± 0.2 100 5.7 ± 0.4 87 6.3 ± 0.2 96
This course uses methods of assessment that help me achieve its learning outcomes 6.2 ± 0.2 100 5.7 ± 0.4 93 6.4 ± 0.1 100 This course helps me to develop my thinking skills (e.g. problem solving, critical analysis) 6.1 ± 0.7 93 5.7 ± 0.2 100 6.3 ± 0.2 96 This course has a learning environment that takes into account student diversity 6.1 ± 0.4 93 5.9 ± 0.2 86 6.2 ± 0.3 96 My learning in this course is supported by effective feedback 6.1 ± 0.4 93 5.9 ± 0.3 93 6.4 ± 0.2 96 Overall, I am satisfied with the quality of this course 6.1 ± 0.3 ab 93 5.5 ± 0.4 b 87 6.5 ± 0.2 a 96
a Evaluations based on 7-point Likert scales; %BA = % Broad Agreement (i.e. % of scores between 5 and 7 on the Likert scale or ‘in agreement’) b SELT response rates
104
LMS data indicated learning interactives were accessed by the majority of students (i.e. by up to 89% of students), with the grapevine anatomy and grape growth cycle interactives being the most accessed resources at 3.7 and 3.8 views per student, respectively. In contrast, only 13 students accessed the winemaking interactive and there were fewer (2.5) views per student for the winemaking interactive. Nevertheless, qualitative SELT responses suggested students valued the digital learning resources provided to support lecture content, with several students making reference to these in response to the course SELT question ‘What are the best aspects of this course and why?:
The online forum and the interactive quizzes provided are very helpful;
…the variety of the learning environment.
The most attractive aspect for me is to practice by myself.
…fantastic learning environment and different methods of teaching…
…a very good online production of the Yalumba winery. I found it interesting and informative… great introduction to a commercial winery with lots of stuff I haven't seen. For me the nursery video was the most interesting.
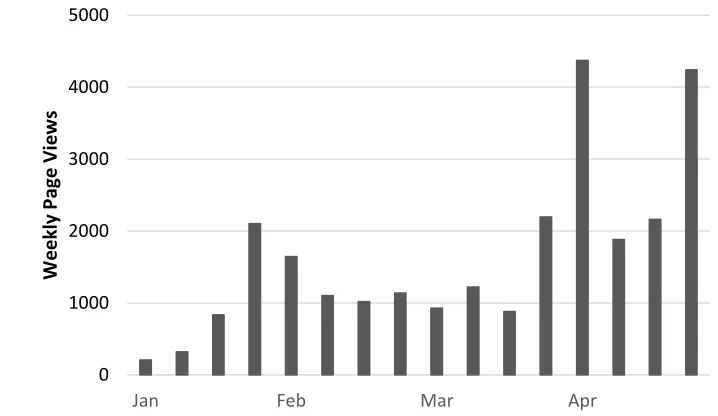
LMS data indicated that course announcements, the case study assignment and discussion boards were the most highly viewed pages, with an average of 12.6, 12.4 and 15.9 views per student, respectively. A small proportion of students chose not to access course announcements (10%), the case study (20.8%) and discussions (24.5%). Not surprisingly, the most highly accessed page (96.7%) in the FWS course was the grades page; with an average of 19.4 views per student. Since students were regularly checking course announcements, this proved an effective way to communicate important information to students; for example posting reminders about assessment tasks, due dates and/or feedback. For the assessment items for which feedback was provided to students online in a written format (i.e. for practical reports and the sensory exam), 21.5% of students viewed feedback on practical reports, whereas a higher proportion of students accessed feedback following the sensory exam (38%). The number of students viewing feedback may have been higher if a specific reminder had been sent to students (i.e. via an announcement or discussion board post, which were highly viewed). In this way, learning analytics can be used to enable teaching staff to identify when students are most active in the course, and therefore, when they might be most receptive to receiving guidance, remediation or feedback on assessment tasks.
105
Figure 4: Student activity within Canvas for Foundations of Wine Science, by date.
Phillips and colleagues studied the frequency with which students accessed Lectopia lecture recordings to identify different student usage behaviours, for example, conscientious students accessed content regularly, good-intentioned students had some regular access at the beginning and/or end of a study period, bingers accessed content in dedicated blocks, while crammers left engagement until just prior to examinations (Phillips et al., 2010). In the current study, LMS activity for individual students was not considered, although it is available and could similarly be used to profile students’ study behaviour in more detail.
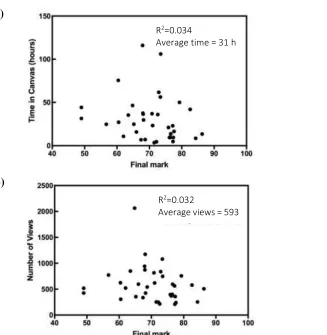
Instead, student success (i.e. the final grade achieved) was compared with time spent in the LMS platform and the total number of page views (Figure 5), but no correlations were observed (i.e. R2≤0.034). This was in agreement with previous reports that suggest that the highest levels of participation do not correlate with the best results, and that sometimes the most engaged students appear to be weaker but work hard to improve their performance (Sclater, Peasgood, & Mullan, 2016).
On average, students spent 31 ± 5 hours online for FWS. Students may have chosen to download course materials, e.g. video lectures or lecture notes, allowing them to study offline, but course analytics suggest many students accessed content directly via Canvas. The majority of students who achieved grades within the range of 60-80 were spending <50hrs online with between 100-700 page views (data not shown).
0 1000 2000 3000 4000 5000
Jan Feb Mar Apr
W
ee
kly
Pa
ge
Vi
e
w
106 a)
b)
Figure 5: Relationships between final course grade and a) time spent in Canvas or b) total number of page views.
Evaluating use of Discussion Boards.
Discussion boards were introduced to FWS in 2017, to enable students to engage with the lecturer, given implementation of online delivery via video lectures removed opportunities for face-to-face interaction, for example to seek clarification pertaining to course content. Often instigated by the lecturer, a total of 24 posts were made to the discussion board with 82% of students viewing the discussion board. However, only three students (2 international and 1 domestic, of credit to distinction standard) were responsible for 67% of posts; with the majority of students (76%) ’lurking’ in the discussion board, for a total of 155 page views of posts on the discussion board. Although only three students actively contributed to the discussion board, many students found the discussion forum useful as a tool for their learning; i.e. by checking what has been posted by others and/or the lecturer, to clarify their own thoughts. The fact that posts were not anonymous may also have impacted the willingness of students to post their questions and identity (Roberts & Rajah-Kanagasabai, 2014). Discussion boards are an important tool for courses where there are high numbers of ESL students as they may prefer to post questions rather than verbalise them in a face-to-face setting in front of their peers (Campbell, 2007).
Conclusions
The learning analytics indicate that FWS students have a range of different learning preferences, with the majority of students seeming to prefer text-based resources. This was not surprising, given student demographics; i.e. that the course comprises mainly international
R2=0.034
Average time = 31 h
R2=0.032
107
students with English as a secondary language. Course design should therefore consider the student demographic, and ideally, present information in a variety of ways so as to appeal to different learning styles and abilities, with the provision of additional resources that further support student learning. International students are often faced with learning situations that are compounded by a lack of knowledge and understanding of the teaching culture, which can create misunderstandings. These misunderstandings can be exacerbated in online environments due to the lack of social context and communication (Tan, Nabb, Aagard, & Kim, 2007).
LMS data indicated a significant proportion of students ‘lurked’ in the discussion board, where they gained insight from questions posed by their peers, and the responses from teaching staff, without posting questions themselves. The discussion board may have been utilised by students who were not ‘pacing and spacing’ their learning, i.e. students who did not allow time to reflect on, or to develop their understanding of concepts. In this way, students engaged with content by reading discussion forum posts. One drawback of the discussion board in the Canvas LMS was the in-ability to make anonymous posts, which may have deterred students from posting their comments or ideas. Anonymity can be important for students who are too shy to ask questions, who have learning difficulties or for ESL students. Previous studies have reported that students are more likely to contribute to discussion boards when anonymous postings are allowed (Sullivan, 2002; Miyazoe & Anderson, 2011; Roberts & Rajah-Kanagasabai, 2013).
The differences observed in SELT scores for course organisation and quality in 2016 and 2017 can likely be attributed to the quality of video lectures (compared to audio recordings), the change of LMS from Blackboard to Canvas (facilitating more convenient access to learning materials) and the provision of additional learning materials for students, e.g. learning interactives, which may have eased the workflow for some students. The learning analytics obtained from the Canvas LMS provided insight into how and when students engaged with online resources, for example, FWS students’ preference for text-based content over audio recordings. The quality of content delivered in an online learning environment influences student engagement. Video lectures should be short, ideally <10 mins in duration, with the virtual presence of the teacher to encourage the connection between the student and teacher. Virtual presence is particularly important for ESL students, where body language and facial expression can provide context that helps with understanding the language. Studies have shown that there is a relationship between ‘instructor presence and perceived student satisfaction with their online course experience’ (Ladyshewsky, 2013). The findings from this study will now be used to inform changes in course design and delivery, in particular, the way in which teaching staff interact with students in the online environment, to enhance the overall learning experience for students enrolled in future iterations of the course. These findings, and learning analytics more broadly, can also be used by others to inform their own learning and teaching practices.
References
Arnold, K. E., & Pistilli, M. D. (2012). Course signals at Purdue: Using learning analytics to increase student success. In S. B. Shum, D. Gasevic & R. Ferguson (Eds.), Proceedings of the 2nd International Conference on Learning Analytics and Knowledge. (pp. 267-270). Vancouver, Canada New York, USA: ACM. doi:10.1145/2330601.2330666
Brame, C. J. (2016). Effective educational videos: Principles and guidelines for maximizing student learning from video content. CBE Life Sciences Education 15(4), es6. doi:10.1187/cbe.16-0300125
Campbell, N. (2007). Bringing ESL students out of their shells: Enhancing participation through online discussion. Business and Professional Communication Quarterly,70(1), 37-43. doi:
108
Ladyshewsky, R. K. (2013). Instructor presence in online courses and student satisfaction. International Journal for the Scholarship of Teaching and Learning, 7(1), 1-23.
Littlejohn, A., & Pegler, C. (2007). Preparing for blended e-learning. Abingdon, UK: Routledge. Miyazoe, T., & Anderson, T. (2011). Anonymity in blended learning: Who would you like to be? Educational Technology and Society, 14(2), 175-187.
Phillips, R., Preston, G., Roberts, P., Cumming-Potvin, W., & Gosper, M. (2010). Using academic analytic tools to investigate studying behaviours in technology-supported learning environments. In Proceedings of the 27th Australian Society for Computers in Learning in Tertiary Education: Curriculum, Technology and Transformation for an Unknown Future. Sydney, Australia (pp. 761-771). ASCILITE
Phillips, R., Maor, D., Cumming-Potvin, W., Roberts, P., Herrington, J., Preston, G., Moore, E., & Perry, L. (2011). Learning analytics and study behavior: A pilot study. In G. Williams, P. Statham, N. Brown, & B. Cleland (Eds.), Proceedings of the 28th Annual Conference of the Australian Society for Computers in Learning in Tertiary Education: Changing Demands, Changing Directions (pp. 997-1007). Hobart, Australia: ASCILITE.
Ramburth, P., & McCormick, J. (2001). Learning diversity in higher education: A comparative study of Asian international and Australian students. Higher Education, 42, 333-350.
Roberts, L. D., & Rajah-Kanagasabai, C. J. (2014). “I’d be so much more comfortable posting anonymously”: Identified versus anonymous participation in student discussion boards. Australasian Journal of Educational Technology,29(5), 612-625. doi: 10.14742/ajet.452
Sclater, H., Peasgood, A., & Mullan, J. (2016). Learning analytics in higher education: A review of UK and international practice. Jisc, Bristol, UK.
Siemens, G. (2012). Learning analytics: Envisioning a research discipline and a domain of practice. In S. B. Shum, D. Gasevic & R. Ferguson (Eds.), Proceedings of the 2nd International Conference on Learning Analytics and Knowledge (pp. 4-8). Vancouver, Canada, New York, USA: ACM.
doi:10.1145/2330601.2330605
Sullivan, P. (2002). “It’s easier to be yourself when you are invisible:” Female college students discuss their online classroom experiences. Innovative Higher Education, 27(2), 129-144.
Tan, F., Nabb, L., Aagard, S., & Kim, K. (2010) International ESL graduate student perceptions of online learning in the context of second language acquisition and culturally responsive facilitation. Adult Learning,
21(1-2), 9-14.