ISSN 2324-805X E-ISSN 2324-8068 Published by Redfame Publishing URL: http://jets.redfame.com
Use of Video and Audio Texts in EFL Listening Test
Ahmet Başal1, Kaine Gülözer2, İbrahim Demir3 1School of Education, Yildiz Technical University, İstanbul, Turkey
2School of Foreign Languages, Yildiz Technical University, İstanbul, Turkey 3Department of Statistics, Yildiz Technical University, İstanbul, Turkey
Correspondence: Ahmet Başal, School of Education, Department of Foreign Languages Education, Davutpasa Campus, 34220, Esenler, İstanbul, Turkey
Received: August 3, 2015 Accepted: August 20, 2015 Online Published: August 27, 2015
doi:10.11114/jets.v3i6.1001 URL: http://dx.doi.org/10.11114/jets.v3i6.1001
Abstract
The study aims to discover whether audio or video modality in a listening test is more beneficial to test takers. In this study, the posttest-only control group design was utilized and quantitative data were collected in order to measure participant performances concerning two types of modality (audio or video) in a listening test. The participants, first grade students from an ELT program, were recruited and randomly assigned to two groups: audio-only text (AOT) (n=30) and video-only text (VOT) (n=27). Audio-only text (AOT) and video-only text (VOT) posttests were administered to the two randomly selected groups. Based on the results, the spread of the scores was wide in the post tests. In a nutshell, apart from texts 1 and 2, the AOT group performed significantly higher than the VOT group, despite the visual elements of the video. When considered all twenty items of the four texts, the significant difference found indicates that the audio modality was more favorable. This study examined differences in the effects of video listening text or audio-only listening text in terms of their effect on L2 test-taker performance. The quantitative results showed significantly higher success for AOT test takers. In other words, a consistent pattern presented in the listening comprehension test towards audio modality. However, the findings of the current research are not conclusive since various elements may have affected the outcome, such as motivation, physical factors, and topic familiarity, note-taking habits, and initial preference for audio or video. Therefore, further empirical research comparing AOT and VOT listening comprehension assessments is suggested to take into account these variables.
Keywords: assessment, English language teaching, listening comprehension, listening tests, video and audio modalities
1. Introduction
Recent developments concerning the importance of listening skill and language testing have been highlighted in a range of studies (Hsiao, Chang, Lin, Chen, Wu, & Lin, 2014; Taylor & Geranpeyah, 2011; Vandergrift, 2006). Listening plays “a vital role in the language acquisition process” (Brett, 1997, p. 39) and is without a doubt “the most fundamental skill” (Oxford, 1993, p. 205). However, learners think that listening is difficult; based on the literature, a host of complex factors such as rate of speech, prosody, accent, phonology, hesitations, background knowledge, and rhetorical signaling cues can influence listening comprehension (Cross, 2011; Graham, 2006; Ockey, 2007). Therefore it is important for language learners to improve their listening skills.
The importance attached to listening skill appears in many theories regarding second language acquisition (Krashen, 1985). However, compared to other skills, listening is the least researched (Nation & Newton, 2009; Vandergrift, 2004, 2007). In line with this, Feak and Salehzadeh (2001) have indicated that “video in any kind of listening assessment, whether placement or otherwise, remains largely unexplored and is not well understood” (p. 481). Although the notion is surprising, this lack of understanding may result from the very nature of listening. Vandergrift (1999) describes this difficulty:
In the field of teaching English as a foreign language, videos are especially used for developing listening skills. Sources available to language teachers have increased significantly with the expansion of the Internet (e.g., YouTube, ted.com). English language teachers throughout the world incorporate movies, soap operas, and television programs in their classrooms because videos include both aural and visual information (Canning-Wilson, 2000). Such videos stimulate learners and facilitate the process of language learning (Çakır, 2006; Wagner, 2010a). Moreover, “video offers foreign and second language learners a chance to improve their ability to understand comprehensible input” (Canning-Wilson, 2000, Conclusion section, para. 1).
In parallel with developments in technology, video use in language teaching environments for improving listening comprehension has been on the rise (O’Bryan & Hegelheimer, 2007). This is a fairly understandable approach, since videos have distinct advantages for improving listening abilities. Video has the power to make listening more authentic by presenting context, discourse, paralinguistic features, and culture (Coniam, 2001). These non-verbal clues, complementary to aural input, may help listeners understand better.
Videos may be used in an English language teaching context for a range of reasons (cited in Suvorov, 2009, p. 54):
1. Seeing a situation and its participants while listening enhances situational and interactional authenticity, which may aid comprehension (Buck, 2001; Wagner, 2007).
2. Body language, facial expressions, and gestures of a speaker provide additional information to the listener (Buck, 2001; Coniam, 2001; Ockey, 2007; Rubin, 1995).
3. With visual input, a listener can more easily identify the role of a speaker and the context of a situation (Baltova, 1994; Gruba, 1997; Rubin, 1995).
4. Visual elements can activate a listener’s background knowledge (Ockey, 2007; Rubin, 1995)
Although various advantages of video use for improving listening comprehension are listed in the literature, research on the utilization of videos in assessing listening comprehension is quite sparse. Moreover, few studies have demonstrated how video use can promote the learning of foreign languages (Canning-Wilson, 2000). In other words, “while video is commonly employed in L2 classrooms, test developers have been reluctant to use video texts on tests of L2 listening ability” (Wagner, 2010a, p. 495). Concerns include not watching or disregarding videos (Bret, 1997; Gruba, 1999), assessing aspects other than aural input (Buck, 2001), and the distracting effects of videos (Ockey, 2007; Rost 2002). These issues should be taken into account when videos are included in the assessment of listening comprehension.
In the literature, contradictory views have been reported about the use of videos in listening tests. Shin (1998) found that when videos were used to assess listening, participants performed significantly better compared to an audio test group. Moreover, most (92%) test takers preferred listening assessment videos to audio (Progosh, 1996). On the other hand, Londe (2009) compared performances of test takers in two video formats (close-up of the lecturer's face and a full body view of the lecturer) against test takers in an audio-only format and found no significant differences between the three groups. The researcher claimed that the visual channel did not contribute to test-taker performance.
The current study investigated the role of videos on an ESL listening test. In particular, the study examined students’ performance on two parts of the listening test: one accompanied by a video and one audio-only. The following research question guided the study:
1. Is there a statistically significant difference between the test scores of the video listening text group and the audio-only listening text group?
2. Method
2.1 Research Design
In this study, the posttest-only control group design (Cresswell, 2009) was utilized and quantitative data were collected in order to measure participant performances concerning two types of modality (audio or video) in a listening test. Audio-only text (AOT) and video-only text (VOT) post-tests were administered to the two randomly selected groups in order to answer the research question of whether there are any significant differences between the post-test scores of AOT and VOT groups, representing the quantitative side of the study.
2.2 Participants
B1-B2 were selected to take the four concurrent listening tests. No listeners demonstrated hearing problems, and none of them had visited any English speaking countries before. Table 1 shows a summary of participant data with regard to age, gender, and distribution by listening modality.
Table 1. Summary of Participant Data
Listening Modality Gender Average Age Total
Male Female
AOT 7 (25.9%) 20 (74%) 20 27
VOT 13 (43.3 %) 17 (56.6%) 20 30
2.3 Instruments
The chosen topics for AOT and VOT listening comprehension were extracted from Practice for Academic Lectures: Volume 1 and video recorded. The same recordings were used for both groups by splitting the video from the audio. Topics included the analogy of an iceberg, American culture, semiotics, and language learning. These topics were selected because they met Field’s (2004) suggestions of top-down and bottom-up processes and represented topics English language teacher candidates would likely encounter, such as linguistics, speaking, and reading. Furthermore, the questions in the listening text typically represented question types used to assess language learner linguistic competence (Buck, 2001). Each of the four AOT and VOT listening comprehension tasks included five multiple choice question items from the same book prementioned. The table below shows the representation of one topic for question types for both audio and video modalities. The rest of the topics followed the same procedure in relation to the question types and modalities.
Table 2. Topics of the Texts and Modalities
Topics Questions Modality (Audio only Text,-AOT, Video only Text -VOT)
Analogy of an iceberg 1,2,3,4,5 AOT & VOT
American Culture 1,2,3,4,5 AOT & VOT
Semiotics 1,2,3,4,5 AOT & VOT
Language Learning 1,2,3,4,5 AOT & VOT
In order to assess the internal validity of the four listening comprehension tasks beyond researcher agreement, two other L2 listening instructors’ confirmed the text. A set of audio and video recordings was prepared for each task by the researchers to ensure the best possible sound with a medium rate of speech delivery (130 wpm); these recordings were pilot tested with four ELT students who were excluded from the main study.
2.4 Data Analysis and Procedure
The test was administered to the participants of the groups in two sessions. The recruited listeners sat in front of a PC in a computer lab with a headset. They also completed a pen-and-paper demographics questionnaire. In the AOT group, instructions were clearly explained by the researchers. They were asked to read the set of questions and answers before listening to the corresponding recording. Participants listened to each task twice and were given about three minutes to answer questions. The rest of the test was administered in the same manner. In total, the test lasted 30 to 40 minutes. The same procedure was employed in the VOT group, except that the test takers also watched videos.
The test had four topics, each of which included five multiple choice questions, rewarding one point for each correct answer. The highest score for both AOT and VOT tasks was 20. Because the answers were definite, no partial points were awarded; blank and incorrect responses received a score of zero. The test was piloted with six students who were excluded from the main study. To determine consistency and stability of the values within the four topics, coefficient alpha reliability analysis was conducted and preferable levels of internal consistency were observed (post-test Cronbach’s alpha: .84, .83, .83, .81).
3. Findings
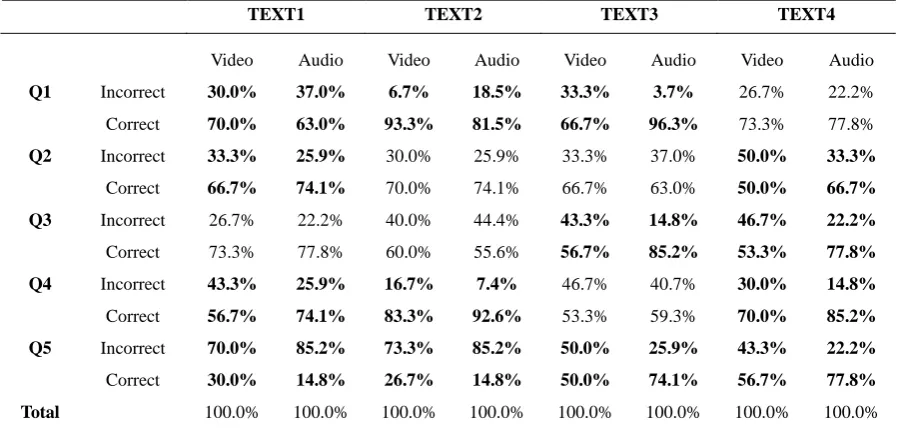
listening text 4, the AOT group had higher scores on all questions.
Table 3. Scores Related to Questions of Each Text
TEXT1 TEXT2 TEXT3 TEXT4
Both AOT and VOT participants’ scores were statistically analyzed to identify differences between the texts and the number of correct answers given. After confirming normal distribution of data, an independent t-test was conducted and the total number of correct answers for both groups was determined.
In listening texts 1 and 2, no significant difference was found between the groups in relation to participants’ scores (AOT: t = -.2903, df = 55, p > 0.05; VOT: t = .5070, df = 55, p > 0.05). However, a statistically significant difference was found between the groups for text 3 (t = -2.6986, df = 55, p < 0.05), where the average score of the AOT group was higher by nearly a full point. Additionally, a significant difference was found for text 4 (t = -3.0477, df = 55, p < 0.05), where the average score was again almost 1 point higher for the AOT group. In general, when considering all 20 items, a statistically meaningful difference was discovered (t = -2,1695, df = 55, p > 0.05), indicating that the audio delivery was more favorable. Out of 16 assessed responses, VOT participants answered 12 correctly, while AOT participants answered 14.
Table 4. Overview Analysis of Scores of Audio and Video Groups
N Mean Std. Deviation df t P Text1 Video 30 2.967 .8503 55 -.2903 .773
Audio 27 3.037 .9799
Text2 Video 30 3.333 1.0283 55 .5070 .614 Audio 27 3.185 1.1779
Text3 Video 30 2.933 .9444 55 -2.6986 .009 Audio 27 3.778 1.3960
Text4 Video 30 3.033 .9994 55 -3.0477 .004 Audio 27 3.852 1.0267
Total Video 30 12.27 2.116 55 -2.1695 .034 Audio 27 13.85 3.325
*Statistical significance level (P < 0.05)
4. Discussion
This study examined differences in the effects of video listening text or audio-only listening text on L2 test-taker performance.
The research question asked, “Is there a statistically significant difference between the test scores of the video listening text group and the audio-only listening text group?” Apart from texts 1 and 2, the AOT group performed significantly higher than the VOT group, despite the visual elements of the video. This result can be attributed to the three factors
Video Audio Video Audio Video Audio Video Audio
Q1 Incorrect 30.0% 37.0% 6.7% 18.5% 33.3% 3.7% 26.7% 22.2%
Correct 70.0% 63.0% 93.3% 81.5% 66.7% 96.3% 73.3% 77.8%
Q2 Incorrect 33.3% 25.9% 30.0% 25.9% 33.3% 37.0% 50.0% 33.3%
Correct 66.7% 74.1% 70.0% 74.1% 66.7% 63.0% 50.0% 66.7%
Q3 Incorrect 26.7% 22.2% 40.0% 44.4% 43.3% 14.8% 46.7% 22.2%
Correct 73.3% 77.8% 60.0% 55.6% 56.7% 85.2% 53.3% 77.8%
Q4 Incorrect 43.3% 25.9% 16.7% 7.4% 46.7% 40.7% 30.0% 14.8%
Correct 56.7% 74.1% 83.3% 92.6% 53.3% 59.3% 70.0% 85.2%
Q5 Incorrect 70.0% 85.2% 73.3% 85.2% 50.0% 25.9% 43.3% 22.2%
Correct 30.0% 14.8% 26.7% 14.8% 50.0% 74.1% 56.7% 77.8%
proposed by Taylor and Garenpayeh (2011), especially external contextual factors and individual characteristics. Test takers may have been distracted by the images, and not all students may have understood the content, even though their language proficiency was similar. Internal cognitive factors may also have played a role in test-taker performance via a loading effect while processing information.
Study results are contradictory with the findings of several other studies, including Progosh (1996), who found that most participants (92%) preferred video quizzes over audio ones, and Shin (1998) and Sueyoshi and Hardison (2005), who both found that video groups outperformed audio groups. Meanwhile, Londe (2009) found no significant differences in terms of performance between three groups tested with two video formats (close-up of the lecturer's face and full body view of the lecturer) and an audio-only format. Similarly, Gruba (1993) found no significant differences between video and audio-only groups in terms of performance. Results of the current study are in line with the findings of Ockey (2007) and Bejar, Douglas, Jamieson, Nissan, and Turner (2000), who indicated that video provided little help with comprehension. Ockey (2007) further stated that moving images were helpful to half of the test takers, while the rest found videos distracting. Although Ockey’s sample size was only six students, it is nevertheless worthwhile to consider such individual variations. In the present study, both the audio and video presentations were lectures, which might have affected the grasping of clues. However, if audio lectures function well in a listening test, the video modality might be a necessary precursor for instructional purposes.
A statistically meaningful difference was found when considering all twenty items of the four texts (t = -2.1695, sd = 55, p > 0.05), which indicates that the audio modality was more favorable. In relation to the total number of correct answers, while the VOT group answered 12 correctly, the AOT group answered 14. This result presents some evidence in favour of the audio modality, which parallels Wagner (2010b), who found a negative correlation between video viewing rates with listening test performance. He attributed this weak correlation to the distracting elements of video, though he noted that videos might decrease anxiety on the part of test takers. Moreover, he claims that watching a video during a listening task might result in missing crucial information for the test.
The scores of the first two texts provide limited evidence to support the superiority of the audio modality, possibly because the topics were challenging. As Shin (2012) noted, item difficulty might prompt different judgments while answering questions. Synthesis and analysis questions are especially problematic, because test takers might need in-depth understanding. In addition, some items meant to test top-down processing prompted bottom-up processing and vice versa. These results are not entirely surprising. As Leeser (2004) has argued, topic familiarity and pauses might affect test taker performance. Of the four topics in our test, the analogy of an iceberg and discussion of American culture might have been less familiar than semiotics and language learning. Furthermore, test takers were not allowed to pause while listening; they were required to listen to each text twice with no breaks and were allowed five minutes to finalize their answers. Incorporating pauses might have an effect on performance by changing the way test takers process linguistic information.
5. Conclusion
This study investigated test-taker performance within the modalities of AOT and VOT. The quantitative results showed significantly higher success for AOT test takers. In other words, a consistent pattern presented in the listening comprehension test towards audio modality. However, the findings of the current research are not conclusive concerning the use of AOT over VOT as an assessment tool in listening comprehension; various elements may have affected the outcome, such as motivation, physical factors, and topic familiarity. Besides, other factors that may have affected results exceeded the scope of the current study, such as pausing, note-taking habits, and initial preference for audio or video. Therefore, these variables should be taken into consideration in future research comparing AOT and VOT listening comprehension assessments. Further empirical research with a larger sample size is also suggested to examine the impact of both modalities on comprehension of various text types, such as dialogues, lectures, and authentic listening.
References
Bejar, I., Douglas, D., Jamieson, J., Nissan, S., & Turner, J. (2000). TOEFL 2000 listening framework: A working paper (TOEFL Monograph Series Report No. 19). Princeton, NJ: Educational Testing Service.
Brett, P. (1997). A comparative study of the effects of the use of multimedia on listening comprehension. System, 25, 39-53. http://dx.doi.org/10.1016/S0346-251X(96)00059-0
Buck, G. (2001). Assessing listening. Cambridge: Cambridge University Press. http://dx.doi.org/10.1017/CBO9780511732959
Çakır, İ. (2006). The use of video as an audio-visual material in foreign language teaching classroom. The Turkish Online Journal of Educational Technology, 5(4), Article 9.
6(11).
Coniam, D. (2001). The use of audio or video comprehension as an assessment instrument in the certification of English language teachers: A case study. System, 29, 1-14. http://dx.doi.org/10.1016/S0346-251X(00)00057-9
Creswell, J. (2009). Research design: Qualitative, quantitative, and mixed methods approaches (3rd ed.). London, UK: Sage.
Cross, J. (2011). Comprehending news videotexts: The influence of the visual content. Language Learning & Technology, 15(2), 44-68.
Feak, C. B., & Salehzadeh, J. (2001). Challenges and issues in developing an EAP video listening placement assessment: A view from one program. English for Specific Purposes, 20, 477-493. http://dx.doi.org/10.1016/S0889-4906(01)00021-7
Field, J. (2004). An insight into listeners’ problems: Too much bottom-up or too much top-down? System, 32, 363-377. http://dx.doi.org/10.1016/j.system.2004.05.002
Graham, S. (2006). Listening comprehension: The learners’ perspective. System, 34(2), 165–182. http://dx.doi.org/10.1016/j.system.2005.11.001
Gruba, P. (1993). A comparison study of audio and video in language testing. JALT Journal, 15, 85-88.
Gruba, P. (1999). The role of digital video media in second language listening comprehension (Unpublished doctoral
dissertation). University of Melbourne, Australia.
https://minerva-access.unimelb.edu.au/bitstream/handle/11343/38784/65885_00000244_01_Gruba.pdf
Hsiao, H. S., Chang, C. S., Lin, C. Y., Chen, B., Wu, C. H., & Lin, C. Y. (2014). The development and evaluation of listening and speaking diagnosis and remedial teaching system. British Journal of Educational Technology, 1–18. http://dx.doi.org/10.1111/bjet.12237
Krashen, S. (1985). The input hypothesis. London, England: Longman.
Leeser, M. J. (2004). The effects of topic familiarity, mode an pausing on second language learners’ comprehension and focus on form. Studies in Second Language Acquisition, 26(4), 587-615. http://dx.doi.org/10.1017/S0272263104040033
Londe, Z. C. (2009). The effects of video media in English as a second language listening comprehension tests. Issues in Applied Linguistics, 17, 41–50.
Nation, L. S. P., & Newton, J. (2009). Teaching ESL/EFL listening and speaking. London, England: Routledge.
O’Bryan, A., & Hegelheimer, V. (2007). Integrating CALL into the classroom: The role of podcasting in an ESL listening strategies course. European Association for Computer Assisted Language Learning, 12(2), 162-180. http://dx.doi.org/10.1017/S0958344007000523
Ockey, G. (2007). Construct implication of including still image or video in computer-based listening tests. Language
Testing, 24, 517–537. http://dx.doi.org/10.1177/0265532207080771
Oxford, R. L. (1993). Research update on teaching listening. System, 21(2), 205-211. http://dx.doi.org/10.1016/0346-251X(93)90042-F
Progosh, D. (1996). Using video for listening assessment: Opinions of test takers. TESL Canada Journal, 14(1), 34–41.
Rost, M. (2002). Teaching and researching listening. London, England: Pearson Education.
Shin, D. (1998). Using videotaped lectures for testing academic listening proficiency. International Journal of Listening, 12(1), 57–80. http://dx.doi.org/10.1080/10904018.1998.10499019
Sueyoshi, A., & Hardison, D. (2005). The role of gestures and facial cues in second language listening comprehension. Language Learning, 55, 661-699. http://dx.doi.org/10.1111/j.0023-8333.2005.00320.x
Suvorov, R. (2009). Context visuals in L2 listening tests: The effects of photographs and video vs. audio-only format. In C. A. Chapelle, H. G. Jun, & I. Katz (Eds.), Developing and evaluating language learning materials (pp. 53–68). Ames: Iowa State University.
Taylor, L., & Geranpayeh, A. (2011). Assessing listening for academic purposes: Defining and operationalizing the test construct. Journal of English for Academic Purposes, 10, 89-101. http://dx.doi.org/10.1016/j.jeap.2011.03.002
Vandergrift, L. (2004). Listening to learn or learning to listen? Annual Review of Applied Linguistics, 24, 3-25. http://dx.doi.org/10.1017/S0267190504000017
Vandergrift, L. (2006). Second language listening: Listening ability or language proficiency? The Modern Language Journal, 90, 6-18. http://dx.doi.org/10.1111/j.1540-4781.2006.00381.x
Vandergrift, L. (2007). Recent developments in second and foreign language listening comprehension research.
Language Teaching, 40(3), 191-210. http://dx.doi.org/10.1017/S0261444807004338
Wagner, E. (2010a). How does the use of video texts affect ESL listening test-taker performance? Language Testing, 27(4), 493-510. http://dx.doi.org/10.1177/0265532209355668
Wagner, E. (2010b). Test-takers’ interaction with an L2 video listening test. System, 38, 280-291. http://dx.doi.org/10.1016/j.system.2010.01.003