Content Analysis of Information Technology in Biomedicine
Ms Sujata Pratapure
1Prof. Vaishali. Khaparde
2
Abstract
Content analysis is a widely used qualitative research technique. Content analysis of articles published in International Journal of Information Technology in Biomedicine from 2012 to 2007 is carried out in all there are 599 articles published in six years. The total number of author contributions of this study is 1442 & the maximum authors are from USA. The highest number of (CLS) Current Literature survey is 22.
1. Introduction
The content analysis is regarded as an important technique of obtaining facts which is used for the purpose of studying political, social, economical & business problems. The research conducted by this method is considered more reliable. The basic goal of content analysis is to take a verbal, on-quantitative document & transform it into on-quantitative data. The result of content analysis can generally be presented in tables containing frequencies or percentage, in the same manner as survey data. Content analysis was first used by student of journalism to study the content of American newspaper. The use of content analysis in the social sciences-today its method & its sciences –today its method & its problems of interpretation has been affected both by related developments in other fields & by historical demands for certain practical application.
1. Types of Content Analysis
There are two general categories of content analysis: conceptual analysis and relational analysis. Conceptual analysis can be thought of as establishing the existence and frequency of concepts in a text. Relational analysis builds on conceptual analysis by examining the relationships among concepts in a text.
Conceptual Analysis
In conceptual analysis, a concept is chosen for examination and the number of its occurrences within the text recorded. Because terms may be implicit as well as explicit, it is important to clearly define implicit terms before the beginning of the counting process. To limit the subjectivity in the definitions of concepts, specialized dictionaries are used.
Relational Analysis
Relational analysis builds on conceptual analysis by examining the relationships among concepts in a text.
1
Research Student, Dept. of Library & Information Science, Dr.Babasaheb Ambedkar Marathwada University, Aurangabad. (MS)
2
And as with other sorts of inquiry, initial choices with regard to what is being studied and/or
coded for often determine the possibilities of that particular study. For relational analysis, it is important to first decide which concept type(s) will be explored in the analysis
2. Definitional Analysis
2.1 Content
Content means what a document contains. This idea of what contained in a document be it a book, a periodical or a newspaper.
2.2 Analysis
Needs, assessment getting information to solve problems in the corporation going out & seeking opinions on optimal actual feelings, causes & solutions.
2.3 Content Analysis
A systematic analysis of the content rather than the structure of a communication, such as a written work, speech, or film, including the study of thematic and symbolic elements to determine the objective or meaning of the communication.
2.4 Information Technology in Biomedicine
IEEE transactions on information Technology in Bio-medicine (ISSN-1089-7771) are published bio-monthly by the institute of electrical & electronic engineers. It delivers access to quality information on technical & professional issues in Biomedical engineering including the most highly cited journals in the field. The journal of the Information Technology in Bio-medicine published original research papers articles, notes, reviews & also papers on biomedical engineering. It covers bio-engineering, communication, networking & broadcasting, computing & processing, waves & electromagnetic, robotics & control system, signal processing & analysis.
3. Review of Literature
The research methods are divided into three broad categories, quantitative, and qualitative & participatory research method. These research methods have different approach, techniques & tools to conduct a research Collis 2009. Content analysis is the product of computer age. It dates back to 1940 when it became very credible and frequent research method. The researchers started to focus the concepts rather than the words or the relationships between them. (De Sola Pool, 1959)Content analysis is a multipurpose research method developed specifically for investigating any problem in which the content of communication serves as the basis of inference. Holsti(1969). The research technique which is used for the objective, systematic and quantitative description of manifest content of communications is called Content Analysis (Berelson, 1952). It is a type of research tool that focuses on the actual content and internal features of the problem or situation. Content analysis & coding interchangeably to refer to the objectively, systematic & quantitative description of any symbolic behavior. Weber (1990) Content analysis is classifies textual material by reducing it to more relevant manageable bits of data. Gorman & Peter, (2005).
4. Objectives
1. To discover the evolving subjects in journal of the Information Technology in Biomedicine. 2. To find out the authorship pattern.
5. To find out the volume wise authorship pattern of contributions.
5. Result & Discussion
Table No.1: Distribution of Articles According Subject Area Sr
no.
Subject Area No. of articles Total %
2012 2011 2010 2009 2008 2007
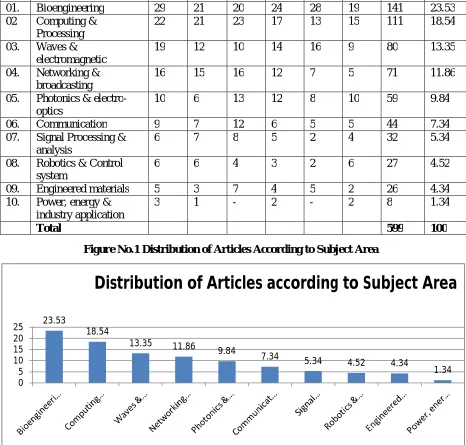
01. Bioengineering 29 21 20 24 28 19 141 23.53
02 Computing & Processing
22 21 23 17 13 15 111 18.54
03. Waves & electromagnetic
19 12 10 14 16 9 80 13.35
04. Networking & broadcasting
16 15 16 12 7 5 71 11.86
05. Photonics & electro-optics
10 6 13 12 8 10 59 9.84
06. Communication 9 7 12 6 5 5 44 7.34
07. Signal Processing & analysis
6 7 8 5 2 4 32 5.34
08. Robotics & Control system
6 6 4 3 2 6 27 4.52
09. Engineered materials 5 3 7 4 5 2 26 4.34
10. Power, energy & industry application
3 1 - 2 - 2 8 1.34
Total 599 100
Figure No.1 Distribution of Articles According to Subject Area
Table no.1 & fig no.1 covers distribution of papers according to subject areas out of 599 articles, there are only 10 subject areas. The highest number of the article i.e. 141 (23.53%) covers Bioengineering, which is followed by computing & processing i.e. 111 (18.54%).The lowest number of articles i.e. 8 (1.34%) of power, energy & industry application.
23.53
18.54
13.35 11.86
9.84 7.34
5.34 4.52 4.34
1.34 0
5 10 15 20 25
Table no.2: Authorship pattern of contributions
Sr no. No. of Author No. of contribution %
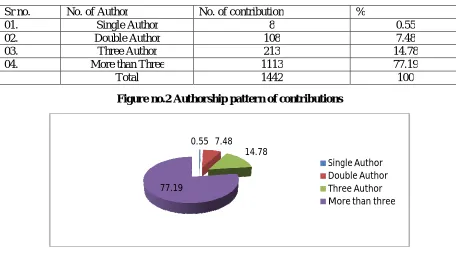
01. Single Author 8 0.55
02. Double Author 108 7.48
03. Three Author 213 14.78
04. More than Three 1113 77.19
Total 1442 100
Figure no.2Authorship pattern of contributions
Table no.2 & fig.no.2 shows that out of 1442 contributions 8 (0.55%) have been contributed by single author, 108(7.48%) by two authors, 213 (14.78%) by three author & 1113 (77.19%) has been contributed by more than three authors.
Table no.3: Volume wise distribution of Current literature Survey
Sr no. Month No. Of CLS
2012 2011 2010 2009 2008 2007 Total %
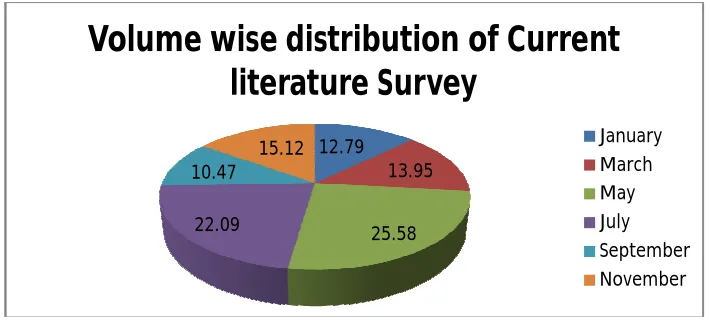
01.. January 3 2 3 1 2 - 11 12.79
02. March 2 3 4 - 1 2 12 13.95
03. May 3 1 5 6 4 3 22 25.58
04 July 4 4 3 2 1 5 19 22.09
05. September 2 2 1 - 2 2 9 10.47
06. November 1 3 2 5 1 1 13 15.12
Total 86 100%
0.55 7.48
14.78
77.19
Figure no.3 Volume wise distribution of Current literature Survey
Table no.3 & fig no.3 depicts the percentage of CLS is 86.The highest number of CLS is 22 (25.58%) in May. & lowest number of CLS is 9 (10.47%) in September.
Table no.4: Country Wise Distribution of Authors
Sr no. Place No. of Authors Percentage
01. USA 380 26.35
Orlando 71 18.68
Boston 48 12.63
Norman 42 11.05
Los Angles 37 9.73
Albuquerque 29 7.63
Spokane 27 7.10
Pittsburgh 25 6.57
Cambridge 22 5.78
San Fransico 21 5.72
Berkeley 5 1.31
Buffalo 6 1.57
New York 13 3.42
Dayton 11 2.78
Chicago 9 2.36
Houston 8 2.10
St.Louis 6 1.57
02. Greece 230 15.95
Athens 65 28.26
Thessaloniki 46 20
Patras 27 11.75
Ioannia 22 9.56
Lamia 37 16.09
Heraklion 33 14.34
03 Spain 124 8.59
Madrid 68 54.83
Valencia 42 33.83
Zaragoza 14 11.29
04. China 121 8.39
12.79
13.95
25.58 22.09
10.47 15.12
Volume wise distribution of Current
literature Survey
Shanghai 33 27.27
Macau 32 26.45
Beijing 27 22.31
Hong Kong 24 19.83
Tianjin 5 4.14
05. UK 84 5.82
London 37 44.04
Liverpool 31 36.91
Manchester 16 19.05
06 Australia 72 4.99
Melbourne 26 36.11
Sydney 22 30.56
Toowoomba 16 22.22
Canberra 8 11.11
07. Italy 68 4.71
Trento 21 30.88
Florence 16 23.53
Palermo 13 19.12
Milan 10 14.70
Bologna 8 11.77
08. Japan 65 4.54
Hiroshima 25 38.46
Ishikari 19 29.24
Toyota 21 32.30
09. Korea 60 4.16
Daejeon 29 48.33
Seoul 17 28.33
Seongnam 14 23.34
10. France 43 2.98
Lyon 23 53.48
Rennes 20 46.52
11. Canada 41 2.84
Varennes 29 100
12. Taiwan 32 2.21
Taichung 21 65.63
Taipel 11 34.37
13. Germany 24 1.66
Aachen 9 37.5
Hannover 7 29.16
Munich 3 12.5
Bochum 5 20.84
14. Cyprus 23 1.59
Nicosia 14 60.86
Paphos 9 39.14
15. Brazil 20 1.38
Sau Paulo 14 70.00
Campinas 6 30.00
Bengaluru 7 38.89
Kolkatta 6 27.77
New Delhi 5 33.34
17. Iran 15 1.04
Ahvaz 9 60.00
Yazd 6 40.00
18. Finland 14 0.98
Kajjani 11 78.57
Turku 3 21.43
19. Poland 8 0.58
Lublin 8 100
Figure No.4Country Wise Distribution of Authors
Table no.4 & fig no.4 shows that 1442 authors have contributed their articles for the International journal of Information Technology in Biomedicine in 2012-2007.maxium number of articles are contributed by USA authors i.e.380(26.35%) where as minimum no. of articles are contributed by Poland authors i.e.8 (0.58%). It proves that this journal gives preference to foreign authors.
0 5 10 15 20 25 30
USA Greece spain China UK Australia Italy Japan Korea France Canada Taiwan Germany Cprus Brazil India Iran Finland Poland
26.35 15.95
8.59 8.39 5.82 4.99 4.71 4.54 4.16 2.98 2.84 2.21 1.66 1.59 1.38 1.24 1.04 0.98 0.58
Table No.5 Volume Wise Authorship Pattern of Contributions
Sr no.
Vol.no. Contributions Of the one author
Contribution of two author
Contribution of three author
Contribution of > 3
Total %
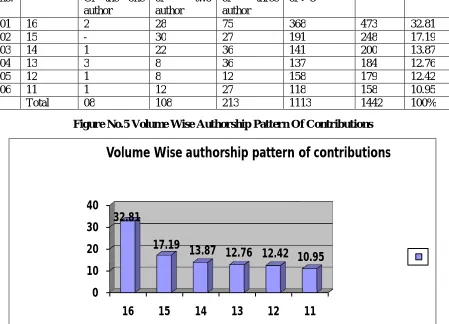
01 16 2 28 75 368 473 32.81
02 15 - 30 27 191 248 17.19
03 14 1 22 36 141 200 13.87
04 13 3 8 36 137 184 12.76
05 12 1 8 12 158 179 12.42
06 11 1 12 27 118 158 10.95
Total 08 108 213 1113 1442 100%
Figure No.5Volume Wise Authorship Pattern Of Contributions
Table no.5 & fig no.5 indicates that volume wise authorship pattern of contributions .Vol. no.16 contributions 473 (32.81%), Vol no.15 contributions 248 (17.19%),vol no.14 contributions 200 (13.87%),vol. no.13 contributions 184 (12.76%) & Vol. no.12 contributions 179 (12.42%) and Vol.no.11 contributions 158 (10.95%).
Conclusion
Content analysis helps the researcher to analyze the content of documents. It is observed in the present study that, the number of articles of source information Technology in Biomedicine has 599 articles in six years. The authorship pattern of articles shows that more than three authors contributed maximum than the others i.e.1113(77.19%) & single authored articles are lowest in number i.e 8 (0.55%).It was seen that the maximum numbers of authors are from USA.
0
10
20
30
40
16
15
14
13
12
11
32.81
17.19 13.87 12.76 12.42
10.95
References
Berlson .B(1952) Content analysis in Communication research, New York: Free Press.
Collis Ji. & Hussey,Roger (2009),Business research :a practical guide for undergraduate & postgraduate students;3rd ed.Basingstoke:Palgrave Macmillan 358.
De sola poll& Ithid (1959),Trends in Content Analysis:Urbad:University of Illinois Press.
Gorman,G. E. (2005),Quantitave research for the information professional.Faceet publishing.Londo,44. Holsti,O(1969), Content analysis for the social science & humanities reading MA Addison wisely,14 Jadhav Vandana & Khaparde V. S. Citation Analysis of Ph D theses on Physics submitted to Dr Babasaheb Ambedkar Marathwada University, Collnet Journal of Scientometrics and
Information Management. Vol. 5(1) June 2011, ISSN: 0973-7766.
Jadhav Vandana & Khaparde V. S . Citation Analysis of University News Journal, 8th International CALIBER - 2011, Goa University, Goa, March 02-04, 2011 © INFLIBNET
Khaparde V. S. (2011). E-journals in library and information science: A Bibliometric study. International journal of Humanities and Social Sciences. Vol. 1(11) Special Issue August 2011 Center for promoting Ideas, USA.
Khaparde V. S. (2011). Use of Internet by Research Scholars of Social Science Departments of Dr.Babasaheb Ambedkar Marathwada University, Aurangabad. International Journal of Humanities and Social Sciences. Vol. 1(10) August 2011, Center for promoting Ideas, USA. Khaparde V. S. Pattern of information use by researchers in library and Information Science.
International Journal of Humanities and Social Sciences. Vol. 1(12) September 2011 Center for promoting Ideas, USA.
Khaparde V. S. Use of Information by Library Science Professionals: A Bibliometric Study. British Journal of Humanities and Social Sciences. Vol. 1(2) October, 2011, London, United Kingdom, 78-90 ISSN 2048-1268.
Khaparde V. S. Bibliometric study of Electronic Journal of Academic and special Librarianship. British Journal of Humanities and Social Sciences. Vol. 1(2) October, 2011, London, United Kingdom, 33-43 ISSN 2048-1268.
Khaparde V. S. Information Usage of Biological Science Researchers of Dr. Babasaheb Ambedkar Marathwada University, Aurangabad. International Library Movement, Vol.33 (2) June, 2011, Holy Temple Library, Ambala, 64-71. ISSN 0970-0048.
Khaparde V. S. Digital Libraries in Knowledge Management and Status of Librarians In International Journal of Software Engineering and Technology, Vol. 3(3), March 2011, 124-128. ISSN: 0974- 973X (P) Online 0974- 9624.
Khaparde V. S. Knowledge Management and Library and Information Science Professionals. International Journal of Artificial Intelligent Systems and Machine Learning, March 2011.
Pratapure S.K.(2009);Content Analysis of journal of The Indian Chemical Society;Project report submitted to Dr. Babasaheb Ambedkar Marathwada University,Aurangabad.