Effect of developing flow and thermal regime on momentum
and heat transfer in micro-scale heat sink
Y. Mishan, A. Mosyak, E. Pogrebnyak, G. Hetsroni
*Department of Mechanical Engineering, Technion-Israel Institute of Technology, Haifa 32000, Israel
Received 28 August 2006 Available online 27 February 2007
Abstract
A developing micro-channel heat transfer and fluid flow has been investigated experimentally in rectangular micro-channels of
Dh= 440lm, having water as a working fluid. Infrared technique was used to design and built a micro-channel test section that
incor-porate internal fluid temperature measurements. The new method that provides information about the fluid temperature distribution inside the channel and provides validation for the methods used to determine the local and average Nusselt numbers. The experimental results have been compared with theoretical predictions from the literature and results obtained by numerical modeling of the present experiment. The experimental results of pressure drop and heat transfer confirm that including the entrance effects, the conventional the-ory is applicable for water flow through micro-channels.
These results differ from the conclusions of several researches. It was shown that data presented by some researches can be due to entrance effects. The present results highlight the importance of accounting for common phenomena that are often negligible for stan-dard flows such as accounting for profile of inlet velocity, axial heat conduction, effect of the design inlet and outlet manifolds.
This paper, to the best of knowledge, is the first presentation on the method of the bulk fluid temperature measurements along micro-channel using IR technique, and calculation of the local heat transfer coefficient based on the local heat flux and the local temperature difference between the heated wall and the bulk fluid temperature.
Ó2007 Elsevier Ltd. All rights reserved.
Keywords: Micro-channels; Laminar flow; Entrance effect; Axial conduction; Infrared technique; Pressure drop; Heat transfer
1. Introduction
One potential solution to thermal management of a chip is to attach a micro-channel heat sink to inactive (back) side of the chip. Usually in a close-loop arrangement, cool-ant such as water is pumped trough the micro-channels to remove the heat generated. Due to the small size of the micro-channels, the heat transfer coefficient is very high. In an early work by Tuckerman and Pease [1], a micro-channel heat sink consisting of parallel micro-flow passages, was demonstrated to have very small thermal resistance. Since that time, this technology has been used
in micro-electronics and other major application areas, such as fuel cell systems and advanced heat sink designs. These practical advantages of micro-channel heat sinks have stimulated researches in experimental, theoretical and also numerical field. Comprehensive surveys may be found in[2–5]. Experimental studies on micro-channel heat transfer and pressure measurements reported in the litera-ture present strong dispersion of the results and sometimes disagree with the conventional theories of transport phe-nomena which are well verified in macro-scale flows.
Effect of entrance length on the pressure drop and the heat transfer for conventional channels was presented by Shah and London [6]. Kim and Kim [7] investigated numerically the influence of velocity and temperature dis-tributions on the heat transfer and friction factor at both high-aspect-ratio and low-aspect-ratio micro-channels heat
0017-9310/$ - see front matterÓ2007 Elsevier Ltd. All rights reserved. doi:10.1016/j.ijheatmasstransfer.2006.12.003
*
Corresponding author. Tel.: +972 48 292058; fax: +972 48 238101.
E-mail address:[email protected](G. Hetsroni).
sinks. Petukhov [8] investigated heat transfer characteris-tics and drag of laminar flow of liquid in pipes.
Peng and Peterson [9] and later, Peng and Wang [10]
investigated the convective heat transfer and flow friction for water flow in micro-channel structures. The experimen-tal results indicated that the geometric configuration had a significant effect on the single-phase convective heat trans-fer and flow characteristics. Empirical correlations were suggested for calculating both the heat transfer and pres-sure drop.
Qu et al. [11] performed an experimental study of the pressure drop in trapezoidal silicon micro-channels with a hydraulic diameter ranging between 51lm and 169lm. A high ratio of channel length to diameter 180<ðL=DhÞ<600 determined fully developed laminar flow regime in which, the calculated friction factors found to be higher, by 8–38% than the expected values obtained by using the conventional theory. The authors justify the deviation in the results due to high relative roughness (3.5–5.7%) in the channel surface and proposed the numer-ical roughness–viscosity model to explain the experimental data.
Pfund et al. [12] measured the pressure drop, friction factor and Poiseuille number of water flowing along
ðDhÞ ¼128–1050lm rectangular micro-channels, at
Re¼60–3450. In the laminar regime (Re< 2000) their data show good agreement with the conventional theory with regard to the non-dependence of Poiseuille number on
Reynolds number but the measured values were higher than these corresponding to theoretical prediction.
Jiang et al.[13]investigated frictional losses in rectangu-lar micro-channels of Dh= 300lm. The average value of
the non-uniform relative roughness was measured by elec-tron microscope and was found to be as high as 12%. The measured friction factors were larger than the values pre-dicted by the conventional theory. This result was attrib-uted to channel walls roughness and short length of the micro-channels, which did not allow one to neglect the effects of the hydrodynamic entrance region.
Mala and Li [14] investigated experimentally the pres-sure losses in micro-channels with diameters ranging from 50lm to 254lm. The relative roughness changed from 1.36% to 7.0%. The measurements indicated the existence of significant divergence between experimental values of pressure gradient and values predicted by conventional theory.
The effect of roughness on pressure drop in micro-tubes with diameter 620lm and 1067lm and relative roughness 0.71%, 058% and 0.321% was investigated by Kandlikar et al. [15]. For 1067lm diameter tube, the effect of roughness was insignificant. For the 620lm tube the pres-sure drop results showed dependence on the surface roughness.
Xu et al.[16]investigated deionized water flow in micro-channels with hydraulic diameter from 30lm to 344lm at
Re¼20–4000. Two different experimental test modules
Nomenclature
A cross-section area
Cp specific heat
C* Po
exp/Poth
D diameter
f friction factor
F heated surface
h heat transfer coefficient
H micro-channel height
kf thermal conductivity of the fluid
ks roughness
K1 developing flow loss coefficient L length
€
m mass flux
N power
Nu Nusselt number
P pressure
Pe Peclet number
Po Poiseuille number
Pr Prandtl number
q heat flux
Re Reynolds number
r0 micro-channel hydraulic radius
T temperature
u velocity
u* friction velocity
W micro-channel width
x,y,z Cartesian coordinates
X+ dimensionless hydraulic entrance length
X* dimensionless thermal entrance length
Greek symbols
a aspect ratio
e uncertainty
g dimensionless radius
l dynamic viscosity
m kinematic viscosity
q density
s shear stress
Subscripts
av average exp experimental f fluid
were used. The first was made of rectangular, aluminum-based channels with a plastic cover attached to the chan-nels top surface by glue. The second one consisted of sili-con channels covered by Pyrex glass using anodic bonding. Results obtained showed that deviation from classical correlations reported in earlier studies may have resulted from errors in the measurements of micro-channel dimension, rather than any micro-scale effects.
Sharp and Adrian [17] investigated the transition from laminar to turbulent flow in liquid filled glass microtubes having diameters between 50lm and 247lm. The results of more than 1500 measurements of pressure drop vs. flow rate confirm the macroscopic Poiseuille flow result for lam-inar flow at Reynolds numbers less than 1800.
Guo and Li [18] studied the size effect on micro-scale single-phase flow and heat transfer. Because the micro-devices have a large surface to volume ratio, factors related to surface effects have more impact on the flow at small scales. Among these are surface roughness channel surface geometry and measurement errors. Discrepancies between experimental results for the friction factor and the Nusselt number and their standard values due to the measurement errors might be misunderstood as being caused by novel phenomena at micro-scales.
New method for pressure measurements was reported recently by Kohl et al.[19]. The main objective of this study was to investigate the discrepancies in previously published data, by using straight channel test section with integrated miniature pressure sensors along the flow direction. The channel hydraulic diameter was Dh= 25–100lm under
incompressible flow conditions and Re= 4.9–2068. This unique technique allows one to consider entrance effects and hydrodynamic developing flow for pressure drop cal-culations. The results suggested that friction factors for micro-channels can be accurately determined from data for standard large channels. The authors explain the large inconsistencies in previous researches, probably, due to instrumentation errors and/or improper accounting for compressibility effects. In addition, the pressure drop inside the channel associated with the developing flow was found to be as large as 17% of the pressure drop inside the chan-nel, therefore, it is important to include this effect, espe-cially for the channels withL=Dh <300.
Klein et al.[20]and Zhang and Li[21]demonstrated the importance of the micro-channel manifolds design and the influence on the velocity and temperature fields, both, in the flowing cooling liquid and on the heated wall.
Hetsroni et al.[22]measured the surface temperature of a heated capillary tube by means of an infrared technique in order to determined the average and local heat transfer coefficient in laminar flow.
Rahman [23] tested the forced convection of water in etched silicon micro-channels with Dh¼300–490 and
90<L=Dh <150. The main results of this study showed
that the measured values of the average Nusselt number are usually larger than those predicted by correlations for large size channels. The author explained this finding as
being caused by the breakage of the velocity boundary layer by surface roughness associated with the channel structure. Tiselj et al. [24] investigated the effect of axial conduc-tion on the heat transfer in micro-channels. Experimental and numerical analysis were performed to evaluate heat transfer characteristics of water flowing through triangular silicon micro-channels. It was shown that as the bulk water temperature, as well as the temperature of the heated wall, do not change linearly along the channel.
Simultaneously developing three-dimensional laminar flow and heat transfer in the entrance region of trapezoidal channels have been investigated by Renksizbulut and Niaz-mand[25]using numerical methods in the Reynolds num-ber range from 10 to 1000. The results for the fully developed flow region of the channels compare well with the available literature. It was shown that Reynolds-num-ber-independent Poiseuille number can be used for Rey-nolds numbers over 50 and after a few hydraulic diameters from the channel inlet. It was also shown that hydrodynamic entrance lengths calculated with methods based on fully developed flow data are grossly in error.
Qu and Mudawar[26]studied both experimentally and numerically heat transfer characteristics of a single-phase micro-channel heat sink. The heat sink consisted of an array of rectangular, oxygen-free copper, channels, 231lm wide and 713lm deep. The Reynolds number ranged from 139 to 1672. The experimental results were compared with the numerical predictions by considering the conjugated heat transfer between the solid and the fluid region. The mea-sured temperature distributions showed good agreement with the corresponding numerical predictions.
Lelea et al.[27]experimentally researched the heat trans-fer and fluid flow in microtubes having diameters of 0.1, 0.3 and 0.5 mm. The cooling liquid in use was distilled water in the laminar flow regime. Special care has been taken for reducing the heat loss in order to keep experimental uncer-tainty within an allowable level for the thermal results.
Warrier et al.[28]conducted experiments of forced con-vection in small rectangular channels using FC-84 as test fluid. The test section consisted of five parallel aluminum-based channels, with hydraulic diameter ofDh= 0.75 mm
and length to diameter ratio ofL=Dh¼433:5.
Experimen-tal results of the variation of local Nu as a function of the axial distance were compared to numerical data pre-sented by Kays and Crawford [29] and agree quite well, especially near the fully developed region. In addition, the authors measured the experimentally Fanning friction factors and found them about 8–14% higher than the ana-lytically predicted values.
The influence of size effects and scaling on hydrody-namic flow and heat transfer in 2-D micro-channels was investigated by Gao et al. [30]. The test section consisted of a single bronze micro-channel with hydraulic diameter ranging from 200lm to 2 mm, the ratio of the length to hydraulic diameter was 40<L=Dh<400, and the aspect
L¼L=ðDhReÞ was compared with the theoretical
solu-tion for laminar flow regime and the results demonstrate good agreement. However, for the lowest aspect ratio
ðH=W ¼0:004Þthe plotNuxshows departure from the
the-oretical heat transfer trend and found to be smaller (reduc-tion of 60%) than the conven(reduc-tional value for large scale channels reported by Shah and London[6]. The researchers rejected roughness and electro kinetics effects in attempt to find an explanation for these findings.
In a continuance study, Gamrat et al. [31] based their numerical investigation on the same experimental facility used by Gao et al.[30] and built a 3-D model for solving simultaneously the fluid flow and energy equations. They considered thermal entrance effects and coupling conduc-tion–convection condition in order to accurately compare between the measured and computed heat flux and temper-ature fields. Contrary to the experimental work, the numer-ical analysis did not reveal any significant size effect on heat transfer down to the smallest hydraulic diameter which was tested.
Xu et al.[32] experimentally investigated a new model, composing of parallel longitudinal and several transverse micro-channels which separate the whole flow length into several independent zones, in which the thermal boundary layer is in developing regime. The redeveloping flow repeated for each region separately, thus the overall heat transfer is greatly increased and the pressure drops are decreased compared with the conventional micro-channel heat sink. Resulted from the shortened ‘‘effective flow length”, the new structure achieved a significant reduction in pressure drops while enhancing heat transfer. The study discussed the influence of the thermal conduction of the solid silicon on the heating area temperature distribution and on the local Nusselt number.
In order to explore the validity of classical correlations based on large size channels for predicting the thermal behavior in single-phase flow, Lee et al.[33]studied deion-ized water flow through parallel array of copper micro-channels. The channel width ranged from 194lm to 534lm with channel depth being nominally five times the width in each case and Reynolds number range of 300– 3500. Numerical predictions obtained based on a classical, continuum approach were found to be in good agreement with the experimental data. The authors noted that the entrance and boundary conditions imposed in the experi-ment need to be carefully matched in the predictive approaches. It is noteworthy that several studies exhibit contradictory results for both the mechanical and thermal characteristics of the flow. This is generally due to differ-ences in the many parameters that characterize these stud-ies such as the geometry, the shape and surface roughness of the channels, the fluid nature, the boundary conditions and the measuring methodology itself. The micro-channels utilized in engineering are frequently connected with inlet and outlet manifolds and should be considered as micro-scale heat exchangers. In this case the thermal boundary condition at the inlet and the outlet of the channels is not
adiabatic. The effects of simultaneously developing flow and thermal regime or hydrodynamically developed but thermally developing regime play an important role. More-over, uneven flow distribution among parallel micro-chan-nels should be taken into account. It should be stressed that in all experimental investigations in micro-channels the temperature distribution of the working fluid along the heated surface was not measured. In many cases the use of heat transfer model based on the assumption of constant heat flux, and linear variation of the bulk temperature of the fluid at low Reynolds number, yield an apparent growth of the Nusselt number with increase in Reynolds number. For a fundamental insight on the entrance effects on flow and heat transfer into micro-scale cooling devices it is useful to reduce as much as possible the number of parameters.
In the present study we chose geometry of the inlet and outlet manifolds that made it possible for uniform flow dis-tribution among parallel micro-channels, we kept the same surface roughness and measured the fluid bulk temperature along the heated surface. The objective of the present inves-tigation is to study the effect of developing flow and ther-mal regime on momentum and heat transfer in micro-scale heat sink.
2. Experimental set-up and procedure
A scheme of the experimental apparatus is shown in
Fig. 1. Filtered water at room temperature was used as the working fluid. The water was pumped from the entrance tank by a miniature gear pump through the inlet calm chamber, inlet manifold to the micro-channels in the test module, and from the micro-channels through the out-let manifold, outout-let calm chamber to the exit tank. The test section is shown inFig. 2. The mass flow rate of the water was measured by a precision flow meter which was cali-brated by a standard weighting method.
2.1. Test module
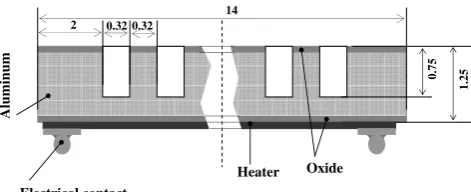
[image:4.595.325.549.592.731.2]The test module was fabricated of 14 mm20 mm and 1.25 mm thick aluminum plate. The cross-section of the
test module is shown inFig. 3. Sixteen micro-channels were machined on one side of this plate using a precision sawing technique. Electric resistor, which was used as a heat source, was located on the other side of the plate. The micro-channels were of 320lm wide and 750lm deep with an accuracy of ±10lm. The serpentine pattern, electrical heater, 1010 mm2 had been attached to the surface of the aluminum by chemical vapor deposition technique and provided a uniform heat flux. The heater filament, made of chrome, has dimensions of 1720 A˚ in thickness, 1.257 mm in width and length of 82 mm. The heat sink housing was made of Teflon in order to decrease the heat loses to the environment and keep the inlet/outlet mani-folds temperature at constant value. A plate made of poly-carbonate plastic was attached to the test section by several screws and served as transparent cover, which was used
also for measurements of fluid temperature by thermocou-ples and for pressure drop measurements. During the mea-surements of fluid temperature into the micro-channels by IR technique a cover made of sapphire glass was employed. The transparent window of sapphire had a wave length range of 0.15–7lm, which makes possible to perform visual observations and also IR measurements through the cover. When radiant energy strikes surface, a part of the radiation is reflected, part is absorbed and part is trans-mitted. The transmission of sapphire window at 10 mm thickness is shown inFig. 4. From this figure one can con-clude that the transmission is constant for most of the wavelength range. The transmission value for the wave-length ofk= 5lm andT= 273 K is about 85%. This value of transmissivity makes possible measurements through sapphire by IR technique. Before these measurements a calibration procedure was conducted. In the range of given water temperature from 30°C to 90°C the water tempera-ture moving into the manifolds was measured by thermo-couples and by IR camera and then the calibration with an accuracy of ±1 K was performed.
2.2. Manifolds
[image:5.595.54.266.73.215.2]Several studies[20,21]showed that the manifolds design play an important role in the liquid distribution among parallel micro-channels which can lead to spanwise temper-ature gradients on the device surface, enlarge thermal stres-ses and reduce his reliability. To study the effect of entrance conditions on temperature of the heater calculations using CFD software were conducted. Details of the calculation were described in[20,24]. Fig. 5shows a typical tempera-ture distribution on the heater. The fluid moves from the bottom to the top, the heat flux isq= 4.4 W/cm2and the mass flux is m_ ¼8:33 kg/m2s. The figure presents a com-parison between temperature field of the heater obtained from the numerical simulation (A) and that obtained from IR measurements (B). The square marked area of 1010 mm shows the heater. Both of the pictures show very close temperature distribution.Fig. 6shows the tem-perature distribution along the central and side lines, marked as lines 1, 2 respectively inFig. 5. Numerical and experimental results agree quite well.
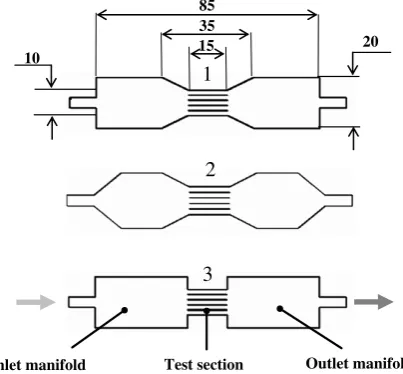
Fig. 2. Schematic view of the test section.
Aluminum
Heater Oxide Electrical contact
2
1.25
0.75
[image:5.595.41.277.251.347.2]14 0.32 0.32
Fig. 3. Micro-channels cross-section.
[image:5.595.120.460.599.731.2]To optimize the design of the manifold configuration, a number of numerical calculations were conducted. The cal-culations were carried out for three types of manifolds shown in Fig. 7.Fig. 8 shows the velocity distribution at the distance of 2 mm from the inlet to micro-channels for different types of the manifolds. FromFig. 8one can con-clude that configuration of the manifolds marked as 1 and 2 ensure uniform velocity distribution at the entrance to the micro-channels. In the present study the manifolds of type 1 were used.
2.3. Measurement apparatus and procedure
A uniform heat flux, transferred by the electrical resis-tor, was controlled by a power supply. A thermal high-speed imaging radiometer was utilized to study the temper-ature field on the electrical heater and the working fluid temperature distribution along the micro-channels. The camera is suitable for temperature measurements in the wave length range of about 5lm, The measurement resolu-tion was of 0.03 mm. The heater was coated with a thin layer of black diffusive paint, with emissivity of 0.96. The determination of the emissivity was conducted through the method described in detail by Hetsroni et al. [22]. For pressure drop measurements the holes of diameter 0.6 mm were connected to pressure transducers by needles,
Fig. 9. The pressure drop was measured directly at the cen-tral part of the micro-channels (not in the manifolds). Such a method makes possible to avoid pressure drop losses associated with contraction and expansion at the micro-channels inlet and outlet.
The data were collected by a digital data collecting sys-tem with an accuracy of ±1%. The sys-temperature measuring process of the working fluid along the heated surface was divided in to two steps: at the first investigation, seven 0.3 mm T-type thermocouples were inserted into holes that were drilled in the plastic cover along the heat sink
symme-Fig. 5. Temperature field on the heater.
32 37 42 47 52 57
0 1 2 3 4 5 6 7 8 9 10
x, mm Tw,
o C
Fig. 6. Comparison between numerical simulation and experimental results for the temperature field on the heater surface: (—) simulation, (M)
experimental results (line 1 inFig. 5) (- - -) simulation, (h) experimental results (line 2 inFig. 5).
1
2
3 15 35 85
10
20
[image:6.595.61.291.80.354.2]Inlet manifold Test section Outlet manifold
Fig. 7. Types of manifolds used for calculations.
1
3 2
0 0.3 0.6 0.9 1.2 1.5 1.8
0 4 8 12 16 20
Z, mm
U,
cm
/s
[image:6.595.314.561.224.393.2] [image:6.595.67.269.544.731.2]try line, as shown inFig. 10a.Fig. 10b shows the position of the thermocouple junctions relative to the micro-chan-nel. The thermocouples measured the temperature of the thin fluid layer adjacent to the channel cover, as well as the IR readings,. The readings of the thermocouples were used to represent liquid balk temperature. These sensors measured the fluid bulk temperature in the manifolds as well as above the heater area. During the second step the fluid temperature was measured through the sapphire glass cover by IR camera with a microscopic lens. The matter is discussed in Section2.5.
For normal testing procedure, the pump was turned on at mass flow rates from 0.3 g/s to 4.7 g/s. The electrical power to the heater was adjusted to a desired level by a var-iable voltage controller. The module was then allowed to reach a steady state, which was achieved within less than 5 min from the moment the flow conditions were stabilized. For each run values of mass flow rate and electric power were recorded by the data acquisition. Simultaneously the temperature of the water along the micro-channels was measured by thermocouples and the temperature field on the heater was recorded by the IR radiometer. These data were collected for 20 discrete values of Reynolds numbers in the range of Re= 30–600, and 5–8 different values of heat flux for a given Reynolds number. The plastic cover was then replaced by the sapphire glass and at the same experimental conditions the water temperature was mea-sured by the IR radiometer. One of the advantages of this IR technique is continuous measurements of water temper-ature along the micro-channels and in the manifolds.
2.4. Data reduction
The bulk flow velocity was calculated as
u¼m=qA ð1Þ
the friction factor was calculated as
f ¼2DpDh=Lqu2 ð2Þ
The total heat input to the test module may be expressed as
N¼N1þN2þN3 ð3Þ
whereNis the Joule heating in the heater,N1is the power
transferred to the fluid in the channels, N2 is the power
conducted through the solid body of the test module in the axial direction,N3is the power dissipated due to heat
losses.
The power generated by Joule heating was
N¼IV ð4Þ
whereIandVare the input current and voltage. The power transferred to the fluid was estimated as
N1¼mCpðToutTinÞ ð5Þ
wheremis the mass flow rate,Cpis the specific heat,Tout
andTinare the outlet and the inlet temperatures measured
by thermocouples T7 and T1, respectively.
For calculation of the average heat transfer coefficient the heat flux was assumed to be constant and was deter-mined from the equation
q¼N1=F ð6Þ
where F is the heated surface of the micro-channels, which includes the bottom and the side walls. The aver-age temperature on the heater, TWðavÞ, and the average
fluid temperature,TfðavÞwere used to calculate the average
heat transfer coefficient and the average Nusselt number,
Nu(av).
For determination of the local heat transfer coefficient the length of the heater was divided into number of sections and the local heat flux was calculated using Eq.(5), where
ToutandTinare the outlet and the inlet fluid temperatures
at a given section measured by IR technique.
We assumed that at given cross-section the side-wall temperature of the micro-channel did not differ from the bottom temperature. The same assumption was used by Qu and Mudawar[26]. In this study the heat sink was fab-ricated from copper, consisted of an array of rectangular micro-channels of 231lm wide, 713lm deep and fitted with polycarbonate plastic cover plate. The measured tem-perature distributions showed good agreement with the corresponding numerical predictions. Lee et al. [33] mea-sured the temperature on the bottom of micro-channels by thermocouples embedded in a copper test section. The temperature readings from these thermocouples were extrapolated to provide the average micro-channel wall temperature. For rectangular channels of Dh= 318–
903lm numerical predictions were found to be in good agreement with experimental data. Tiselj et al.[24]showed that due to the high thermal conductivity of the heat sink, the temperature field in the silicon wafer is close to isother-mal one at each cross-section of triangular micro-channels with hydraulic diameter of 160lm.
Needle
Polycarbonate cover Pressure sensor
20 mm
5 mm 10mm
a
[image:7.595.88.228.73.265.2]b
The local value of Nu is calculated by the following equation:
Nu¼hDh=kf ð7Þ
The local heat transfer coefficient,h, was obtained using lo-cal heated channel wall temperature, TW, and local fluid
temperature,Tf, at the centers of a given section
h¼q=ðTWTfÞ ð8Þ
The local fluid temperature,Tf, was determined by the IR
technique. The following procedure was used to determine the wall temperature of the micro-channel from an infrared image of the heater. The straight lines on the bottom of the heated module corresponding to the streamwise axes of mi-cro-channels were determined using the special image soft-ware. Along each line, the temperature on the heater was determined and then the temperature of the micro-channel bottom, TW, was calculated from the heat conduction
equation. It was assumed that the temperature distribution along the side walls did not differ significantly from that along the bottom. Temperatures used in the present study were averaged values obtained at the given cross-section for the channels placed at the central part of the test mod-ule. The bulk water temperature at given cross-section of the test module was used to calculate the physical fluid properties.
2.5. Verification of the method
For each steady-state experimental conditions an energy balance was performed. The average temperature of the heater and the average temperature of the Pyrex or sap-phire cover were used to calculate the heat losses to ambi-ent, N3. The heat losses due to free convection and
radiation were calculated. The electric power, N, and the power transferred to the fluid, N1, were calculated using
Eq.(4) and (5), respectively. The heat losses,N3, due to free
convection and radiation were calculated and then the power due to the axial heat flux,N2, was determined from
Eq. (3). It is important to stress that the heat losses were only a small fraction – between 0.5% and 1% of the total energy input from the heater.
The powerN2may be also estimated from the
measure-ments based on the temperature difference ofðT6T2Þ. In this case the power transferred to the fluid is
N4¼mCpðT6T2Þ ð9Þ
wheremis the mass flow rate.
Eq. (9) agrees with Eq. (5) with standard deviation of 4%. It should be noted that by the IR technique tempera-ture of the thin fluid layer adjacent to the sapphire glass (y=H) was measured. We now consider a steady flow in micro-channel, with constant heat flux from below and constant wall temperature from the top. This problem
Fluid inlet
X
Z
T3 T4 T5
11 32.5
T1 T2 T6 T7 Fluid outlet Z
Inlet manifold Outlet manifold
5
0.50
0.32 Seal
Fluid
Polycarbonate cover
Thermocouple
Micro-channel
Aluminum
Heater
a
[image:8.595.144.458.74.386.2]b
was studied numerically by Li and Cheng[34]. The results showed that if the height of micro-channel is larger then 10lm the temperature gradient is quite small. Therefore, in a relatively high micro-channel, we can consider the tem-perature at y=H in order to determine bulk fluid temperature.
The key question is: are the measurements of the fluid temperature carried out by the IR radiometer and by the thermocouples reflect the bulk temperature. We compared the powerNtransferred to the fluid from the measurements based on the temperature difference of ðT5T3Þ to that based on the temperature difference ofðT6T2Þ. A good agreement was obtained.
3. Results and discussion
Experimental conditions are given inTables 1–3.
3.1. Experimental uncertainty
The uncertainty of the components for an estimation of an error measurement of wall temperature was obtained according to the standard 1995 Guide to the Expression of Uncertainty of the Measurements [35]. The details of calculation are presented by Hetsroni et al.[22]. The error in determining the average Nusselt number, Nu, formed from an estimation of errors that became at measurements of the following values:Dh– the hydraulic diameter of the
channels, L – the length of the channels, m – mass flow rate,ðToutTinÞ– difference between outlet and inlet
tem-peratures of the liquid,ðTiwTfÞ– difference between the
averaged value of the inner wall and liquid temperatures as well as an error in the magnitude of the physical properties asCp– specific heat of water andk– thermal conductivity
of water.
The error of the product f Reis
dðfReÞ=ðfReÞ ¼ ½ðdDP=DPÞ2þ ð4dDh=DhÞ 2
þ ðdL=LÞ2þ ðdm=mÞ20:5 ð10Þ
Eq. (10) shows that the channel hydraulic diameter mea-surement introduces some error into the uncertainty of the productf Re.
The error in determining the power, N, generated by Joule heating is due to errors of measurements of both elec-tric current and elecelec-tric voltage. The error in magnitude of the power transferred to the working fluid, N1, is due to
uncertainties of the flow rate, m; specific heat of water,
Cp, the difference between outlet and inlet temperatures
ToutTin. The error in the estimation of heat losses, N3,
[image:9.595.302.554.88.326.2]is due to correlations for calculation of natural convection and radiation heat transfer. Performing the error analysis according to[34] the uncertainties in determining various parameters in this study are given inTable 4.
Table 1
Pressure drop measurements
N
(–)
Mass flux (kg/m2s)
Inlet fluid temperature (°C)
Outlet fluid temperature (°C)
Pressure drop (Pa)
1 227 23.2 23.2 470
2 289 23.2 23.2 583
3 354 23.2 23.2 734
4 418 23.2 23.2 855
5 491 23.2 23.2 1040
6 560 23.3 23.3 1150
7 611 23.3 23.3 1290
8 677 23.3 23.3 1470
9 738 23.2 23.3 1600
10 815 23.2 23.2 1780
11 846 23.2 23.2 1870
12 921 23.3 23.3 2050
13 976 23.3 23.3 2240
14 1040 23.3 23.3 2430
15 1080 23.3 23.3 2580
16 1120 23.2 23.2 2710
17 1160 23.2 23.2 2760
18 1200 23.2 23.2 2920
[image:9.595.301.554.378.495.2]19 1240 23.2 23.2 3050
Table 2
Average heat transfer measurements
N
(–) Mass flux (kg/m2s)
Inlet fluid temperature (°C)
Outlet fluid temperature (°C)
Average temperature on the bottom (°C)
Heat flux (W/m2)
1 81.7 23.8 28.7 30.2 21,900
2 160 24.1 39.0 49.8 126,000
3 227 23.2 30.7 39.5 83,400
4 289 22.5 31.9 49.0 150,000
5 354 23.0 28.8 39.6 101,000
6 403 23.2 27.8 39.4 99,800
7 451 24.2 26.0 30.6 39,200
8 491 23.5 30.3 50.4 170,000
9 560 23.7 25.3 30.8 41,400
10 611 23.9 25.4 30.5 43,900
11 677 23.6 27.0 41.1 122,000
12 737 23.7 25.1 30.6 47,900
13 814 23.8 27.0 41.6 130,000
14 847 24.0 27.0 41.4 128,000
15 884 24.3 27.2 41.6 128,000
16 924 24.3 29.0 58.6 263,000
17 977 24.3 29.4 58.0 264,000
18 1080 24.2 29.0 56.6 264,000
19 1170 24.1 28.5 56.1 264,000
20 1240 23.9 28.0 54.6 264,000
Table 3
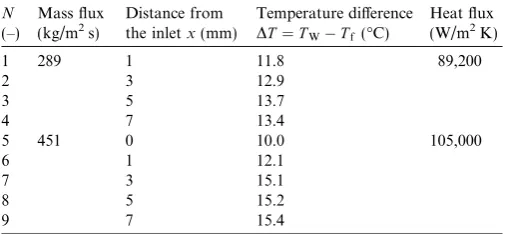
Local heat transfer measurements
N
(–)
Mass flux (kg/m2s)
Distance from the inletx(mm)
Temperature difference
DT¼TWTf(°C)
Heat flux (W/m2K)
1 289 1 11.8 89,200
2 3 12.9
3 5 13.7
4 7 13.4
5 451 0 10.0 105,000
6 1 12.1
7 3 15.1
8 5 15.2
[image:9.595.33.283.528.746.2]3.2. Friction factor
[image:10.595.43.292.89.306.2]3.2.1. The average Poiseuille number
Fig. 11shows the dependence ofPoonRefor the non-heated fluid flow. If the pressure drop is associated with the developing flow in smooth micro-channels the theoretical line for comparison would be a horizontal line. In the con-ventional theory, the relationships between the flow friction coefficient,f, and Reynolds number,Re, for fully developed laminar flow regime in rectangular channel may be calcu-lated according to Shah and London[6]:
Po¼96ð11:3553aþ1:9467a21:7012a3
þ0:9564a40:2537a5Þ ð11Þ
wherea= 0.4 is the aspect ratio of the channel used in the present study.
The Poiseuille number calculated by Eq. (11) is
Po= 64.5.
Many investigations have been concentrated on com-pact modeling methods for micro-channel heat sink. It is because numerical simulations and experiments require
considerable effort and long time. An averaging approach was proposed by Kim and Kim [7]. The solution for the velocity distribution was obtained by solving one-dimen-sional averaged equations for fully developed flow. For
a= 0.4 the calculated Poiseuille number is aboutPo= 56. The deviation of data fromPo= const could be misin-terpreted as a transition to turbulence. The study of forced convection characteristics in rectangular channels with hydraulic diameter of 133–367lm was performed by Peng and Peterson [9]. In these experiments the Reynolds num-ber was in the range 50–4000. The main results of this study (and subsequent works, for example, Peng and Wang[10]) consisted of the following: (i) drag coefficients for laminar and turbulent flows are inversely proportional Re1.98 and
Re1.72, respectively, (ii) Poiseuille number is not constant; for laminar flow it depends on Re, PoRe0.98, (iii) the transition from laminar to turbulent flow occurs at Re
about 300–700.
The hypothesis on earlier transition from laminar to tur-bulent flow in micro-tubes was presented by Mala and Li
[14]. It is based on analysis of the nonlinear dependence of the pressure gradient on Reynolds number obtained in their experiments. Such a phenomenological analysis does not reveal the actual reasons of the displacement of bound-ary transition to low Reynolds numbers region. Kohl et al.
[19] conducted an experimental investigation of micro-channel flow with internal pressure measurements in the range of 4.9 <Re< 2068. The measurements clearly showed the linear variation of pressure along the channel’s length that is associated with laminar incompressible flow. One of the possible ways to account for the influence of the roughness on the pressure drop in micro-tube is to apply a modified-viscosity model to calculate the velocity distribution. This model was proposed by Qu et al. [11]
to interpret their experimental data. These results do not agree with those obtained in the present study and reported by other investigators [4,17,19]. Flows in micro-channels are often laminar, so the study of laminar flow in rough micro-channels has become important. High relative roughness may cause the Poiseuille number to vary with
Re. It is known that hydraulically smooth flow regime occurs when the Reynolds number that is defined by height of roughnessksand friction velocityu*changes in the range
0<ksu=m<5 [4], the upper limit of this inequality
deter-mines the maximum value of the velocity at which laminar flow is possible. Taking into account that u¼ ðs=qÞ0:5
,
s¼lðdu=dyÞw,u¼umð1g2Þ, g¼r=r0 andum¼2u (sis
the shear stress at the wall, um and u are the maximum
and average velocities,r0is the micro-channel radius,
sub-scriptwrefers to wall), we arrive at the following estimate of the relative roughness, corresponding to the boundary that subdivides the flow in smooth and rough channels:
ks=r0<5=ð1:4Re0:5Þ ð12Þ
ForRe1000, the relative roughness, that corresponds to the boundary between the smooth and roughness channels is ks=r00:11. The relative roughness of the bottom and Table 4
Experimental uncertainties (95% confidence level)
# Source of uncertainty Symbol Uncertainty (%)
1 Hydraulic diameter Dh 1.0
2 Length of the test section L 0.3
3 Wall temperature TW 2.5
4 Difference between inlet and outlet temperatures of liquid
TinTout 2.0 5 Difference between wall and liquid
temperatures
TWTf 3.0
6 Mass flow rate m€ 1.0
7 Electrical power N 0.5
8 Power transferred to fluid N1 4.4 9 Power transferred trough tube wall N2 12.5
10 Heat losses N3 12.0
11 Heat transfer coefficient h 13.0
12 Nusselt number Nu 13.2
13 Friction coefficient f 10.2
14 Reynolds number Re 4.5
15 Specific heat of water Cp 0.1 16 Thermal conductivity of water kf 0.5
17 Kinematic viscosity m 2.1
40 60 80 100 120
0 100 200 300 400 500 600
Re
[image:10.595.45.293.607.727.2]Po
walls is calculated as ks=r0. The average roughness, e, in
this study was measured by optical profilometer and found as 4.3lm, hence, the relative roughness is about 2%. The latter shows that hydraulic characteristics of micro-chan-nels used in the present study are close to one of smooth micro-channels. The qualitative difference between the data by Peng and Wang[10], Qu et al.[11], Mala and Li[14]and theoretical predictions is, probably, due to experimental uncertainties.
3.2.2. Variation of the Poiseuille number vs. dimensionless length
The pressure drop between the inlet and the outlet of the channel was used to calculate Poiseuille number. For a given value of the channel size the Poiseuille number depends on the Reynolds number. This is obviously due to the finite thickness of the boundary layers at the channel entrance, as opposed to a uniform velocity profile in fully developed case. The inlet/outlet pressure measurements were also used by Gao et al. [30] and by Gamrat et al.
[31] and it was shown that the dimensionless developing length X+ is the proper parameter to take into account the entrance effects on the overall friction factor. Fig. 12
shows the variation of Poiseuille number vs. Xþ¼ x=DhRe for micro-channel roughness considered in the
present study. The points show the results obtained in the range of Reynolds numberRe= 100–580. The distribution ofPo does not depend onRe. This result agrees with pre-diction for laminar developing flow channels of usual size, proposed by Shah and London[6]. Gamrat et al.[31] pre-sented both two and three-dimensional numerical analysis of entrance effects on laminar liquid flow. The momentum and continuity equations were solved for the following hydraulic boundary conditions: a uniform velocity profile at the inlet container, the flow was assumed to be fully developed at the exit, no axial gradient for all the flow vari-ables except pressure. It was found that distribution of
Po(x) depends onReand channel spacing contrary to Shah and London[6]case whereX+is the proper dimensionless group. The authors suggest that such effects are due to the finite thickness of the boundary layers at the channel entrance, as opposed to a uniform velocity profile in our experiments and the Shah and London [6]reference case.
In the range of X+< 0.01 an increase in Re leads to an increase in Po [31]. The opposite effect was reported by Renksizbulut and Niazmand [25] where in the range of
X+< 0.01 an increase in Relead to a decrease in Po. The calculations were conducted for laminar flow in a trapezoi-dal channel. Inflow boundary conditions corresponded to a uniform flat velocity profile, for outflow zero gradients along the axial flow direction were applied to all variables. The results reported by Gamrat et al. [31] and by Ren-ksizbulut and Niazmand[25]differ not only from the Shah and London[6]predictions but also from those obtained in the present study and in the study of Kohl et al.[19]where internal pressure measurements provide information about the pressure drop inside the channel.
While comparing the experimental results to those obtained by the conventional theory, it is most important to take into consideration the boundary condition of the problem. The comparison is correct only when those condi-tions are consistent. When dealing with fluid flow within micro-channels, in most applications, the short length of the channels is not enabling the flow to reach the fully developed regime. The dimensionless hydrodynamic length may be calculated as
Lh=Dh¼0:055Re ð13Þ
It is possible to formulate the general features of Poiseu-ille’s flow as follows:C¼Poexp=Poth, wherePoexpandPoth
are experimental and theoretical Poiseuille number, respec-tively. This condition testifies to identical form of the dependence of the experimental and theoretical drag coef-ficient on the Reynolds number.
Basically, there may be three reasons of the inconsis-tency between the theoretical and experimental friction fac-tors: (i) discrepancy between the actual conditions of a given experiment and the assumptions used in deriving the theoretical value, (ii) error in measurements, (iii) effects due to decreasing the characteristic scale of the problem, which leads to changing correlation between the mass and surface forces.
The method presented by Shah and London [6]is used in the present study to determine the pressure drop associ-ated with the developing flow in the entrance region of the channel. The effect of developing flow should be included in the theoretical model using Eq.(14):
ðfReÞDeveloping Flow¼ ðfReÞFully Developed Flowþ ðK1qu2=2Þ
ð14Þ
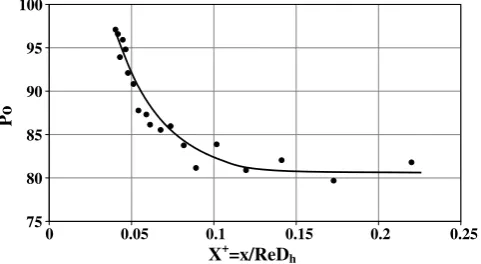
whereK1is the pressure loss coefficient associated with the developing flow.K1 was measured and calculated by pre-vious researchers and the results were summarized by Shah and London[6]. In Fig. 13– the experimental data of Po
were normalized by values calculated for rectangular ducts according to Shah and London[6], Eq. (341).Fig. 13shows the Poiseuille number calculated by Eq. (14). The experi-mental results agree with the analytical value within the data uncertainty.
75 80 85 90 95 100
0 0.05 0.1 0.15 0.2 0.25
X+=x/ReDh
[image:11.595.40.281.598.730.2]Po
3.3. Thermal results
Comparison between heat balance based on difference between temperature of the fluid at the outlet and inlet manifolds and the temperature difference measured directly in the channel. It should be noted that when the heat bal-ance is based on temperature difference (T6T2) the heated portion of the channels is shorter than the total length of the test section. Thermocouples T6 and T2 were placed into outlet and inlet calm chamber, respectively. When the measurements were conducted by thermocouples T5 and T3 the heated portion of the channels was the same as the channel length. These thermocouples were installed at the surface of the transparent cover adjoined to the
top of the micro-channels. It was important to investigate the difference between temperature measured by thermo-couples T5 and T3 and bulk temperature into the micro-channels. It should be also taken into account the heat transfer to the ambient, conducted through the thermo-electrodes and through the power wires connected to the power supply. This problem was especially serious in the case of comparison between the temperature measurements by thermocouples to those made by IR. The following value of e was used as a measure STD of thermal uncer-tainty, e, in the present experiment
e¼ ððT6T2Þ ðT5T3ÞÞ=ðT6T2Þ ð15Þ
In the range 100<Re<580 the value of STD was
e¼8:4%. It depends on Reynolds number and decreases with an increase inRe. The results agree with heat balance data reported by Lelea et al.[27]for annular micro-channel of Dh¼300lm. From both investigations it is clear that,
asRe decreases, the outlet temperature of water increases. This results in an increase of the temperature of the ther-mo-electrodes and an increase of heat conduction through electrodes to the ambient.
3.3.1. Thermal visualization
The present study includes heat transfer aspects of the problem and relates both to the heater side problem and to thermal pattern into the micro-channels. The tempera-ture distribution depends on the material and design of
0.6 0.8 1 1.2 1.4
0 100 200 300 400 500 600
Re
C
[image:12.595.49.291.71.199.2]*
Fig. 13. Normalized Poiseuille number as a function of Reynolds number.
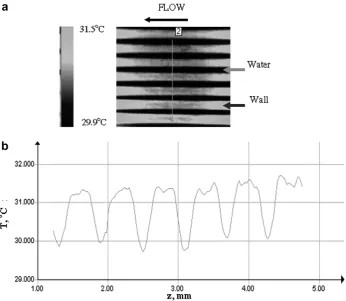
[image:12.595.129.476.428.729.2]the module, flow rate into micro-channels and heat flux. For given values of flow rate and heat flux, the infra-red (IR) image at the surface of the transparent cover on top of the micro-channels was clearly observed.Fig. 14a shows the IR image (top view) of the central part of the test mod-ule obtained at mass flow rate Re= 100 and heat flux
q¼25:0104 W/m2.Fig. 14b shows the temperature dis-tribution in the spanwise direction. The flow moved from the right to the left, the field of view is 3.6 mm and 3.6 mm in the streamwise and spanwise direction, respec-tively, the gray strips show the temperature on the channel walls (about 31.2°C), the black strips show the tempera-ture of the water (about 29.9°C). The sequences of such images were used to determine the fluid temperature along the micro-channels.
3.3.2. Average Nusselt number
For heat transfer, the Prandtl number of the fluid also plays an important role. The thermal entrance may be cal-culated as
LT=Dh¼0:055Re Pr ð16Þ
The average Nusselt number as a function of the Reynolds number is presented inFig. 15. Open circles representNuav
calculated using fluid temperatures measured by thermo-couples T3, T4 and T5, closed circles representNuav
calcu-lated using fluid temperatures measured by thermocouples T2 and T6, rectangular points represent Nuav calculated
using fluid temperatures measured by IR technique. The re-sults of Shah and London[6]are also shown for compari-son. InFig. 15– the solid line is based on data[6]– for the case of thermally developing and hydrodynamically devel-oped flow, Table 51[6]. As expected the experimental Nus-selt number increases with the Reynolds number. Clearly, the length of the thermal entrance region increases with an increase inRe, the values in the entrance region are lar-ger than those in the fully developed region, which high-lights the critical importance of the entrance region in determining the heat transfer characteristics in micro-chan-nel devices.
3.3.3. Local Nusselt number
In Fig. 16the experimental results of the local value of
Nu are plotted vs. the non-dimensional axial distance,
X¼x=DhRe Pr for the respective experimental conditions
together with those reported by Warrier et al.[28]. Single-phase forced convection experiments have been performed by Warrier et al.[28]. The test section was made of alumi-num and consisted of five parallel rectangular micro-chan-nels of hydraulic diameter Dh¼750lm and Re range of
557–1552. The measured values agree quite well with our data and numerical results, especially near the fully devel-oped region. Close to the channel entrance the experimen-tally measured values generally tend to be about 25% lower. The experimental data inFig. 16 indicate that the local Nu number decreases and approaches the constant value with increasingX*. As seen fromFig. 16the present
experimental data are in reasonable agreement with theoret-ical results. It can be concluded that for rectangular micro-channels the local value ofNu is in good agreement with conventional theory including the entrance region. The same results were reported by Lelea et al.[27]on heat trans-fer and fluid flow of distilled water in micro-tubes of 0.1, 0.3, and 0.5 mm withRenumber range up to 800.
Conduction and entrance effects on laminar liquid flow and heat transfer in rectangular micro-channels were inves-tigated by Gamrat et al. [31]. Contrary to the results obtained in our study the variation of the measured Nu
with the dimensionless coordinate are clearly depended onRe. For uniform inlet velocity and temperature profiles the effect of axial conduction in fluid on heat transfer essen-tially depends only at low Peclet numbers,Pe. It was shown by Petukhov [8] that at Pe> 50, X+> 0.02 the effect of axial conduction is less then 5%. AtPe> 100 this effect is negligibly small[8,25]. The experiments described by Gam-rat et al.[31]were conducted in the range ofRe= 518–2076 at Prandtl number about Pr= 6. The model used by the authors takes complex geometry and axial conduction effects in the solid wall into account. They assumed that
Re
3 4 5 6 7 8
0 200 300 400 500 600
Nu
av
[image:13.595.310.548.548.711.2]100
Fig. 15. Variation of the average Nusselt number with the Reynolds number: (s) data based on the fluid measurements by thermocouples T3, T4, T5, (d) data based on fluid measurements by thermocouples T2, T6, (h) data based on IR measurements, (—) Shah and London[6]solution.
2 3 4 5 6 7 8
0 0.005 0.01 0.015 0.02 0.025
X*
Nu
[image:13.595.41.281.564.700.2]velocity and temperature profiles wereRe-dependent at the micro-channel entrance.
3.3.4. Axial conduction in the wall
It is worth underlining that in the present study a con-vergent channel entrance was used, contrary to several other studies where the channel inlet is characterized by an abrupt contraction. As a consequence, nearly uniform velocity and temperature profiles at the inlet were achieved. IR technique made it possible to measure temperature dis-tribution in the streamwise direction on the heater and in the fluid in the micro-channel.Fig. 17shows the tempera-ture distribution in the plane of symmetry atRe= 30 and N = 19 W. The wall temperature decreases in the last part of the micro-channelðx=L>0:75Þdue to the lack of heat-ing caused by axial conduction through the solid walls of the micro-channel. The wall and fluid bulk temperature distribution cannot be approximated as a linear one. Since measurements of the local heat flux were not possible in the present experimental study, we assumed that the heat flux into the test section was uniformly distributed in the spanwise direction. According to Tiselj et al.[24]the effect of non-uniform heat distribution leads to decrease in the localNuin the part of micro-channel near the inlet.
4. Conclusion
The goal of this investigation has been to measure the pressure drop and temperature distribution of the flow in micro-channels in an attempt to determine the sources of unusual and often conflicting results previously reported in the literature. The new method that was used provides information about the fluid temperature distribution inside the channel and provides validation for the methods used to determine the local and average Nusselt numbers.
A developing micro-channel heat transfer and fluid flow has been investigated experimentally on rectangular micro-channels ofDh¼440lm, having water as a working fluid.
The experimental results have been compared with theoret-ical predictions from literature and results obtained by numerical modeling of the present experiment. The experi-mental results of pressure drop and heat transfer confirm
that including the entrance effects, the conventional theory is applicable for water flow through micro-channels.
It was shown that data presented by other researches can be carried over to entrance effects. The present results highlight the importance of accounting for common phe-nomena that are often negligible for standard flows such as accounting for profile of inlet velocity, axial heat con-duction, effect of the design inlet and outlet manifolds.
References
[1] D.B. Tuckerman, R.F. Pease, High performance heat sinking for VLSI, IEEE Electron Dev. Lett., EDL-2 (5) (1998) 126–129. [2] C.B. Sobhan, S.V. Garimella, A comparative analysis of studies on
heat transfer and fluid flow in micro-channels, Microscale Thermo-phys. Eng. 5 (2001) 293–311.
[3] G.L. Morini, Single-phase convective heat transfer in microchannels: a review of experimental results, Int. J. Therm. Sci. 43 (2004) 631– 651.
[4] G. Hetsroni, A. Mosyak, E. Pogrebnyak, L.P. Yarin, Fluid flow in micro-channels, Int. J. Heat Mass Transfer 48 (10) (2005) 1982–1998. [5] G. Hetsroni, A. Mosyak, E. Pogrebnyak, L.P. Yarin, Heat transfer in micro-channel, Int. J. Heat Mass Transfer 48 (25–26) (2005) 5580– 5601.
[6] R.K. Shah, A.L. London, Laminar Flow Forced Convection in Ducts, Academic Press, New York, 1978, S.V.
[7] D.K. Kim, S.J. Kim, Averaging approach for micro-channel heat sinks subject to the uniform wall temperature condition, Int. J. Heat Mass Transfer 49 (2006) 695–706.
[8] B.S. Petukhov, Heat transfer and drag of laminar flow of liquid pipes. Energy, Moscow, 1967.
[9] X.F. Peng, G.P. Peterson, Convective heat transfer and friction for water flow in micro-channel structures, Int. J. Heat Mass Transfer 39 (1996) 2599–2608.
[10] X.F. Peng, B.X. Wang, Forced convection and boiling characteristics in micro-channels, in: Heat Transfer 1998 Proceedings of 11th IHTC, vol. 11, Kyongiu, Korea, August 1998, pp. 371–390.
[11] W. Qu, M. Mala, Pressure-driven water flow in trapezoidal silicon micro-channels, Int. J. Heat Mass Transfer 43 (2000) 353–364. [12] D. Pfund, D. Rector, A. Shekarriz, A. Popescu, J. Welty, Pressure
drop measurements in microchannel, AIChe J. 46 (8) (2000) 1496– 1507.
[13] P.X. Jiang, M.H. Fan, G.S. Si, Z.P. Ren, Thermal-hydraulic performance of small scale micro-channel and porous-media heat-exchangers, Int. J. Heat Mass Transfer 44 (2001) 1039–1051. [14] Gh.M. Mala, D. Li, Flow characteristics of water in micro-tubes, Int.
J. Heat Fluid Flow 20 (1999) 142–148.
[15] S.G. Kandlikar, S. Joshi, S. Tian, Effect of surface roughness on heat transfer and fluid flow characteristics at low Reynolds number in small diameter tubes, Heat Transfer Eng. 24 (3) (2003) 4–16. [16] B. Xu, K.T. Ooi, N.T. Wong, W.K. Choi, Experimental investigation
of flow friction for liquid flow in microchannels, Int. Commun. Heat Mass Transfer 27 (8) (2000) 1165–1176.
[17] K.V. Sharp, R.J. Adrian, Transition from laminar to turbulent flow in liquid filled micro-tubes, Exp. Fluids 36 (2004) 741–747.
[18] Z-Y. Guo, Z-X. Li, Size effect on micro-scale single-phase flow and heat transfer, Int. J. Heat Mass Transfer 46 (2003) 149–159. [19] M.J. Kohl, S.I. Abdel-Khalik, S.M. Jeter, D.L. Sadowski, An
experimental investigation of microchannel flow with internal pressure measurements, Int. J. Heat Mass Transfer 48 (2005) 1518– 1533.
[20] D. Klein, G. Hetsroni, A. Mosyak, Heat transfer characteristics of water and APG surfactant solution in a micro-channel heat sink, Int. J. Multiphase Flow 31 (2005) 393–415.
[21] Z. Zhang, Y. Li, CFD simulation on inlet configuration of plate-fin heat exchangers, Cryogenics 43 (12) (2003) 673–678.
26 31 36 41 46
0 5 10 15 20
x,mm
T,
[image:14.595.51.290.72.178.2]o C
[22] G. Hetsroni, M. Gurevich, A. Mosyak, R. Rozenblit, Surface temperature measurements of a heated capillary tube by means of an infrared technique, Measur. Sci. Technol. 14 (2003) 807–814. [23] M.M. Rahman, Measurements of heat transfer in microchannel heat
sinks, Int. Commun. Heat Mass Transfer 27 (4) (2000) 495–506. [24] I. Tiselj, G. Hetsroni, B. Mavko, A. Mosyak, E. Pogrebnyak, Z.
Segal, Effect of axial conduction on the heat transfer in micro-channels, Int. J. Heat Mass Transfer 47 (2004) 2551–2565.
[25] M. Renksizbulut, H. Niazmand, Laminar flow and heat transfer in the entrance region of trapezoidal channels with constant wall temperature, J. Heat Transfer 128 (2006) 63–74.
[26] W. Qu, I. Mudawar, Experimental and numerical study of pressure drop and heat transfer in a single-phase micro-channel heat sink, Int. J. Heat Mass Transfer 45 (2002) 2549–2565.
[27] D. Lelea, S. Nishio, K. Takano, The experimental research on micro-tube heat transfer and fluid flow of distilled water, Int. J. Heat Mass Transfer 47 (2004) 2817–2830.
[28] G.R. Warrier, V.K. Dhir, L.A. Momoda, Heat transfer and pressure drop in narrow rectangular channels, Exp. Therm. Fluid Sci. 26 (2002) 53–64.
[29] W.M. Kays, M.E. Krawford, Convective Heat and Mass Transfer, McGraw-Hill, New York, 1993.
[30] P. Gao, S.L. Person, M. Favre-Marient, Scale effects on hydrody-namics and heat transfer in two-dimensional mini and microchannels, Int. J. Therm. Sci. 41 (2002) 1017–1027.
[31] G. Gamrat, M. Favre-Marient, D. Asendrych, Conduction and entrance effects on laminar liquid flow and heat transfer in rectan-gular microchannels, Int. J. Heat Mass Transfer 48 (2005) 2943– 2954.
[32] J.L. Xu, Y.H. Gan, D.C. Zhang, X.H. Li, Microscale heat transfer enhancement using thermal boundary layer redeveloping concept, Int. J. Heat Mass Transfer 48 (2005) 1662–1674.
[33] P.S. Lee, S.V. Garimella, D. Liu, Investigation of heat transfer in rectangular microchannels, Int. J. Heat Mass Transfer 48 (2005) 1688–1704.
[34] J. Li, P. Cheng, Bubble cavitation in micro-channel, Int. J. Heat Mass Transfer 47 (2004) 2689–2698.