21
Chapter 2: The potential of a novel frequency-response permittivity sensor in
measuring soil and water properties.
Naiqian Zhang , Biological and Agricultural Engineering Department, Kansas State University
ABSTRACT
Permittivity is an important property of dielectric materials such as soil and water. Permittivity
describes both conductive and dielectric (capacitive) behaviors of dielectric materials. Various
components in soil (salts, nutrients, organic matter, etc.) and pollutants in water (sediment, nutrients
introduced by fertilizers, pesticides, etc.) have different effects on the conductive and capacitive
behaviors of these dielectric materials. Thus, effectively measuring permittivity may lead to
accurate, quantitative detection of the components and pollutants. Since 2001, we have developed
a novel, frequency-response (FR) permittivity sensor that is capable of measuring both the
conductive and capacitive parameters of dielectric materials. The sensor has been successfully
tested in soils with different levels of water content, salinity, density, and different texture types. It
was also tested in waters with different concentrations of salts. Results of several experiments are
22 Introduction
Permittivity is the ability of a material to resist the formation of electric field in the material, or the
ability to transmit (or “permit”) the electric field. When an external electric field is applied to a
material, dipole molecules in the material tend to align up in the opposite directions. This process of
alignment, called polarization, hinders current flow. The actual amount of total current flowing in the
material is determined by both capacitive and conductive behaviors of the material. Thus,
permittivity can be directly related to electric susceptibility. For example, an increased permittivity of
the medium allows the same charge to be stored with a smaller electric field, leading to an
increased capacitance.
Responses of a material to an external alternating electric field typically depend on the frequency of
the electric field. At low frequencies, the polarity of the electric field changes slowly enough to allow
dipole molecules in the material to be aligned in the opposite directions. At high frequencies, the
dipole orientation cannot follow the change in the polarity of the electric field due to the binding
force between atoms. The applied energy is thus dissipated. This is called dielectric relaxation,
which can be thought of as an elastic response of the material to the applied electric field (Robinson
et al., 2003).
This relaxation process gives rise to a phase lag between the imposed field and the material’s
response to it. This phase lag is a function of the frequency of the imposed field. Because of this
phase lag, permittivity can be expressed in a complex form (Topp et al., 2000).
Another energy dissipation process arises from the electrical conductivity of the media. Conduction
can happen from two sources: surface conduction of electric charges on the solid surfaces in the
23
of polarization, relaxation, and conductivity to permittivity are represented as follows (Topp et al.,
2000): o r
ε
ε
ε
= (1)(2) ( ) ( ) ( )
ε
(ω
)(1 tanδ
)ωε
σ
ω
ε
ω
ε
ω
ε
j r jo DC r
r
r = ′ −
+ ′′ − ′ = ) ( ) ( tan
ω
ε
ωε
σ
ω
ε
δ
r o DC r ′ + ′′ = (3)where, ε is permittivity (F m-1), εo is permittivity of free space (8.85 x 10⁻¹² F m-1), εr is relative
permittivity, ε’r is the real component of relative permittivity (energy storage due to polarization), ε”r
is the imaginary component of relative permittivity (energy loss due to dielectric relaxation), σDC is
DC electrical conductivity, tanδ is loss tangent, ω is angular frequency (rad s-1), and j is −1.
In summary, permittivity of a dielectric material has three major contributing components: energy
storage due to polarization, energy loss due to relaxation, and energy loss due to conduction. Both
polarization and relaxation properties can be considered capacitive. Thus, permittivity describes
both the capacitive and conductive behaviors of dielectric materials. These behaviors can be used
to measure physical and chemical properties and compositions of dielectric materials in the solid
(including particulate or porous), liquid (including gelatinous), and gaseous phases.
As indicated in Equation (2), for each dielectric material, both the real and imaginary parts of
24
permittivity is measured may provide specific information on individual properties of the measured
material.
Permittivity measuring techniques have been developed mainly for detecting properties and
compositions of solid and liquid dielectric materials. Soil serves as an excellent example of
combinations of complex dielectric materials in all phases. Soil is a heterogeneous, particulate,
disperse, and porous medium composed of mineral matter, organic matter, water, and air. The
mineral matter consists of particles that vary in chemical composition as well as in size and shape.
Organic matter is derived from microorganisms such as fungi, bacteria, insects, earthworms, plant,
and animal residuals. Almost all the components in soil affect its permittivity. As a result, it is
possible to measure compositions of soils through permittivity measurement, although it is
challenging to separate the effects of individual components from measured permittivity.
Water also is a good example of dielectric materials. Various substances in water have different
influences on its conductive and capacitive characteristics. Many human health-related waterborne
pollutants have significant effects on permittivity. These include soil sediment, heavy metal, nutrient
residuals, herbicide residual, bacteria, and organic materials such as petroleum products. Solids
that dissolve in water, such as salts of various types (minerals) and heavy metals like lead, are the
dominating factors for electrical conduction carried out by anions and cations.
Most existing permittivity sensors were designed to measure either the conductive, or the capacitive
(dielectric) behavior, but not both. These sensors provide only one piece of information – apparent
EC or dielectric constant at a given frequency - and are unable to separate factors affecting these
parameters. Since 2001, we have been developing a novel, real-time FR permittivity sensor to
simultaneously measure multiple properties of dielectric materials (Zhang et al., 2004). In this
paper, results of preliminary tests using the sensor in soil and water are discussed.
25 Results and Discussion
t Results of Soil Tes
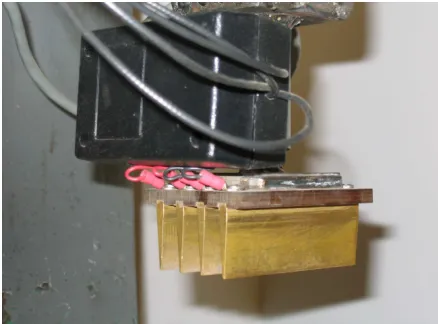
[image:5.595.214.433.228.390.2]Design of the sensor probe for the soil test was a modified, four-electrode, Wenner-array structure (Figure 1).
Figure 1. Four-electrode, FR permittivity sensor probe for soil
The sensor was tested in 750 carefully prepared soil samples from three soil types, at combinations
of five salinity levels, five water contents, five densities, and two replications. The
frequency-response data were analyzed using the locally weighted PLS method. For measuring volumetric
water content at all combinations of soil types and densities, the model achieved coefficient of
determinations (R2 values) of 0.91 and root-mean-square (RMS) error of 0.013 m3 m-3. In measuring
salinity, the R2 value achieved by the models was 0.72, with an RMS error of 1.176 dS m-1 (Lee,
2005).
Preliminary Results of Water Tests
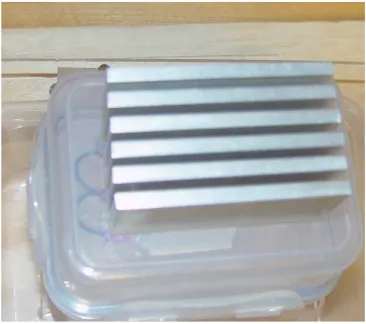
A modified sensor probe (Figure 2) was tested in water solutions of three salts, KNO3, KH2PO4,
and KCl. The experiment was conducted in two steps. During the first step, we tested the solutions
26
individual cation and anions. For each salt, 11 solution samples were prepared in deionized water.
Frequency-response data were then taken three times using the sensor. Calibration models for
predicting the salt concentrations were established for individual salts. Results are shown in Table
1.
[image:6.595.206.389.228.390.2]
Figure 2. sensor probe used in water tests
Table 1. Prediction results for three salt solutions at high concentrations
(3,500 – 35,000 ppm)
Salt type R-square value RMS error (ppm)
KH2PO4 0.9985 390
KNO3 0.9848 1273
KCl 0.9927 857
In order to test the sensor’s ability to recognize specific ions in water solutions, FR data for all three
salts were combined to establish PLS models to quantitatively predict individual ions. The results
are shown in Table 2. The prediction results for potassium cation across three salt types are shown
[image:6.595.163.490.498.564.2]27
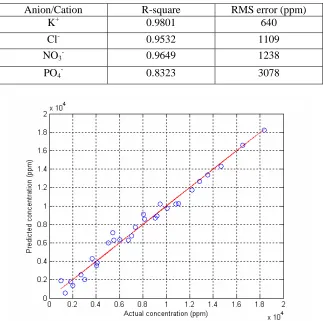
Table 2. Prediction results for ions and cation in three salt solutions at high concentrations
(3,500 – 35,000 ppm)
Anion/Cation R-square RMS error (ppm)
K+ 0.9801 640
Cl- 0.9532 1109
NO3- 0.9649 1238
PO4
[image:7.595.163.486.152.473.2]-0.8323 3078
Figure 3. Prediction result for potassium cation concentration in three high-concentration
salt solutions
The second step of the experiment was to test salt solutions at low concentrations (0-4 ppm). The
salt tested was potassium nitrate. Samples of 11 concentrations were prepared using a dilution
procedure. Three independent sets of samples were prepared. One set was used for calibration;
the others for validation. The results are shown in Table 3. These results prove that the sensitivity of
the sensor is sufficient for measuring nutrient residual in water at the environmentally- and
28
Table 3. Prediction results for K+ in three salt solutions at low concentrations
(0-4 ppm)
Data set R-square RMS error (ppm) Training data set 0.9988 0.0413
Validation data set 1 0.9217 0.7754
Validation data set 2 0.8710 1.408
Frequency signature
Conventional multivariate analysis tools, such as partial least square (PLS) method, have been
proven effective in spectroscopic data analysis. In order to reduce the number of frequencies used
in the model, “signature frequencies” for a specific agent, at which the frequency response of the
agent possesses distinguishable patterns from other agents, should be selected. One way to select
the signature frequencies is to locate the peaks (both positive and negative) in the loading factors
(principal components) derived from the PLS analysis for that specific agent.
From the first three principal components (PC) derived from the PLS analysis on potassium cation
(K+) using 33 solution samples of KCl, KNO3, and KH2PO4 (11 samples for each), 30 signature
frequencies were selected from 606 frequencies originally used in the FR data. PLS models
established using the 30 signature frequencies were tested in samples of individual and combined
salt solutions to predict the concentrations of potassium cation (K+). As shown in Table 4, the 30
signature frequencies did a very good job in detecting the cation concentration with high R2 values and
low RMS errors, especially for the KCl and KH2PO4 solutions. This result indicates that, once
correctly identified, the signature frequencies can be used to detect specific ions in water samples
with unknown pollutants. The reduced number of frequencies would not only speed up the
29
Table 4. Prediction results for K+ in different salt solutions using a PLS model established
based on 30 “signature frequencies”
Solutions tested Number of samples tested
R2 RMS error (ppm)
KCl 11 0.9909 503
KNO3 11 0.8084 4401
KH2PO4 11 0.9999 25
KCl, KNO3, and KH2PO4 33 0.9071 1383
When the 30 signature frequencies obtained using high-concentration solutions were used to
predict low-concentration (0-4 ppm) KNO3 solutions, the R 2
value for the training data set was
basically unchanged. For validation, the R2 value slightly decreased for data set 2 but increased for
data set 3 (Table 5). The difference between these two was greatly reduced. This demonstrates the
effectiveness of the frequency signature in describing the FR patterns of specific types of ions and
in avoiding model overfitting.
Table 5. Effectiveness of frequency signature in reducing the number of frequencies while achieving
better prediction for low concentration (0-4ppm) KNO3.
Data set Data set 1 (Training) Data set 2 (Validation) Data set 3 (Validation) Frequencies used 606 (original) 30 (Signature) 606 (original) 30 (Signature) 606 (original) 30 (signature) R2 values 0.9991 0.9992 0.9560 0.9153 0.8207 0.9140
Conclusions
1. Results of soil and water tests indicated that the FR permittivity sensor has a great potential for
simultaneously measuring multiple properties of dielectric materials.
2. The sensor simultaneously measured soil volumetric water content and salinity in soil samples
with different textures and densities. Water content was measured with a higher accuracy than
30
3. The sensor successfully measured potassium cation among three different salt solutions.
4. Frequency signatures selected through multivariate analysis greatly reduced the number of
frequencies required for the measurement while maintaining the measurement accuracy.
Acknowledgement
The author acknowledges the financial support provided for this research by the Kansas Water
Resources Institute.
References
Lee, K.H. 2005. A dielectric permittivity sensor for simultaneous measurement of multiple soil
properties. Unpublished PhD diss. Manhattan, Kansas: Kansas State University, Department of
Biological and Agricultural Engineering.
Robinson, D.A., S. B. Jones, J. M. Wraith, D. Or, and S. P. Friedman. 2003. A review of advances
in dielectric and electrical conductivity measurement in soils using time domain
reflectometry. Vadose Zone Journal 2:444-475.
Topp, G.C., S. Zegelin, and I. White. 2000. Impact of the real and imaginary components of relative
permittivity on Time Domain Reflectometry measurements in soils. Soil Sci. Soc. Am. J.
64:1244-1252.
Zhang, N., G. Fan, K. H. Lee, G. J. Kluitenberg, and T. M. Loughin. 2004. Simultaneous
Measurement of Soil Water Content and Salinity Using a Frequency-Response Method. Soil