Ames Laboratory Accepted Manuscripts
Ames Laboratory
11-2-2018
Temperature dependence of the solid-liquid
interface free energy of Ni and Al from molecular
dynamics simulation of nucleation
Yang Sun
Ames Laboratory, [email protected]
Feng Zhang
Ames Laboratory, [email protected]
Huajing Song
Ames Laboratory
Mikhail I. Mendelev
Ames Laboratory, [email protected]
Cai-Zhuang Wang
Iowa State University and Ames Laboratory, [email protected] See next page for additional authors
Follow this and additional works at:
https://lib.dr.iastate.edu/ameslab_manuscripts
Part of the
Biological and Chemical Physics Commons
This Article is brought to you for free and open access by the Ames Laboratory at Iowa State University Digital Repository. It has been accepted for inclusion in Ames Laboratory Accepted Manuscripts by an authorized administrator of Iowa State University Digital Repository. For more information, please [email protected].
Recommended Citation
Sun, Yang; Zhang, Feng; Song, Huajing; Mendelev, Mikhail I.; Wang, Cai-Zhuang; and Ho, Kai-Ming, "Temperature dependence of the solid-liquid interface free energy of Ni and Al from molecular dynamics simulation of nucleation" (2018).Ames Laboratory Accepted Manuscripts. 371.
Temperature dependence of the solid-liquid interface free energy of Ni and
Al from molecular dynamics simulation of nucleation
Abstract
The temperature dependence of the solid-liquid interfacial free energy, γ, is investigated for Al and Ni at the
undercooled temperature regime based on a recently developed persistent-embryo method. The atomistic
description of the nucleus shape is obtained from molecular dynamics simulations. The computed γ shows a
linear dependence on the temperature. The values of γ extrapolated to the melting temperature agree well with
previous data obtained by the capillary fluctuation method. Using the temperature dependence of γ, we
estimate the nucleation free energy barrier in a wide temperature range from the classical nucleation theory.
The obtained data agree very well with the results from the brute-force molecular dynamics simulations.
Disciplines
Biological and Chemical Physics
Authors
Yang Sun, Feng Zhang, Huajing Song, Mikhail I. Mendelev, Cai-Zhuang Wang, and Kai-Ming Ho
J. Chem. Phys. 149, 174501 (2018); https://doi.org/10.1063/1.5048781 149, 174501 © 2018 Author(s).
Temperature dependence of the
solid-liquid interface free energy of Ni and Al
from molecular dynamics simulation of
nucleation
Cite as: J. Chem. Phys. 149, 174501 (2018); https://doi.org/10.1063/1.5048781
Submitted: 17 July 2018 . Accepted: 16 October 2018 . Published Online: 02 November 2018
Yang Sun , Feng Zhang, Huajing Song, Mikhail I. Mendelev, Cai-Zhuang Wang, and Kai-Ming Ho
ARTICLES YOU MAY BE INTERESTED IN
NaCl nucleation from brine in seeded simulations: Sources of uncertainty in rate estimates
The Journal of Chemical Physics 148, 222838 (2018); https://doi.org/10.1063/1.5024009
Molecular dynamics simulation of the solid-liquid interface migration in terbium
The Journal of Chemical Physics 148, 214705 (2018); https://doi.org/10.1063/1.5026922
Surface free energy of a hard-sphere fluid at curved walls: Deviations from morphometric thermodynamics
THE JOURNAL OF CHEMICAL PHYSICS149, 174501 (2018)
Temperature dependence of the solid-liquid interface free energy
of Ni and Al from molecular dynamics simulation of nucleation
Yang Sun,1Feng Zhang,1,a) Huajing Song,1Mikhail I. Mendelev,1,b) Cai-Zhuang Wang,1,2 and Kai-Ming Ho1,2,3
1US Department of Energy, Ames Laboratory, Ames, Iowa 50011, USA 2Department of Physics, Iowa State University, Ames, Iowa 50011, USA
3Hefei National Laboratory for Physical Sciences at the Microscale and Department of Physics, University of Science and Technology of China, Hefei, Anhui 230026, China
(Received 17 July 2018; accepted 16 October 2018; published online 2 November 2018)
The temperature dependence of the solid-liquid interfacial free energy,γ, is investigated for Al and Ni at the undercooled temperature regime based on a recently developed persistent-embryo method. The atomistic description of the nucleus shape is obtained from molecular dynamics simulations. The computedγ shows a linear dependence on the temperature. The values of γ extrapolated to the melting temperature agree well with previous data obtained by the capillary fluctuation method. Using the temperature dependence of γ, we estimate the nucleation free energy barrier in a wide temperature range from the classical nucleation theory. The obtained data agree very well with the results from the brute-force molecular dynamics simulations. Published by AIP Publishing. https://doi.org/10.1063/1.5048781
I. INTRODUCTION
The solid-liquid interfacial (SLI) free energy,γ, plays a fundamental role in crystal nucleation and growth process.1
It is also a key parameter required to model the formation of solidification microstructures.2Despite its importance, the
measurement of the SLI free energy is extremely difficult in experiments. Therefore, computer simulation, which provides detailed atomistic information, remains heavily employed to quantitatively investigateγ.
A well-established method to computeγis the capillary fluctuation method (CFM)3which measures the SLI stiffness based on capillary wave theory.4,5While CFM makes an accu-rate determination ofγ, it is only available at the melting point Tm and usually computationally expensive.6 To obtain γ at
other temperatures, Laird and co-workers further extend the CFM results along the pressure-temperature coexistence curve using the “Gibbs-Cahn integration” method.7 However, the
temperature dependence ofγatp= 0 remains unclear. More-over, in the case when several crystal phases compete with each other, a large pressure can trigger a nucleation of the phase which was metastable atp= 0. On the other hand, one can make an indirect measurement of the SLI free energy from nucle-ation simulnucle-ation with the classical nuclenucle-ation theory (CNT).8,9 This method utilizes the results of molecular dynamics (MD) simulations where the critical nucleus was actually observed. While the method is in principle reliable (see details below), the accuracy strongly depends on the measurement of the size and shape of the critical nucleus.10In particular, this method faces the well-known difficulty associated with the fact that the nucleation is usually a very rare event. Recently we developed
a)Email: [email protected] b)Email: [email protected]
a persistent-embryo method (PEM)11to overcome this prob-lem in moderately undercooled liquids. With the PEM, one can observe the actual fluctuations of the large critical nucleus without any biasing. In this work, using the PEM, we deter-mined the average nucleus shape for two fcc crystals, Al and Ni, in the moderately undercooled regime. Then the temper-ature dependence of the SLI free energy was obtained in the framework of the CNT. These data were used in turn to predict the free energy barrier in a wide temperature range for both systems.
The rest of the paper is organized as follows: in Sec.II, we will introduce the persistent embryo method and provide the simulation details. In Sec.III, we will present the obtained temperature dependences of SLI free energy for Al and Ni. In Sec. IV, we will show that the obtained SLI free energy data lead to the nucleation barriers in agreement with the data determined using a very different technique. In Sec.V, we will discuss the obtained results, and we will provide the summary in Sec.VI.
II. PERSISTENT EMBRYO METHOD
According to the CNT,1 a homogeneous nucleation involves a formation of the critical nucleus in the undercooled liquid. The formation of such a nucleus is governed by two fac-tors. The first one is the thermodynamic driving force towards the lower-free-energy bulk crystal. This term is negative and proportional to the number of atoms in the nucleus. The other is the energy penalty for creating an interface between the nucleus and the liquid. This term is positive and proportional to the area of the interface. Therefore, the excess free energy to form a nucleus withNatoms is
∆G=N∆µ+Aγ, (1)
174501-2 Sunet al. J. Chem. Phys.149, 174501 (2018)
where∆µ(<0) is the chemical potential difference between the bulk solid and liquid,γis the solid-liquid interfacial free energy, andAis the interface area which can be evaluated as
A=s(N/ρc)2/3, whereρcis the crystal density andsis a shape
factor. The competition between the bulk and interface terms leads to a nucleation barrier∆G∗when the nucleus reaches the critical sizeN∗, i.e., ∂∆G(N∗)
∂N =0, and
∆G∗= 4s 3γ3
27|∆µ|2ρ2c. (2)
The CNT assumes the spherical shape (sCNT ≡
3
√
36π) for the nucleus to relate ∆G∗ withγ and∆µ. This assumption can be lifted by introducing the shape factors, assuming that the averaged shape of the sub-critical nucleus does not change at the critical size. Mathematically, the interfacial free energy density γ and the shape factors in Eq.(2), which are both difficult to compute, can be replaced by the critical nucleus sizeN∗at the critical point11based on the relation
γ= 3
2s|∆µ|ρ 2/3
c N∗
1
3, (3)
resulting in∆G∗=12|∆µ|N∗. According to Eq.(3), four quan-tities (ρc,∆µ,N∗, ands) are needed to obtain from the MD
to calculate the interfacial free energyγat a given tempera-ture. The determination of the crystal density,ρc, is trivial. The
chemical potential difference,∆µ, can be calculated by inte-grating the Gibbs-Helmholtz equation from the undercooling temperature to the melting point.12The determination of the critical nucleus sizeN∗
and the shape factor can be obtained from the PEM simulations which will be described in detail below.
The PEM utilizes the main CNT concept that homoge-neous nucleation happens via the formation of the critical nucleus in the undercooled liquid. The PEM allows efficient sampling of the nucleation process by preventing a small crys-tal embryo (withN0 atoms which are much smaller than the
critical nucleus) from melting using external spring forces.11 This removes long periods of ineffective simulation where the system is very far away from forming a critical nucleus. As the embryo grows, the harmonic potential is gradually weakened and is completely removed when the cluster size reaches a sub-critical threshold Nsc(<N∗). During the simulation, the
har-monic potential only applies to the originalN0(<Nsc) embryo
atoms. The spring constant of the harmonic potential decreases with increasing nucleus size ask(N)=k0NNscsc−N ifN<Nscand
k(N) = 0, otherwise. This strategy ensures that the system is
unbiased at the critical point such that a reliable critical nucleus is obtained. If the nucleus melts belowNsc(<N∗), the harmonic
potential is gradually enforced preventing the complete melt-ing of the embryo. When the nucleus reaches the critical size, it has equal chance to melt or to further grow causing fluctu-ations aboutN∗. As a result, theN(t) curve tends to display a plateau during the critical fluctuations, giving a unique signal to detect the appearance of the critical nucleus. In addition, multiple plateaus can be collected before a critical nucleus eventually grows, allowing sufficient statistical analysis of the size and shape of nuclei.
All MD simulations in the present study were per-formed using the GPU (graphics processing unit)-accelerated LAMMPS (Large-scale Atomic/Molecular Massively Parallel Simulator) code.13–15 The interatomic interaction was mod-elled using the Finnis-Sinclair potentials16developed for the Ni17and Al.12During the MD simulation, the NPT ensemble was applied with Nose-Hoover thermostats. The damping time in the Nose-Hoover thermostat is set asτ= 0.1 ps which is fre-quent enough for the heat dissipation during the crystallization (see thesupplementary material). The time step of the simu-lation was 1.0 fs. The simusimu-lation cell contained up to 32 000 atoms which is at least 20 times larger than the critical nucleus size. This setting ensures that the effect of pressure change during the nucleation is minimal to the entire simulation box (see thesupplementary material).
To identify the nucleus size during the MD simulation, we used the bond-orientational order (BOO) parameter.18,19 In this approach, one first defines the correlation between the structures of two neighbor atomsiandjas
Sij= X6
m=−6q6m(i)·q
∗
6m(j), (4)
where
q6m(i)=
1
Nb(i) XNb(i)
j=1 Ylm
~rij
(5)
is the Steinhardt parameter,Ylm
~rij
are the spherical harmon-ics,Nb(i) is the number of nearest neighbors of atomi, and~rij
is the vector connecting it with its neighborj. Two neighboring atomsiandjare considered to be connected whenSijexceeds
a thresholdSc. To choose a reasonable value ofSc, Espinosa
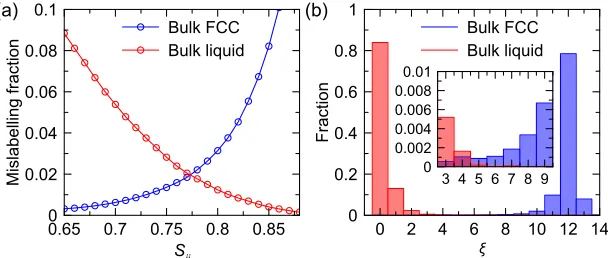
[image:5.594.46.350.619.748.2]et al.suggested an “equal mislabeling” method20by plotting the population of mislabeled atoms in the bulk solid and liquid as a function of the threshold values. As shown in Fig.1(a), the crossing point of the mislabeling curves of the bulk liquid and solid phases is chosen as the threshold,Sc, to provide that the
174501-3 Sunet al. J. Chem. Phys.149, 174501 (2018)
probability of mislabeling atoms in the bulk liquid as solid-like atoms is the same as the probability of mislabeling atoms in the bulk solid as liquid-like atoms. This approach works very well when one needs to detect “solid” atoms within a bulk liq-uid. However, it tends to mislabel “solid” atoms at the cluster interface. To account for that, one can determine the number of solid-like neighbors an atom has. Figure1(b) shows that this quantity, ξ, is quite different for a majority of atoms in the bulk solid and liquid phases and the number of mislabeled atoms is very small (see the inset in this figure). Intuition-ally, it is natural to choose the threshold value, ξc, to be 6
for FCC-liquid interfaces. This approach is quite sufficient for the PEM which requires on-the-fly identification of solid-like atoms during the MD simulation. However, recent study shows that the choice ofξcconsiderably affects the value ofN∗
deter-mined from the MD snapshots.21We will return to this issue in Sec.V.
III. TEMPERATURE DEPENDENCE OF THE SLI FREE ENERGY
Figure2(a)shows a typical PEM simulation. The plateau indicates the appearance of the critical nucleus. Therefore the critical size N∗ can be directly measured by averaging the size at the plateau.11 To make a statistically sound descrip-tion of the nucleus shape, we first averaged the nucleus by superposing the configurations collected in a short time inter-val (∆t0= 10 ps) during the plateau. As shown in Fig.2(b), the
superposed configuration shows a clear non-spherical nucleus shape. Since the crystalline order fades at the interfacial region, it results in a less dense atomic distribution at the outer shell of the nucleus. In order to see the averaged nucleus shape more clearly, a Gaussian smearing scheme22–24was applied to con-vert the atomic distribution into the atomic density in the 3D space. By applying a fast-clustering algorithm25on the den-sity profile, we were able to extract the high-denden-sity points, which are essentially the as-formed crystalline sites. Then the
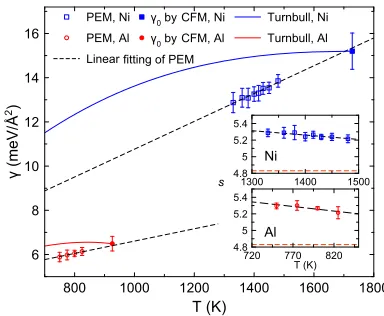
FIG. 3. The interfacial free energy as a function of the temperature for Ni and Al. The open squares and circles are the data obtained using the PEM. The error bars of PEM results are obtained by the error propagation of Eq.(3)
asσγ = 23s|∆µ|ρ
2/3
c N*
1 3
r
σ2
s s2 +
1 9
σ2
N∗
N∗2, whereσs,σN∗are the statistic uncertainties of the measurement ofsandN∗in the PEM simulations. The filled square and circle are the data obtained at the melting points of Ni and Al using the CFM.28The dashed lines are the linear fitting and extrapola-tions of the PEM data [γNi= 4.475 + 0.006 290T(meV/Å2) andγAl= 3.819 + 0.002 788T(meV/Å2)]. The solid lines are obtained from the Turnbull cor-relation. The insert shows the linear fitting of the measured shape factor as a function of the temperature for both systems. The red dashed line in the insets shows the shape factor of spherical assumption as the reference.
crystalline sites, which were occupied in at-least half of the snapshots collected during the time interval∆t0, were used
to construct the surface of the nucleus by the geometric sur-face reconstruction method26integrated in the OVITO (Open
Visualization Tool) software package,27as shown in Fig.2(b).
Finally, the shape factor swas computed based on the sur-face area Aand the volume V of the polyhedron computed from OVITO ass=A/V2/3. Figure2(c)shows the measured shape factor and the critical nucleus size as a function of the temperature for Ni. The shape factor clearly demonstrates a non-spherical shape. However, while the critical nucleus size
FIG. 2. (a) Nucleus size as a function of time in a typical PEM simulation for Ni at 1430 K. The blue dashed line shows the size of the embryo,N0, and the green
[image:6.594.330.522.46.204.2] [image:6.594.43.379.513.745.2]174501-4 Sunet al. J. Chem. Phys.149, 174501 (2018)
dramatically increases with the increase of the temperature, the shape factor shows only a slight decrease.
With the measured shape factor and the critical size, the interfacial free energyγcan be calculated by Eq.(3). Figure3 shows the obtained data for both Ni and Al. In both systems, the interfacial free energyγshows a nearly linear dependence on the temperature. Therefore, we fit the data with a linear relation to the temperature and extrapolate to the melting point. Figure3shows that within the accuracy of the measurement, the extrapolated interfacial free energies agree very well with the data obtained by CFM3for both Al and Ni.28
IV. CALCULATION OF THE NUCLEATION BARRIER
A straightforward application of the temperature depen-dence of the interfacial free energyγis to estimate the free energy barrier at very small and very large supercoolings where the PEM cannot be applied. The case of very small supercool-ing is interestsupercool-ing because it corresponds to the experimental conditions of solidification. The only way to judge about the reliability of the calculations here is to compare with the exper-imental data although both experexper-imental and computational data will be affected by the factors not related to the CNT (e.g., the quality of the employed semi-empirical potential in the case of simulation or the presence of impurities in the case of experiment). The case of very large supercooling in the case of pure metals is interesting because the nucleation rate can be directly obtained from the MD simulation. In this case, the quality of the employed semi-empirical potential is not an issue. However, the extrapolation to this temperature range may not work because of several other issues. For example, the temperature dependence of the SLI free energy can be dif-ferent than the one observed at higher temperatures. Another issue is associated with the fact that the critical nucleus at low temperatures becomes so small that the entire CNT concept may not be applicable.
[image:7.594.46.287.579.696.2]In the extrapolation of the nucleation barriers [see Eq.(2)], we used a linear fitting for the temperature dependences of the SLI free energy and the shape factor (see Fig.2). The obtained temperature dependences of the nucleation barriers are shown in Fig.4. The obtained temperature dependences well describe our PEM data, which was expected because these dependences
FIG. 4. The predicted temperature dependence of the nucleation barrier for Ni and Al. The PEM data of Ni are from Ref.11and the MFPT data of Ni are from Ref.29. The PEM and MFPT data of Al are measured in the current work. The error bars are obtained asσ∆G∗=12|∆µ|σN∗, whereσN∗are the uncertainties of the measurement ofN∗in the PEM simulations.
were obtained by fitting to the PEM data. The question is, if these dependences can be useful to predict the nucleation barrier in a temperature range where the PEM is not appli-cable? In the case of Ni, the nucleation barrier for the same semi-empirical potential was obtained atT = 1180 K29using
the combination of the mean first-passenger time (MFPT) method30–32 and the Fokker-Planck equation30,31,33 directly
from an unbiased MD simulation.34,35In the present work, we
used exactly the same approach to obtain the nucleation barrier for Al atT = 580 K. Figure4shows that the obtained MFPT data are in excellent agreement with the data we obtained using the temperature dependences of the SLI free energies.
V. DISCUSSION
In the present study, we obtained the temperature depen-dence of the SLI free energy at the moderate undercooling range where other existing techniques are not applicable. Therefore, to validate the obtained results, we extrapolated the obtained temperature dependences to the temperatures where well-established methods can be applied. Figure3shows that the extrapolation to the melting temperature agrees very well with the CFM data. It should be noted that contrary to the CFM which provides the SLI free energy as a function of the interface orientation, in the present study, we obtained the SLI free energy averaged over all orientation using the CNT framework [see Eq. (3)]. Therefore, we compare the current results to the γ0 value from the CFM [see Eq. (1) in Ref. 3]. This was reasonable for pure Ni and Al since the anisotropy of the SLI free energy is not very large for the pure fcc metals36,37at least at the melting temperature. More-over, the PEM provides ample statistics to measure the shape of the nucleus in the temperature range where it is appli-cable, and in the present work, we did not observe a very large deviation from the spherical nucleus shape. However, one should be cautious in the interpretation of the SLI free energy value obtained from the PEM in the case crystal phase with very anisotropic SLI free energy (e.g., see Fig. 10 in Ref.38).
174501-5 Sunet al. J. Chem. Phys.149, 174501 (2018)
FIG. 5. Dependence of the critical nucleus size in Ni determined from MD simulation on the choice of the order parameter (BOO or CA) or the threshold value in the BOO parameter.
agreement with the flat interface free energy data from the CFM. At low temperatures, we obtained good agreement with the brute-force MD simulation data, but the quantity we extracted includes not just the flat SLI free energy but also corrections associated with the SLI curvature. The authors of Ref.41argued that these corrections explain why the value of the SLI free energy obtained from the seeding simulations is always below that estimated from the Turnbull correlation42
which was proposed in Ref.34 to use to estimate the tem-perature dependence of the SLI free energy. The temtem-perature dependences of the SLI free energy obtained in the present study are also below the predictions based on the Turnbull correlation (see Fig.3).
[image:8.594.56.277.47.211.2]The main source of the uncertainty in the determined value of the SLI free energy comes from the uncertainty in determination of the number of atoms in the critical crystal cluster,N∗. This quantity can be rather sensitive to the choice of order parameters, as has been noted in Refs.21and43and can be seen in Fig.5. In addition to the BOO parameter, we also employed the cluster-alignment (CA) method23in which minimal root-mean-square deviations (RMSD) between the
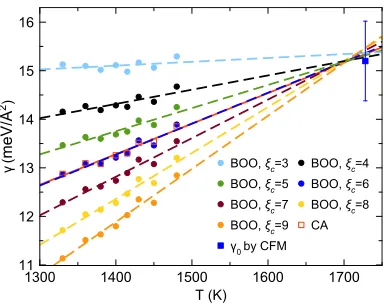
FIG. 6. The temperature dependence of the SLI free energy in Ni calculated with the critical nucleus sizes determined using different order parameters. The dashed lines indicate the linear fitting of the dots/squares with the same color.
FIG. 7. The temperature dependence of the nucleation barrier in Ni calculated with the critical nucleus sizes determined using different order parameters.
atom cluster and the perfect packing templates such as FCC, HCP, and BCC polyhedral are calculated for crystal-structure recognition. Interestingly, the CA order parameter leads to almost identical results comparing to the use of the BOO parameter with ξc = 6 which was assumed to be the most
reasonable value.
Figure6shows how the uncertainty inN∗caused by the choice of the order parameters propagates in the uncertainty of the SLI free energy determined within the present study. A vivid systematic difference can be seen. However, it is impor-tant that the temperature dependence remains qualitatively the same: no matter what order parameter we used, the obtained temperature dependence was linear. What is even more impor-tant is that all lines come to almost the same point which is in excellent agreement with the CFM value of the SLI free energy.
The extrapolation to low temperatures is shown in Fig.7. The obtained results indeed depend on the choice of the order parameter, and extreme choices can lead to considerable overestimations or underestimations of the nucleation barrier. However, the reasonable choice of the threshold value in the BOO parameter (ξc= 6) or using the CA order parameter
pro-vide excellent agreement with the brute-force MD simulation. Moreover, using slightly different values of the threshold value in the BOO parameter (ξc= 5 orξc= 7) lead to the variations
in the nucleation barrier value obtained by extrapolation of the PEM data within uncertainty of the brute-force MD simulation data.
VI. CONCLUSIONS
[image:8.594.71.263.555.707.2]174501-6 Sunet al. J. Chem. Phys.149, 174501 (2018)
SUPPLEMENTARY MATERIAL
Seesupplementary materialfor the latent heat dissipation, the analysis of the statistical uncertainty, and the pressure on the nucleus.
ACKNOWLEDGMENTS
The work at Ames Laboratory was supported by the US Department of Energy, Basic Energy Sciences, Materials Science and Engineering Division, under Contract No. DE-AC02-07CH11358, including a grant of computer time at the National Energy Research Supercomputing Center (NERSC) in Berkeley, CA. K.M.H. acknowledges support from USTC Qian-Ren B (1000-Talents Program B) fund. The Labora-tory Directed Research and Development (LDRD) program of Ames Laboratory supported the use of GPU computing.
1K. F. Kelton and A. L. Greer,Nucleation in Condensed Matter: Application
in Materials and Biology(Elsevier, Amsterdam, 2010).
2M. Asta, C. Beckermann, A. Karma, W. Kurz, R. Napolitano, M. Plapp,
G. Purdy, M. Rappaz, and R. Trivedi,Acta Mater.57, 941 (2009).
3J. J. Hoyt, M. Asta, and A. Karma,Phys. Rev. Lett.86, 5530 (2001). 4F. P. Buff, R. A. Lovett, and F. H. Stillinger,Phys. Rev. Lett.15, 621 (1965). 5D. Bedeaux and J. D. Weeks,J. Chem. Phys.82, 972 (1985).
6C. A. Becker, D. L. Olmsted, M. Asta, J. J. Hoyt, and S. M. Foiles,Phys. Rev. B79, 054109 (2009).
7B. B. Laird, R. L. Davidchack, Y. Yang, and M. Asta,J. Chem. Phys.131,
114110 (2009).
8F. Spaepen,Mater. Sci. Eng. A178, 15 (1994).
9X. M. Bai and M. Li,J. Chem. Phys.124, 124707 (2006).
10G. C. Sosso, J. Chen, S. J. Cox, M. Fitzner, P. Pedevilla, A. Zen, and
A. Michaelides,Chem. Rev.116, 7078 (2016).
11Y. Sun, H. Song, F. Zhang, L. Yang, Z. Ye, M. I. Mendelev, C. Z. Wang,
and K.-M. Ho,Phys. Rev. Lett.120, 085703 (2018).
12M. I. Mendelev, M. J. Kramer, C. A. Becker, and M. Asta,Philos. Mag.88,
1723 (2008).
13W. M. Brown, P. Wang, S. J. Plimpton, and A. N. Tharrington,Comput. Phys. Commun.182, 898 (2011).
14W. M. Brown, A. Kohlmeyer, S. J. Plimpton, and A. N. Tharrington,
Comput. Phys. Commun.183, 449 (2012).
15W. M. Brown and M. Yamada,Comput. Phys. Commun.184, 2785 (2013). 16M. W. Finnis and J. E. Sinclair,Philos. Mag. A50, 45 (1984).
17M. I. Mendelev, M. J. Kramer, S. G. Hao, K. M. Ho, and C. Z. Wang,Philos. Mag.92, 4098 (2012).
18P. J. Steinhardt, D. R. Nelson, and M. Ronchetti,Phys. Rev. B28, 784
(1983).
19P. Rein ten Wolde, M. J. Ruiz-Montero, and D. Frenkel,J. Chem. Phys.104,
9932 (1996).
20J. R. Espinosa, C. Vega, C. Valeriani, and E. Sanz,J. Chem. Phys.144,
034501 (2016).
21N. E. R. Zimmermann, B. Vorselaars, J. R. Espinosa, D. Quigley, W. R.
Smith, E. Sanz, C. Vega, and B. Peters,J. Chem. Phys.148, 222838 (2018).
22P. G. Kusalik and I. M. Svishchev,Science265, 1219 (1994).
23X. W. Fang, C. Z. Wang, Y. X. Yao, Z. J. Ding, and K. M. Ho,Phys. Rev. B
82, 184204 (2010).
24X. W. Fang, C. Z. Wang, S. G. Hao, M. J. Kramer, Y. X. Yao, M. I. Mendelev,
Z. J. Ding, R. E. Napolitano, and K. M. Ho,Sci. Rep.1, 194 (2011).
25A. Rodriguez and A. Laio,Science344, 1492 (2014). 26A. Stukowski,JOM66, 399 (2014).
27A. Stukowski,Model. Simul. Mater. Sci. Eng.18, 015012 (2010). 28S. R. Wilson and M. I. Mendelev,J. Chem. Phys.144, 144707 (2016). 29H. Song, Y. Sun, C. Z. Wang, K. M. Ho, and M. I. Mendelev,Phys. Rev.
Mater.2, 023401 (2018).
30J. Wedekind and R. Strey,J. Chem. Phys.126, 134103 (2007). 31J. Wedekind and D. Reguera,J. Phys. Chem. B112, 11060 (2008). 32J. Wedekind, G. Chkonia, J. W¨olk, R. Strey, and D. Reguera,J. Chem. Phys.
131, 114506 (2009).
33D. Reguera, J. M. Rub´ı, J. M. G. Vilar, and J. M. G. Vilar,J. Phys. Chem. B109, 21502 (2005).
34R. S. Aga, J. R. Morris, J. J. Hoyt, and M. Mendelev,Phys. Rev. Lett.96,
245701 (2006).
35S. E. M. Lundrigan and I. Saika-Voivod, J. Chem. Phys.131, 104503
(2009).
36J. J. Hoyt, M. Asta, and A. Karma,Mater. Sci. Eng. R: Rep.41, 121 (2003). 37S. R. Wilson and M. I. Mendelev,Model. Simul. Mater. Sci. Eng.22, 065004
(2014).
38S. R. Wilson and M. I. Mendelev,Philos. Mag.95, 224 (2015).
39S. Prestipino, A. Laio, and E. Tosatti,Phys. Rev. Lett.108, 225701 (2012). 40S. Prestipino, A. Laio, and E. Tosatti,J. Chem. Phys.140, 094501 (2014). 41M. Ambler, B. Vorselaars, M. P. Allen, and D. Quigley,J. Chem. Phys.146,
074701 (2017).
42D. Turnbull,J. Appl. Phys.21, 1022 (1950).
43B. Cheng, G. A. Tribello, and M. Ceriotti,Phys. Rev. B92, 180102(R)