“psyosphere”
A GPS Data Analysing Tool for the Behavioural Sciences Benjamin Ziepert
Master Psychology of Conflict, Risk and Safety University of Twente
1st Supervisor University of Twente: Dr. Ir. Peter W. de Vries
Abstract
Positioning technologies (PT) such as GPS are widespread in society but are used only sparingly in behavioural science research. The current study attempts to unlock PT potential for behavioural science studies by developing a research tool to analyse GPS tracks, and by giving an overview of behavioural variables that can be studied with PTs. To test the research tool and to find more links between behavioural variables and PTs, we conducted two similar experiments. During the experiments, participants were placed in teams and carried cards with either a hostile or non-hostile task from a start to finish area. At the finish area the participants had to avoid guards, in order that their cards would not be confiscated. After each of three rounds the participants filled out a questionnaire to measure mental states related to hostile intent. The results show that the participants collectively changed their strategies on how to avoid guards, with each consecutive Round, and that mental states, such as fear, can be linked to changes in GPS variables, such as walking closer together. The current study demonstrates that behavioural experiments can be performed with GPS, outside of a laboratory setting.
Acknowledgments
First of all, I want to thank my parents for their many years of support. Since my early childhood my parents always encouraged my academic interests and none of my many projects would have been possible without them, including this thesis.
Further, I would like to thank Dr. Peter W. de Vries and Dr. Elze G. Ufkes for their never-ending and extraordinary support for my thesis. Peter’s and Elze’s patience and feedback allowed me to greatly improve my academic skills and to discover new and exciting statistical methods.
Especially Peter provided me again and again with opportunities to give lectures about what I have learned for this study, let me supervise students that used my research tools for their thesis, and let me present my research to other researchers. I am very thankful for all these great opportunities.
I also want to thank the head of the department Prof. Dr. Ellen Giebels. Ellen asked me as a bachelor student to help develop an experiment for all students of an undergraduate course and to create a research tool to analyse the data. The experiment and research tool created the basis for this thesis. Later, Ellen included me in a research project for the Dutch TV show Hunted and allowed me to test my new data analysis tool “psyosphere” as part of
the project.
I’m very grateful for my girlfriend Çiğdem. She motivated me every day to stay focused, gave me valuable feedback, and she was supportive even when I had to work on our free days.
“psyosphere”
A GPS Data Analysing Tool for the Behavioural Sciences
Positioning technologies (PTs) such as Global Positioning Systems (GPS), Glonass and Galileo can be used to determine the position on the globe and to record for instance the movement of planes, cars, and individuals (Hofmann-Wellenhof, Lichtenegger, & Wasle, 2007). PTs are now omnipresent in mobile devices such as smart phones, tablets, and laptops. It could for instance be used to identify people with early warnings signs for depression (Palmius et al., 2017; Saeb et al., 2015), partly or fully replace self-reported diaries in traffic research (Bohte & Maat, 2009; Schuessler & Axhausen, 2009; Stopher, Bullock, & Horst, 2002; J. Wolf, 2006), determine how populations behave after a disaster such as an earth quake (Bengtsson, Lu, Thorson, Garfield, & Von Schreeb, 2011), or to automatically detect active pickpockets in a shopping mall (Bouma et al., 2014). This omnipresence makes PTs potentially interesting to study behaviour in naturalistic settings. Surprisingly, behavioural scientists use PTs only to a small extent.
In this paper we argue that there are two reasons why PTs have largely been neglected in behavioural research. First, the data are too complex to analyse with software that traditionally were used in the social sciences, such as IBM SPSS Statistics (SPSS). Second, only a limited number of studies investigated the relationship between psychological variables and PT data. Consequently, little information is available which psychological variables could be studied with PTs. Therefore, the aim of this study is to develop a tool that enables behavioural scientists to make readily use of PTs to study movement and to give an overview of psychological variables that can be studied with PTs.
great use in the past (Axhausen, Zimmermann, Schönfelder, Rindsfüser, & Haupt, 2002; Doherty & Miller, 2000; Goodchild & Janelle, 1984; Janelle, Goodchild, & Klinkenberg, 1988; Shoval et al., 2010). These conventional methods to measure movement come with drawbacks that may be circumvented by using PTs instead. According to Shoval et al. (2010), the main obstacle is the information provided by participants. For example, people frequently underreport trips that are small, and people also underreport trips that do not start or end at home. Moreover, participants that drive a car underestimate their travel time whereas public transportation users overestimate their travel time (Ettema, Timmermans, & van Veghel, 1996; Stopher, 1992). Furthermore, participants can consciously omit information, for instance, if answers or not socially desirable. Finally, the interviewer could fail to prompt recall (interviewer error), or the participants could simply forget the information over time (recall bias; Anderson, 1971; Golledge, 1997; Vazquez-Prokopec et al., 2009). These limitations can be compensated by using PTs such as GPS (Bohte & Maat, 2009).
Benefits of PTs
the benefit of recording additional data such as speed and acceleration which can be used for additional analysis (J. Wolf et al., 2004).
Next to these examples from traffic research, there are studies in other areas that employed PTs to replace or augment traditional methods of movement tracking. Particularly, research with target groups that are unable to maintain a self-reported diary and where observers would be especially expensive. For instance, for the mentally impaired, children and the elderly it may be difficult or even impossible to maintain a diary (Shoval et al., 2011). Traditionally, caretakers or family members were used to monitor those participants and noted the activities or filled in behavioural checklists for them (Shoval et al., 2011). Using caretakers or family members can be quite expensive, burdensome and biased. Moreover, Isaacson, Shoval, Wahl, Oswald, and Auslander (2016) argue that researchers may even avoid doing experiments with these target groups at all, because of these obstacles.
For groups that cannot maintain a diary, PTs such as GPS loggers can be an option to replace observers (Isaacson et al., 2016; Shoval et al., 2010; Shoval et al., 2008; Shoval et al., 2011). A critic could wonder whether a participant who is unable to fill in a diary would be able to handle the complex protocol for using sensors. Fortunately, research has shown that the mentally impaired and the elderly are indeed able to follow these protocols (Isaacson et al., 2016).
connected to a processor, but this is not always possible with GPS loggers. Third, the analysis can be scaled up relatively easily. Therefore, it is possible to use the pickpocket classification algorithm on a larger airport by buying more sensors, for a fraction of the costs necessary to hire and train more security personnel. Fourth and finally, the analysis can be transferred easily. Once the technology is developed, it can be used on separate locations with a comparable small investment cost. For instance, installing new hardware and sensors can be cheaper than hiring and training new observers for a new location.
PT usage in past research
Table 1
PTs and Their Use in Past Research
Measures Research
Anxiety, depression, or lifestyle (e.g. positive affect or extraversion)
Determining relationship between active versus sedentary lifestyle, social anxiety and depression, and number places visited with GPS (Huang et al., 2016; Saeb, Lattie, Schueller, Kording, & Mohr, 2016; P. S. A. Wolf et al., 2013).
Community specific routes description and
visualisation
Measuring segregation in city communities with GPS (Davies et al., 2017; Whyatt et al., 2017).
Depression detection Detecting depression from GPS movement data characteristics such as location variance, home stay, or mobility between favourite locations (Palmius et al., 2017; Saeb et al., 2015).
Environmental exposure Measuring daily environmental exposure with GPS (Chaix et al., 2013; Phillips, Hall, Esmen, Lynch, & Johnson, 2001).
Following and leadership detection
Detecting leadership and followership with movement patterns (e.g. co-moving) with Wi-Fi data. (Kjargaard et al., 2013).
Information or disease spreading characteristics
Studying information spreading in face-to-face networks with Bluetooth, RFID and Wi-Fi (Isella, Romano, et al., 2011; Isella, Stehlé, et al., 2011; Madan, Moturu, Lazer, & Pentland, 2010).
Physical activity Measuring physical activity of children, the elderly or other target groups with GPS (Elgethun, Fenske, Yost, & Palcisko, 2002; Fjørtoft, Kristoffersen, &
Sageie, 2009; Isaacson, D’Ambrosio, Samanta, & Coughlin, 2015; Krenn, Titze,
Oja, Jones, & Ogilvie, 2011; Maddison & Ni Mhurchu, 2009; Shoval et al., 2011).
Pickpocket detection Detecting pickpockets with movement characteristics (e.g. walking speed) measured with security cameras (Bouma et al., 2014).
Population movement characteristics
Studying population behaviour after a disaster with GSM (Bengtsson et al., 2011).
Risk seeking Measuring speeding as a form of risk seeking with GPS (Bolderdijk et al., 2011).
Travel characteristics such as travel mode, route choice or speed
Studying travel behaviour such as travel mode, route choice or speed with GPS (Bohte & Maat, 2009; Draijer, Kalfs, & Perdok, 2000; Murakami & Wagner, 1999; Necula, 2015; Schuessler & Axhausen, 2009; Stopher et al., 2002; J. Wolf, 2000, 2006; J. Wolf et al., 2004).
Virus transmission risk Studying the spreading of disease with GPS (Vazquez-Prokopec et al., 2013; Vazquez-Prokopec et al., 2009).
As can be seen in Table 1, there are only a small number of studies investigating the link between The past research (see Table 1) contains only a small number of studies that investigated the link between PT data and psychological variables, such as personality or mental states (e.g., Palmius et al., 2017; Saeb et al., 2015). Therefore, we want to investigate if more psychological variables, than mentioned in Table 1, can be linked to PT data.
Laboratory studies have shown that behaviour may become overt as a result of psychological variables. For instance, sad, depressed and frightened people tend to walk slower than others, and joy and anger are linked to increased walking speed (Barliya, Omlor, Giese, Berthoz, & Flash, 2012; Gross, Crane, & Fredrickson, 2012; Michalak et al., 2009). Other research indicates that personality traits such as agreeableness are also linked to increased walking speed (Satchell et al., 2017).
Hostile intent and movement
Research outside of the laboratory has shown that motivation or conscious decisions such as pickpocketing corresponds with specific body movement (Bouma et al., 2014). Their algorithms to detect pickpockets based on variations in walking speed, orientation change or distance to other people were shown have a sensitivity up to 95.6% with 0.5% false alarms.
detection and further research is needed. Therefore, the current study will investigate if the mental processes can be linked to measurable changes in movement.
The mental processes of transporting an illegal package are linked to hostile intent. Wijn et al. (2017) define hostile intent “as an individual’s intent to act in ways that imply or aim to inflict harm onto others.” (p. 2). People with hostile intent try to hide it when they expect that others will try to prevent their actions (DePaulo et al., 2003; Ekman, Friesen, & O'sullivan, 1988; Koller, Wetter, & Hofer, 2016; Wijn et al., 2017).
Wijn et al. (2017) argue that persons with hostile intent have a heightened state of self-saliency and interpret cues in the surroundings as to be connected to them. A cue could, for instance, be a police guard looking in the direction of that person. This cue can cause a fear-related response pattern (e.g. fight or flight) and the person will try to supress the fear response in order not to attract the attention of the guard. In other words, a person with hostile intent will try to act normal. This suppression of fear-related responses is a cognitive effortful process and can be constrained, by other cognitive tasks (e.g. counting), or fatigue. Therefore, people with hostile intent should show more deviant behaviour if they have an increased cognitive load and get cues from the environment that they perceive as related to them (Wijn et al., 2017).
As an example, it could be argued that an unexpected route change by construction works at an airport could increase the cognitive load. When someone needs to reorient him- or herself in an unfamiliar environment it increases the cognitive load and therefore limits the
person’s ability to suppress fear related responses. Additionally, more security guards could act as a cue to trigger detectable behaviour changes (Wijn et al., 2017).
behavioural scientists such as SPSS. SPSS is a specialised software to perform statistical analysis which is not suitable to handle geospatial data and analysis. Therefore, we developed a data analysis software with the aim to enable behavioural scientist to analyse movement data without the need of additional special expertise.
Out of the variety of PTs we decided to focus on GPS for our tool. GPS can be used all over the globe and does not depend on local GSM, Wi-Fi or other infrastructure. GPS is also omnipresent in smart phones or other devices, and dedicated GPS loggers are affordable. The data analysis software will work with longitude, latitude and timestamp data points that are typical for GPS loggers. The movement data from other PTs such as GSM and Wi-Fi data can be converted to be used with the same software once it is converted to longitude and latitude. The tool will be a R package and is called “psyosphere” (Ziepert, Ufkes, & de Vries, 2018; see Appendix 3). R is an open-source programming language and data-analysis tool that is becoming more widespread (Muenchen, 2012). The choice for R has several benefits: since R is used by psychologists and computer scientists it could improve cooperation of interdisciplinary teams, the software is free of charge and therefore easier accessible than for instance SPSS, there are pre-existing packages for spherical calculations and handling of GPS data (e.g. Hijmans, Williams, & Vennes, 2015; Kahle & Wickham, 2013; Loecher & Ropkins, 2015; Wickham, 2016), and since R is open source the software can be improved upon by the research community.
The current study
et al., 2009). To find more psychological variables that are linked to movement, we want to determine whether mental states related to hostile intent result in changes in descriptive movement variables measured with GPS. Two experiments were conducted that were part of an undergraduate course for psychology students. During the experiments the participants would wear GPS loggers and were to transport cards with supposedly legal and illegal tasks from a start to finish area. In the finish area the participants had to avoid guards that could confiscate the cards. After each Round, the participants would fill in a questionnaire to measure the mental states.
Methods
Participants
We conducted two experiments as part of an undergraduate psychology course at the University of Twente. The first experiment took place in 2014 and the second in 2015. The experiments are similar to each other and we did not conduct an analysis between the experiments. In the first experiment 64 students participated, two were excluded from the analysis due to sensor failure, and 62 students (44 female and 18 male) remained. The average age was 21.61 (SD = 5.60) and ranged from 18 to 37. Furthermore, 30 students were Dutch and 32 were German. In the second experiment 93 students participated, 19 students were excluded from the analysis due to a lack of sensors or sensor failure, and 74 students (51 female and 23 male) remained. The average age was 22.41 (SD = 5.60) and ranged from 18 to 46. Moreover, 38 students were Dutch and 34 were German. The participants that acted as guards were excluded from analysis to limit the scope of the current study.
Procedure
written instructions. They had the possibility to ask questions and afterwards signed an informed consent form. The participants were randomly assigned into teams of five to six people or got an individual task. The participants received a GPS logger and were told to gather three hours later in a small park on the university campus.
Tasks. The teams (smugglers) had the tasks to transport supposed contraband during the experiment and the individual assignment for the other participants was to find the participants with contraband (guards). The contraband was a paper card with the size of a card game card. On the card was either an image of cocaine (illegal card) or flour (legal card) printed and with a text indicating the same. Both teams and guards could gain points by fulfilling their task and it was announced that the best team and best guard would win a price. The price was a voucher for a cinema and a bar of chocolate for each winning team member and guard.
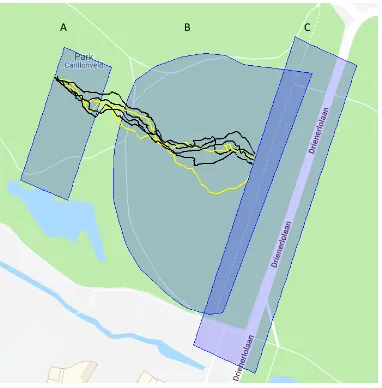
Figure 1. Experiment area with participant tracks and GPS polygons. The tracks of six team members in Experiment 2 are plotted in black (illegal card) and yellow (legal card). The
tracks begin in the start polygon (A), enter the line of sight for guards’ polygon (B) and end before the finish polygon (C).
Contraband. The teams would receive the legal and illegal cards at the starting area, they had to distribute it and each participant had to carry exactly one. The cards stated that the teams would win ten points for each illegal card they transported and one point for each legal card. The legal card also stated that the guards would lose a point if they took a legal card from a team member. Before starting the teams had to write a number on the card that was matched to their GPS logger and the starting time.
Round. The teams were instructed to walk from the starting area, across the park and through the finish area. The guards could confiscate the team members card by tapping them on their shoulder. The team member would give their card to the guard and the guard would note a number on the card which was assigned to the guard. The team members had to avoid being checked by the guards. This could be done by for instance distracting them by sending the team members with legal cards first or walking with a wide distance among each other therefore it would be difficult for the guards to reach all team members before they crossed the finish area. The guards were not allowed to leave the finish area and had to wear safety vests to enable the team members to spot them easily. Each time after crossing the finish area the team members would drop the remaining cards they had into a box and fill in a questionnaire. After this they would walk back to the start position for another Round.
Experiment 2. In Experiment 2, three participants had the task to be guards and the other participants were assigned into teams between four and seven team members with an average of 5.69. Furthermore, the instruction not to run was omitted, and the participants were not wearing any stress sensors or team numbers. At the starting area the teams could choose freely the ratio of illegal and legal cards and they were asked to write down which strategy they wanted to use. Afterwards, each team would start separately, and when approaching the finish area, the ratio between participants and guards was 0.54. Additionally, the finish area in Experiment 2 was larger than in Experiment 1 and enabled the guards to walk more freely. At the end of each Round, the team members would write down their points and could see the total points of the other teams. Finally, they would only fill in an English version of the State questionnaire. Some questions were removed and added in the State questionnaire (see Appendix 1) and additionally the teams were asked to rank how they perceived every team member as a leader and how they could improve their strategy as a team in the next Round. The guards were frequently told how many points each guard had. Measures
State questionnaire. The mental states of the participants were measured with a questionnaire based on the research by Wijn et al. (2017) and Stekkinger (2012) to measure hostile intent and related constructs. Some questions have changed to fit the current study and two questions were added to measure self-observed behaviour changes. For instance, whether the participants changed their pace after seeing the guards. Table 2 contains all questions, and the Cronbach’s alpha or Pearson's R for the state questionnaire constructs when applicable. The reliability for each scale where we calculated Cronbach’s alpha, the index was above .78 (see Table 2). All State questions used a 7-point Likert scale from 1 “Not
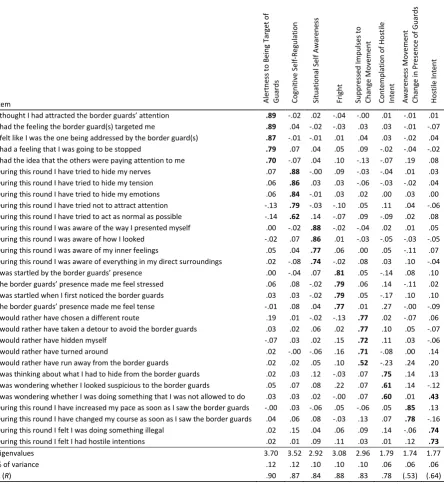
Two items checked whether participants felt that they had hostile intentions (Hostile Intent; Stekkinger, 2012; Wijn et al., 2017). Five items measured the participants alertness to threats from the guards (Alertness to Being Target of Guards; Galbraith, Manktelow, & Morris, 2008; Stekkinger, 2012; Wijn et al., 2017). Five items checked the inhibitory and activation control (Cognitive Self-Regulation; Stekkinger, 2012; Wijn et al., 2017). Four items measured the self-focus of the participants (Situational Self Awareness; Govern & Marsch, 2001; Stekkinger, 2012; Wijn et al., 2017). Four items assessed the feelings of fright that the participants felt through the presence of the guards (Frightened by Presence of Guards; Stekkinger, 2012; Wijn et al., 2017). Five items checked the impulses that were suppressed by the participants (Suppressed Impulses to Change Movement; Stekkinger, 2012). Three items measured the extent that participants questioned themselves (Contemplation of Hostile Intent; Stekkinger, 2012; Wijn et al., 2017). Finally, two items are added to the questionnaire and assessed the self-observed behaviour changes (Awareness Movement Change in Presence of Guards; Stekkinger, 2012). For a detailed explanation of the mental processes and their function see Wijn et al. (2017).
route from start to finish. Variation Route Deviation is the standard deviation of the Route Deviation for each data point.
Analysis
GPS data preparation. The data from the GPS loggers were exported and analysed with the R package “psyosphere”, which was developed for the current study (Ziepert et al., 2018). The software created a track for each Round of each participant, and plotted the tracks on a map, which was retrieved from google maps (Google LLC, 2018). See Figure 1 for the tracks and map. A track began in the starting area that was determined by a polygon of GPS coordinates (A) and ended when the participants crossed a GPS based finish line behind the finish area (B). The R package also marked automatically from which point the teams and guards could see each other based on a polygon of GPS coordinates (C). Before the point of visibility, the teams followed generally a straight line and started to change their movement mostly after seeing the guards. Therefore, the analysis included only the data from when the teams were visible to the guards, until the members crossed the finish line. Within line of sight of the guards 31,113 coordinates were recorded in Experiment 1, for four rounds, and 17,172 in Experiment 2, for three rounds. Based on this data, the R package calculated the GPS variables that are mentioned above.
coordinates (0.89%) in Experiment 2 were excluded because of a time difference larger than one second.
State PCA. We analysed the State questions that were used in both experiments with a principal component analysis (PCA). In total, we conducted six explorative PCAs, one for each of the three rounds in the two experiments. Afterwards, we compared the PCAs and counted how often items shared a component. A model with eight components emerged and we testes this model with a confirmatory PCA. For the confirmatory analysis, the data of the six rounds over the two experiments were analysed together.
a maximum random effects structure converged and two models did not converge. Intra-Team Distance was excluded from the outlier removal since this increased the model convergence rate.
Exclusions. Only the first three rounds of both experiments were used since the participants did not complete the State questionnaire after the fourth Round of Experiment 1. The stress sensor data was not used due to faulty data; answers to strategy, leadership and motivation questions were not analysed to limit the scope of the current study and could be analysed in a follow up study.
Results
Factor Analysis
Table 2
PCA Pattern Matrix for the State Questionnaire
Item Ale
rt ne ss t o B ei ng T ar ge t o f G ua rds C o gni ti ve S el f-R eg ul at io n Si tua ti o na l Se lf Awar ene ss Fr ig ht Sup pr ess ed Im pu lse s to C ha ng e M o ve m ent C o nt em pl at io n o f Hos ti le Int ent A war ene ss M o ve m ent C ha ng e i n P re se nc e o f G ua rds H o st ile In te n t
I thought I had attracted the border guards’ attention .89 -.02 .02 -.04 -.00 .01 -.01 .01 I had the feeling the border guard(s) targeted me .89 .04 -.02 -.03 .03 .03 -.01 -.07 I felt like I was the one being addressed by the border guard(s) .87 -.01 -.01 .01 .04 .03 -.02 .04
I had a feeling that I was going to be stopped .79 .07 .04 .05 .09 -.02 -.04 -.02
I had the idea that the others were paying attention to me .70 -.07 .04 .10 -.13 -.07 .19 .08 During this round I have tried to hide my nerves .07 .88 -.00 .09 -.03 -.04 .01 .03 During this round I have tried to hide my tension .06 .86 .03 .03 -.06 -.03 -.02 .04 During this round I have tried to hide my emotions .06 .84 -.01 .03 .02 .00 .03 .00 During this round I have tried not to attract attention -.13 .79 -.03 -.10 .05 .11 .04 -.06 During this round I have tried to act as normal as possible -.14 .62 .14 -.07 .09 -.09 .02 .08 During this round I was aware of the way I presented myself .00 -.02 .88 -.02 -.04 .02 .01 .05
During this round I was aware of how I looked -.02 .07 .86 .01 -.03 -.05 -.03 -.05
During this round I was aware of my inner feelings .05 .04 .77 .06 .00 .05 -.11 .07
During this round I was aware of everything in my direct surroundings .02 -.08 .74 -.02 .08 .03 .10 -.04
I was startled by the border guards’ presence .00 -.04 .07 .81 .05 -.14 .08 .10
The border guards’ presence made me feel stressed .06 .08 -.02 .79 .06 .14 -.11 .02 I was startled when I first noticed the border guards .03 .03 -.02 .79 .05 -.17 .10 .10
The border guards’ presence made me feel tense -.01 .08 .04 .77 .01 .27 -.00 -.09
I would rather have chosen a different route .19 .01 -.02 -.13 .77 .02 -.07 .06
I would rather have taken a detour to avoid the border guards .03 .02 .06 .02 .77 .10 .05 -.07
I would rather have hidden myself -.07 .03 .02 .15 .72 .11 .03 -.06
I would rather have turned around .02 -.00 -.06 .16 .71 -.08 .00 .14
I would rather have run away from the border guards .02 .02 .05 .10 .52 -.23 .24 .20 I was thinking about what I had to hide from the border guards .02 .03 .12 -.03 .07 .75 .14 .13 I was wondering whether I looked suspicious to the border guards .05 .07 .08 .22 .07 .61 .14 -.12 I was wondering whether I was doing something that I was not allowed to do .03 .03 .02 -.00 .07 .60 .01 .43
During this round I have increased my pace as soon as I saw the border guards -.00 .03 -.06 .05 -.06 .05 .85 .13 During this round I have changed my course as soon as I saw the border guards .04 .06 .08 -.03 .13 .07 .78 -.16 During this round I felt I was doing something illegal .02 .15 .04 .06 .09 .14 -.06 .74
During this round I felt I had hostile intentions .02 .01 .09 .11 .03 .01 .12 .73
Eigenvalues 3.70 3.52 2.92 3.08 2.96 1.79 1.74 1.77
% of variance .12 .12 .10 .10 .10 .06 .06 .06
α (R) .90 .87 .84 .88 .83 .78 (.53) (.64)
Table 3
PCA Structure Matrix for the State Questionnaire
Item Ale
rt ne ss t o B ei ng T ar ge t o f G ua rds C o gni ti ve Se lf -R eg ul at io n Si tua ti o na l Se lf Awar ene ss Fr ig ht ene d by P re se nc e o f G ua rds Sup pr ess ed Im pu lse s to C ha ng e M o ve m ent C o nt em pl at io n o f Hos ti le Int ent A war ene ss M o ve m ent C ha ng e i n P re se nc e o f G ua rds H o st ile Int en t
I felt like I was the one being addressed by the border guard(s) .89 .13 .19 .26 .38 .10 .11 .20
I thought I had attracted the border guards’ attention .88 .11 .20 .20 .32 .07 .09 .15
I had the feeling the border guard(s) targeted me .88 .15 .17 .20 .35 .09 .10 .09
I had a feeling that I was going to be stopped .85 .22 .24 .31 .42 .09 .12 .18
I had the idea that the others were paying attention to me .71 .08 .21 .30 .22 -.00 .28 .23
During this round I have tried to hide my nerves .21 .91 .34 .41 .26 .22 .20 .27
During this round I have tried to hide my tension .18 .87 .35 .34 .20 .21 .15 .25
During this round I have tried to hide my emotions .20 .87 .32 .36 .28 .25 .20 .24
During this round I have tried not to attract attention -.03 .77 .24 .17 .18 .31 .15 .10 During this round I have tried to act as normal as possible .01 .65 .33 .20 .20 .14 .15 .23 During this round I was aware of the way I presented myself .18 .30 .88 .17 .12 .26 .20 .23
During this round I was aware of how I looked .15 .34 .85 .16 .09 .18 .15 .15
During this round I was aware of my inner feelings .23 .35 .81 .24 .18 .28 .12 .27
During this round I was aware of everything in my direct surroundings .20 .22 .75 .17 .21 .24 .27 .16
I was startled by the border guards’ presence .27 .29 .24 .88 .40 .02 .36 .41
I was startled when I first noticed the border guards .28 .31 .17 .87 .39 -.02 .36 .41 The border guards’ presence made me feel stressed .30 .40 .22 .85 .43 .26 .20 .36
The border guards’ presence made me feel tense .22 .42 .28 .81 .38 .39 .29 .27 I would rather have taken a detour to avoid the border guards .34 .27 .22 .35 .82 .31 .29 .19
I would rather have chosen a different route .45 .19 .13 .23 .79 .19 .14 .24
I would rather have turned around .33 .23 .10 .47 .79 .11 .25 .36
I would rather have hidden myself .25 .29 .19 .43 .78 .31 .28 .21
I would rather have run away from the border guards .31 .24 .20 .45 .65 .00 .43 .40
I was thinking about what I had to hide from the border guards .16 .35 .41 .23 .35 .85 .34 .32 I was wondering whether I looked suspicious to the border guards .21 .37 .35 .38 .36 .70 .34 .15 I was wondering whether I was doing something that I was not allowed to do .18 .33 .32 .29 .35 .70 .22 .57
During this round I have increased my pace as soon as I saw the border guards .11 .21 .18 .34 .23 .20 .87 .29 During this round I have changed my course as soon as I saw the border guards .18 .24 .29 .27 .35 .25 .82 .07 During this round I felt I was doing something illegal .23 .41 .31 .43 .38 .32 .18 .84
During this round I felt I had hostile intentions .23 .29 .33 .46 .33 .20 .33 .83
Note. Component loadings that are higher than or equal to .40 are in bold. Data of all experiments and rounds are analysed together.
Descriptive Statistics
Experiment 1 (M1 = 0.41, M2 = 0.88). In Experiment 1 each team had only two illegal cards to
distribute, and in Experiment 2 the teams could choose a free ratio of cards and chose on average more illegal cards than in Experiment 1. Also, Hostile Intent was higher in Experiment 2 than in Experiment 1 (M1 = 2.36 M2 = 3.02). To determine the relationship
between Illegal Card Selection and Hostile Intent an independent t test was conducted. The test results show that there was a significant difference in Hostile Intent for Experiment 1 when the illegal card was chosen (M1=3.07, SD1 = 1.87) than when the legal card was chosen
(M1=1.88, SD1 = 1.07) with t1(112) = -5.11, p1 < .001, and Cohen’s d1 = 0.83. Similarly, there
was also a significant difference in Hostile Intent for Experiment 2 when the illegal card was chosen (M2=3.10, SD2 = 1.64) than when the legal card was chosen (M2=2.46, SD2 = 1.31)
with t2 (49.04) = -2.60, p2=.012, and Cohen’s d2 =0.41. The results of both experiments
demonstrate that participants who chose an illegal card reported a higher feeling of hostile intent than participants who chose a legal card, and this relationship was stronger in Experiment 1 than in Experiment 2. A reason for the stronger relationship in Experiment 1 could be that, in Experiment 1, each team had fewer illegal cards to distribute. The illegal cards scored ten points for the team and the legal cards scored one point, therefore, the illegal cards were important to become the team with the highest score. Since the illegal cards were limited in Experiment 1, it was important to carry the illegal cards successfully, that is, without being checked by the guards, to achieve the highest score. By comparison, in Experiment 2, there were unlimited illegal cards which created overall higher self-reported feelings of Hostile Intent but put less stress on the individual that carried an illegal card.
the second experiment. Consequently, in Experiment 1 the Speed was 4.59 kilometres per hour and 6.01 kilometres per hour in Experiment 2. Additionally, the Speed Variation was 1.43 in Experiment 1 and 4.04 in Experiment 2. It appears that, the warning not to run in Experiment 1 led to a decreased Speed and Speed Variation, compared to Experiment 2.
Other difference between the experiments are the Intra-Team Distance, Route Deviation, and Variation Route Deviation. During Experiment 1 the participants walked closer together than in Experiment 2 (M1 = 9.59, M2 = 12.65). Additionally, the Route Deviation was
larger in Experiment 2 than in Experiment 1 (M1 = 7.53, M2 = 11.39), and also, the Variation
Route Deviation was larger in Experiment 2 (M1 = 3.15, M2 = 4.77). A likely explanation for the
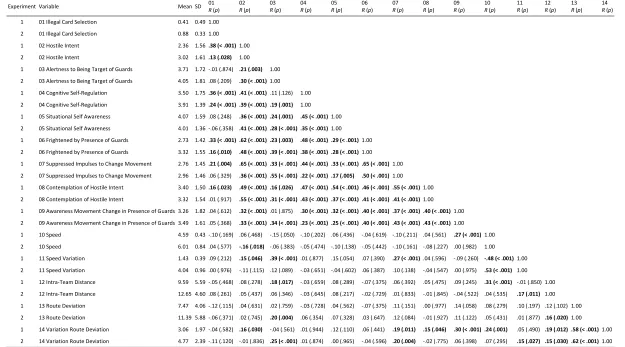
differences, in Intra-Team Distance, Route Deviation, and Variation Route Deviation, could be that the participants in Experiment 2 had to avoid the guards more than in Experiment 1, since there were more guards per participant at the finish area in Experiment 2. Specifically, the ratio between guards and participants was 0.24 in Experiment 1 and 0.54 in Experiment 2. Correlations. Table 4 illustrates that the State variables frequently correlate with each other significantly, and the GPS variables correlate only partly with each other or with the State variables. GPS variables that correlate with each other in both experiments are for instance Variation Route Deviation and Intra-Team Distance (R1 = .19, p1 = .012, R2 =.15, p2 = .030), and this means that teams which varied more in their route also had a longer
distance to their team members. A reason could be that some participants avoided the guards by changing their route, other team members did not do so, and therefore the distance between the participants increased. Additionally, Speed and Speed Variation (R1 = -.48, p1 < .001, R2 =.53, p2 < .001), and Route Deviation and Variation Route Deviation (R1 = .58, p1 < .001, R2 =.62, p2 < .001) correlated with each other. In both pairs, the relationships could
Table 4 1
Mean, SD and Correlation Coefficients of State Variables
2
Experiment Variable Mean SD 01 R (p)
02 R (p)
03 R (p)
04 R (p)
05 R (p)
06 R (p)
07 R (p)
08 R (p)
09 R (p)
10 R (p)
11 R (p)
12 R (p)
13 R (p)
14 R (p) 1 01 Illegal Card Selection 0.41 0.49 1.00
2 01 Illegal Card Selection 0.88 0.33 1.00 1 02 Hostile Intent 2.36 1.56 .38 (< .001) 1.00 2 02 Hostile Intent 3.02 1.61 .13 (.028) 1.00 1 03 Alertness to Being Target of Guards 3.71 1.72 -.01 (.874) .21 (.003) 1.00 2 03 Alertness to Being Target of Guards 4.05 1.81 .08 (.209) .30 (< .001) 1.00 1 04 Cognitive Self-Regulation 3.50 1.75 .36 (< .001).41 (< .001) .11 (.126) 1.00 2 04 Cognitive Self-Regulation 3.91 1.39 .24 (< .001).39 (< .001).19 (.001) 1.00 1 05 Situational Self Awareness 4.07 1.59 .08 (.248) .36 (< .001).24 (.001) .45 (< .001) 1.00 2 05 Situational Self Awareness 4.01 1.36 -.06 (.358) .41 (< .001).28 (< .001).35 (< .001) 1.00 1 06 Frightened by Presence of Guards 2.73 1.42 .33 (< .001).62 (< .001).23 (.003) .48 (< .001).29 (< .001) 1.00 2 06 Frightened by Presence of Guards 3.32 1.55 .16 (.010) .48 (< .001).39 (< .001).38 (< .001).28 (< .001) 1.00 1 07 Suppressed Impulses to Change Movement 2.76 1.45 .21 (.004) .65 (< .001).33 (< .001).44 (< .001).33 (< .001).65 (< .001) 1.00 2 07 Suppressed Impulses to Change Movement 2.96 1.46 .06 (.329) .36 (< .001).55 (< .001).22 (< .001).17 (.005) .50 (< .001) 1.00 1 08 Contemplation of Hostile Intent 3.40 1.50 .16 (.023) .49 (< .001).16 (.026) .47 (< .001).54 (< .001).46 (< .001).55 (< .001) 1.00 2 08 Contemplation of Hostile Intent 3.32 1.54 .01 (.917) .55 (< .001).31 (< .001).43 (< .001).37 (< .001).41 (< .001).41 (< .001) 1.00 1 09 Awareness Movement Change in Presence of Guards 3.26 1.82 .04 (.612) .32 (< .001) .01 (.875) .30 (< .001).32 (< .001).40 (< .001).37 (< .001).40 (< .001) 1.00 2 09 Awareness Movement Change in Presence of Guards 3.49 1.61 .05 (.368) .33 (< .001).34 (< .001).23 (< .001).25 (< .001).40 (< .001).43 (< .001).43 (< .001) 1.00 1 10 Speed 4.59 0.43 -.10 (.169) .06 (.468) -.15 (.050) -.10 (.202) .06 (.436) -.04 (.619) -.10 (.211) .04 (.561) .27 (< .001) 1.00 2 10 Speed 6.01 0.84 .04 (.577) -.16 (.018) -.06 (.383) -.05 (.474) -.10 (.138) -.05 (.442) -.10 (.161) -.08 (.227) .00 (.982) 1.00 1 11 Speed Variation 1.43 0.39 .09 (.212) .15 (.046) .39 (< .001) .01 (.877) .15 (.054) .07 (.390) .27 (< .001) .04 (.596) -.09 (.260) -.48 (< .001) 1.00 2 11 Speed Variation 4.04 0.96 .00 (.976) -.11 (.115) .12 (.089) -.03 (.651) -.04 (.602) .06 (.387) .10 (.138) -.04 (.547) .00 (.975) .53 (< .001) 1.00 1 12 Intra-Team Distance 9.59 5.59 -.05 (.468) .08 (.278) .18 (.017) -.03 (.659) .08 (.289) -.07 (.375) .06 (.392) .05 (.475) .09 (.245) .31 (< .001) -.01 (.850) 1.00 2 12 Intra-Team Distance 12.65 4.60 .08 (.261) .05 (.437) .06 (.346) -.03 (.645) .08 (.217) -.02 (.729) .01 (.833) -.01 (.845) -.04 (.522) .04 (.535) .17 (.011) 1.00 1 13 Route Deviation 7.47 4.06 -.12 (.115) .04 (.631) .02 (.759) -.03 (.728) .04 (.562) -.07 (.375) .11 (.151) .00 (.977) .14 (.058) .08 (.279) .10 (.197) .12 (.102) 1.00 2 13 Route Deviation 11.39 5.88 -.06 (.371) .02 (.745) .20 (.004) .06 (.354) .07 (.328) .03 (.647) .12 (.084) -.01 (.927) .11 (.122) .05 (.431) .01 (.877) .16 (.020) 1.00 1 14 Variation Route Deviation 3.06 1.97 -.04 (.582) .16 (.030) -.04 (.561) .01 (.944) .12 (.110) .06 (.441) .19 (.011) .15 (.046) .30 (< .001).24 (.001) .05 (.490) .19 (.012).58 (< .001) 1.00 2 14 Variation Route Deviation 4.77 2.39 -.11 (.120) -.01 (.836) .25 (< .001) .01 (.874) .00 (.965) -.04 (.596) .20 (.004) -.02 (.775) .06 (.398) .07 (.295) .15 (.027) .15 (.030).62 (< .001) 1.00
Regression Analysis
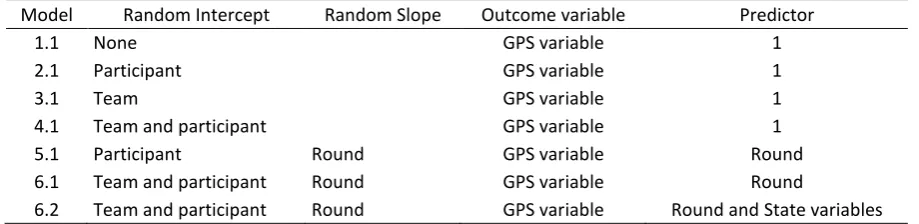
Per experiment and for each of the five GPS-based outcome variables we conducted regression analyses with the state constructs as predictors. We tested these ten regression models for random effects per participant, team, and Round. Testing for random effects is necessary since the measurements for each participant are not independent but depend on the Round that is measured and the team a participant is in. For instance, a team with fast walking members could have motivated a slow walking member to walk faster. To test the random effects, we created six random effect models which are displayed in Table 5 (see Model 1.1 – 6.1). The models are sorted by complexity with the lowest complexity in the beginning and the highest complexity at the end. The first model is a baseline model (Model 1.1) with a GPS outcome variable and 1 as predictor, and afterwards the random effects are added to the baseline model. Additionally, in Model 5.1 and 6.1 the predictor 1 is replaced with Round. For each Round, we assumed that the items varied together (covariance) and the time between measurements is equally spaced. Therefore, we used a first-order autoregressive covariance structure to model the covariance (Field, Miles, & Field, 2012).
Table 5
Random Effect Models
Model Random Intercept Random Slope Outcome variable Predictor
1.1 None GPS variable 1
2.1 Participant GPS variable 1
3.1 Team GPS variable 1
4.1 Team and participant GPS variable 1
5.1 Participant Round GPS variable Round
6.1 Team and participant Round GPS variable Round
6.2 Team and participant Round GPS variable Round and State variables
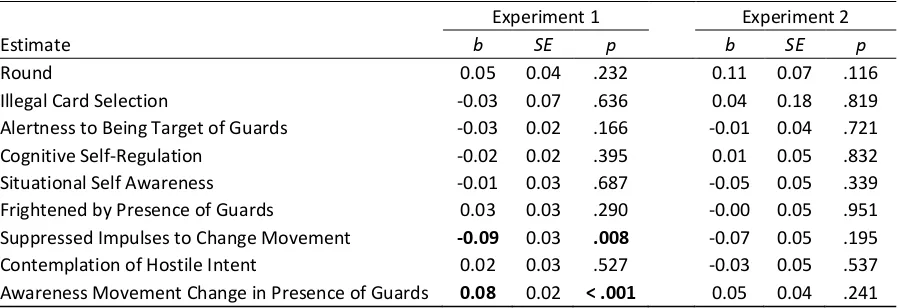
Model for Speed. We calculated Model 6.2 with Speed as outcome variable and Table 6 displays the results per estimate. As Table 6 highlights, Awareness Movement Change in Presence of Guards was a significant and positive predictor for Speed in Experiment 1 and the same relationship was not significant in Experiment 2 (b1 = 0.08, p1 < .001, b2 = 0.05, p2 =.241). Thus, when the participants reported a speed or route change after seeing the
guards, the participants walked faster. An apparent explanation could be that the participants increased their speed, in an attempt, to outpace the guards.
Additionally, in Experiment 1 Suppressed Impulses to Change Movement is a significant and negative predictor for Speed and the same relationship was not significant in Experiment 2 (b1 = -0.09, p1 = .008, b2 = -0.07, p2 = .195). This means that, people which
Table 6
Regression Model for Speed: Statistics per Estimate
Experiment 1 Experiment 2
Estimate b SE p b SE p
Round 0.05 0.04 .232 0.11 0.07 .116
Illegal Card Selection -0.03 0.07 .636 0.04 0.18 .819
Alertness to Being Target of Guards -0.03 0.02 .166 -0.01 0.04 .721
Cognitive Self-Regulation -0.02 0.02 .395 0.01 0.05 .832
Situational Self Awareness -0.01 0.03 .687 -0.05 0.05 .339 Frightened by Presence of Guards 0.03 0.03 .290 -0.00 0.05 .951 Suppressed Impulses to Change Movement -0.09 0.03 .008 -0.07 0.05 .195 Contemplation of Hostile Intent 0.02 0.03 .527 -0.03 0.05 .537 Awareness Movement Change in Presence of Guards 0.08 0.02 < .001 0.05 0.04 .241
Note. p-values less than .050 are in bold.
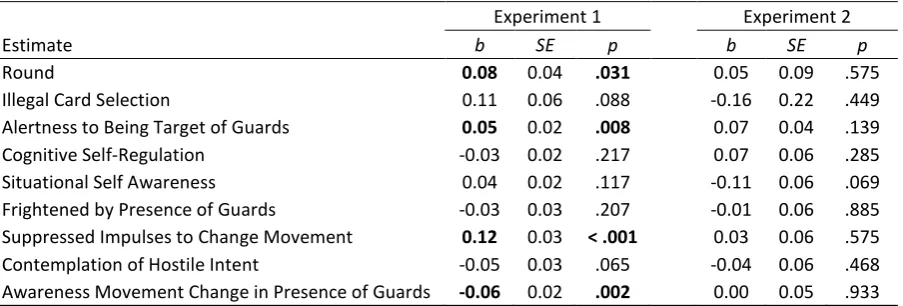
Model for Speed Variation. We calculated Model 6.2 with Speed Variation as outcome variable and Table 7 displays the results per estimate. The table shows that, Suppressed Impulses to Change Movement was a significant a positive predictor in Experiment 1 but not in Experiment 2 (b1 = 0.12, p1 < .001, b2 = 0.03, p2 =.575). This means, when the participants
had suppressed impulses then they varied more in their walking pace. A simple explanation could be that participants failed in suppressing their impulses and therefore varied more. However, as Table 6 shows, participants reduced their pace when they had suppressed impulses (b1 = -0.09, p1 = .008, b2 = -0.07, p2 = .195) and if participants had failed in
Furthermore, Round is a positive and significant predictor for Speed Variation in Experiment 1 and the same relationship is not significant in Experiment 2 (b1 = 0.08, p1 < .031, b2 = 0.05, p2 = .575). Consequently, with each consecutive Round the participants varied more
in their pace, and the variation could have helped the participants to avoid the guards better. Additionally, Alertness to Being Target of Guards is a positive and significant predictor for Speed Variation, and the same relationship was not significant in Experiment 2 (b1 = 0.05,
p1 = .008, b2 = 0.07, p2 = .139). Namely, when participants were targeted by the guards, then
they would vary more in their speed. A likely explanation is that participants tried to avoid the guards by changing their walking pace.
Finally, Awareness Movement Change in Presence of Guards was a significant and negative predictor for Speed Variation in Experiment 1 but not in Experiment 2 (b1 = -0.06, p1 = .002, b2 = 0.00, p2 =.993). This means, when participants were aware that they changed
Table 7
Regression T, P and Beta Values for Speed Variation as Dependent Variable
Experiment 1 Experiment 2
Estimate b SE p b SE p
Round 0.08 0.04 .031 0.05 0.09 .575
Illegal Card Selection 0.11 0.06 .088 -0.16 0.22 .449
Alertness to Being Target of Guards 0.05 0.02 .008 0.07 0.04 .139
Cognitive Self-Regulation -0.03 0.02 .217 0.07 0.06 .285
Situational Self Awareness 0.04 0.02 .117 -0.11 0.06 .069 Frightened by Presence of Guards -0.03 0.03 .207 -0.01 0.06 .885 Suppressed Impulses to Change Movement 0.12 0.03 < .001 0.03 0.06 .575 Contemplation of Hostile Intent -0.05 0.03 .065 -0.04 0.06 .468 Awareness Movement Change in Presence of Guards -0.06 0.02 .002 0.00 0.05 .933
Note. p-values less than .050 are in bold.
Model for Intra-Team Distance. We calculated Model 6.2 with Intra-Team Distance as outcome variable and Table 8 displays the results per estimate. The table shows that Round was a positive and significant predictor for Intra-Team Distance in Experiment 1 and the same relationship was close to significant in Experiment 2 (b1 = 2.24, p1 < .003, b2 = 0.85, p2 = .067).
This means that the distance to other team members increased with each Round, and the increasing distance could be a strategy, by the participants, that emerged to better avoid the guards.
Furthermore, Frightened by Presence of Guards was a significant and negative predictor for Intra-Team Distance in Experiment 1 and the same relationship was not significant in Experiment 2 (b1 = -0.62, p1 = .023, b2 = -0.20, p2 = .242). Therefore, when
participants had feelings of fright because of the guards then they walked closer together, possible to compensate for the fear.
questioning the legality of their actions or whether they have to hide something, they would walk further apart from their fellow team members. It is possible, the participants had conflicting emotions about their hostile intentions and therefore did not want to affiliate with their team members.
Table 8
Regression T, P and Beta Values for Intra-Team Distance as Dependent Variable
Experiment 1 Experiment 2
Estimate b SE p b SE p
Round 2.24 0.73 .003 0.85 0.46 .067
Illegal Card Selection 0.17 0.58 .770 0.08 0.70 .906
Alertness to Being Target of Guards 0.18 0.18 .323 0.16 0.14 .262
Cognitive Self-Regulation 0.13 0.19 .497 0.27 0.18 .129
Situational Self Awareness -0.32 0.20 .119 -0.06 0.18 .719 Frightened by Presence of Guards -0.62 0.27 .023 -0.20 0.17 .242 Suppressed Impulses to Change Movement 0.19 0.27 .479 -0.01 0.18 .953 Contemplation of Hostile Intent 0.52 0.24 .034 0.09 0.15 .580 Awareness Movement Change in Presence of Guards -0.07 0.16 .665 -0.13 0.15 .413
Note. p-values less than .050 are in bold.
Model for Route Deviation. We calculated Model 6.2 with Route Deviation as outcome variable and Table 9 displays the results per estimate. As the table shows, Alertness to Being Target of Guards is a significant and positive predictor for Route Deviation in Experiment 2 and a close to significant and negative predictor in Experiment 1 (b1 = -0.32, p1 = .068, b2 = 0.62, p2 =.031). Therefore, in Experiment 1, participants that perceived
when participants would feel themselves a target would need to actively avoid the guards by outwalking them.
Additionally, Round is a significant and positive predictor for Route Deviation in Experiment 1, and the same relationship is not significant in Experiment 2 (b1 = 2.14,
p1 < .001, b2 = 0.18, p2 = .738). This means that, the participants walked in increasingly greater
distances to the shortest route each Round, and a reason could be, that a higher route deviation helped in avoiding the guards. Additionally, the higher guard ratio in Experiment 2 made it easier to pursue participants and therefore in Route Deviation was from the start greater in Experiment 2 than in Experiment 1, and consequently, could not be increased as much as in Experiment 1.
Finally, Suppressed Impulses to Change Movement is a significant and positive predictor for Route Deviation in Experiment 1 and the same relationship was not significant in Experiment 2 (b1 = 0.63, p1 = .028, b2 = 0.28, p2 = .484). Therefore, participants who
Table 9
Regression T, P and Beta Values for Route Deviation as Dependent Variable
Experiment 1 Experiment 2
Estimate b SE p b SE p
Round 2.14 0.52 < .001 0.18 0.53 .738
Illegal Card Selection -0.26 0.58 .656 -1.89 1.32 .155
Alertness to Being Target of Guards -0.32 0.17 .068 0.62 0.28 .031
Cognitive Self-Regulation -0.26 0.21 .226 0.42 0.39 .279
Situational Self Awareness 0.11 0.22 .624 -0.10 0.37 .778 Frightened by Presence of Guards -0.27 0.28 .335 -0.06 0.36 .875 Suppressed Impulses to Change Movement 0.63 0.28 .028 0.28 0.39 .484 Contemplation of Hostile Intent 0.01 0.26 .958 -0.52 0.35 .138 Awareness Movement Change in Presence of Guards -0.04 0.18 .825 0.25 0.31 .415
Note. p-values less than .050 are in bold.
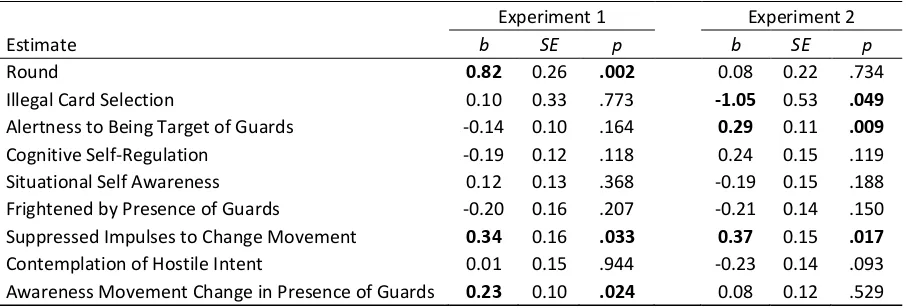
Model for Variation Route Deviation. We calculated Model 6.2 with Variation Route Deviation as outcome variable and Table 10 displays the results per estimate. As the table shows, Suppressed Impulses to Change Movement is a significant predictor for Variation Route Deviation in Experiment 1 and Experiment 2 (b1 = 0.34, p1 = .033, b2 = 0.37, p2 = .017).
This means, when participants reported more suppressed feelings then they also changed their route more often. A reason could be that the participants were uncertain about the route to avoid the guards and therefore changed it more often.
Additionally, Round is a negative and significant predictor for Variation Route Deviation in Experiment 2 and the opposite relationship is not significant in Experiment 1 (b1 = 0.10, p1 = .773, b2 = -1.05, p2 = .049). Thus, when participants selected an illegal card in
Experiment 2 then they changed their route less often. An explanation is the small number of participants that carried a legal card in Experiment 2 and which were used by the teams to distract the guards by changing their route more often.
Experiment 2 (b1 = 0.12, p1 = .721, b2 = -1.10, p2 =.045). Therefore, when participants chose
an illegal card in Experiment 2 they changed their route less often. An explanation could be that, participants with a legal card changed their route more often to attract the attention of the guards and that participant with an illegal card did the opposite. This strategy could have been more important in Experiment 2 since the area, where the guards were allowed to walk, was larger in Experiment 2. Consequently, when a participant got the attention from the guard, the guard had to walk further away from other participants.
Moreover, Alertness to Being Target of Guards is a positive and significant predictor for Variation Route Deviation in Experiment 2 and the opposite relationship is not significant in Experiment 1 (b1 = -0.14, p1 = .164, b2 = 0.29, p2 =.009). This means that, when the
participants perceived themselves as a target by the guards then the participants would change their route more often in Experiment 2 and the opposite happened in Experiment 1. The reason could be that in Experiment 2 every participant could be checked and when the participants perceived themselves as a target they actively avoided the guards by changing their route more often. In Experiment 1, in contrary, not all participants could be checked, and the participants could try to act normal to reduce guard suspicion.
Finally, Awareness Movement Change in Presence of Guards is a positive and significant predictor for Variation Route Deviation in Experiment 2 and the same relationship is not significant in Experiment 1 (b1 = 0.23, p1 = .024, b2 = 0.08, p2 = .529). Thus, when the
Table 10
Regression T, P and Beta Values for Variation Route Deviation as Dependent Variable
Experiment 1 Experiment 2
Estimate b SE p b SE p
Round 0.82 0.26 .002 0.08 0.22 .734
Illegal Card Selection 0.10 0.33 .773 -1.05 0.53 .049
Alertness to Being Target of Guards -0.14 0.10 .164 0.29 0.11 .009
Cognitive Self-Regulation -0.19 0.12 .118 0.24 0.15 .119
Situational Self Awareness 0.12 0.13 .368 -0.19 0.15 .188 Frightened by Presence of Guards -0.20 0.16 .207 -0.21 0.14 .150 Suppressed Impulses to Change Movement 0.34 0.16 .033 0.37 0.15 .017
Contemplation of Hostile Intent 0.01 0.15 .944 -0.23 0.14 .093 Awareness Movement Change in Presence of Guards 0.23 0.10 .024 0.08 0.12 .529
Note. p-values less than .050 are in bold. Summary
In summary, the results show that the participants used strategies to avoid the guards. For instance, the participants changed their behaviour with each consecutive Round, by increasing the distance to team members, by accelerating and decelerating more often, by taking longer routes, and by changing the route more often. These changes indicate a collective strategy by the participants to become better in avoiding the guards. Additionally, teams made use of a distraction strategy. For that purpose, participants chose to carry a legal card and distracted the guards, in order to improve the chances of their team members, that have an illegal card, to avoid the guards.
pace more often when targeted, by increasing the pace after seeing the guards, and by changing the route more often after seeing the guards.
In Experiment 1 the participants had two illegal cards per team and in Experiment 2 the participants could choose a free ratio of legal and illegal cards. Therefore, the increased availability of illegal cards presumably reduced the relationship between the selection of an illegal card and feeling of hostile intent. Another difference between the experiments was the ratio of guards and participants. Specifically, in Experiment 2 were more guards per participant than in Experiment 1 and that made it more difficult for the participants to avoid the guards in Experiment 2. Consequently, when participants perceived themselves as target by the guards, the participants in Experiment 1 took a more direct path and made less changes to their direction in order not to attract further attention by the guards. Moreover, the participants in Experiment 2 did the opposite, in an attempt, to outmanoeuvre the guards and took a longer route and made more changes to their route. Finally, in Experiment 1, when participants saw the guards they reduced their speed in order not to attract any attention and a similar effect could not be found in Experiment 2.
Discussion
The aim of the current study was to develop a research tool that enables behavioural scientists to more easily use Positional Technologies (PTs), such as GPS, for psychological experiments, and to give an overview which psychological variables can be studied with PTs. Additionally, we conducted two experiments to find new variables that can be linked to GPS movement data and to test the new research tool.
Psyosphere
distance, that can be analysed with linear regression methods. Our “psyosphere” builds on existing R packages (e.g. Hijmans et al., 2015; Kahle & Wickham, 2013; Loecher & Ropkins, 2015; Wickham, 2016) and is optimized to handle multiple tracks simultaneously and to make comparisons between these tracks. This is done, because comparisons between multiple participants with linear regression methods is a typical technique of conducting studies in behavioural science. To give a simplified example, the speed of multiple car drivers for a given route could be compared, to investigate if speed warnings reduce risky driving behaviour. Furthermore, the package supports data preparation through cleaning up the data by marking coordinates with unrealistic speeds as missing values or by detecting measuring gaps. Additionally, sub-tracks can be selected by providing start and finish areas. The package also supports the visualization of tracks. For that purpose, tracks and polygons can be plotted on maps, tracks can be coloured based on grouping variables, and tracks can be plotted per participant or team (see Figure 1).
Psychological variables
To illustrate which type of variables could be studied with PTs and “psyosphere”, we gave an overview of variables that were used in past research (see Table 1). Additionally, we conducted two experiments to study the relationship between feelings of hostile intent and movement data measured with GPS loggers. During the experiments, teams of participants would smuggle supposedly illegal and legal cards, while crossing a park, and were instructed to avoid being stopped by guards that were looking for the illegal cards.
(Brady & Walker, 1978; Feshbach & Feshbach, 1963; Schachter, 1959). Past research has also demonstrated that feelings of fright were related to a slower pace (Barliya et al., 2012). With the current study we could not reproduce this effect and a reason could be that participants did consider a slower pace as suspicious behaviour and feared that this would attract the attention of the guards, and therefore, suppressed the urge to walk slower.
Additionally, we found that when participants were contemplating whether they were doing something illegal and whether they had to hide something, they would keep a larger distance to their team members. This finding is in accordance with past research. For instance, participants in uncertain situations with a threat to personal self-esteem have been shown to keep a larger interpersonal distance (Brady & Walker, 1978; Schachter, 1959). For the current research, the threat to the personal self-esteem was the question whether participants believe that they were doing something illegal and the uncertainty could be whether participants will be intercepted by the guards.
would take a longer route with erratic movement, such as changing direction more often, to hide their intended target. The findings of Jian et al. (2006) are comparable with the evasion strategies but not with distraction strategies, that we found in the current study. We argue that this seeming discrepancy can be explained by the beliefs of participants about what observers would characterize as normal behaviour, in the current situation. Thus, participants will use evasive strategies if they judge their behaviour as normal movement, compared to other people around them. Furthermore, participants can use evasive movement that exceeds perceived normal movement to purposefully create suspicion.
Finally, we found that when participants presumably were uncertain about their route, they showed erratic movement, such as changing the route more often, taking longer routes, changing the pace more often and overall walking slower. To test whether participants
were actually uncertain, a future study could ask participants for instance “I felt uncertain
which route I should take”. An alternative explanation could be that participants felt regret about the route they chose because they got caught. This could be assessed by, in a future study, asking the participants if they got stopped by the guards and whether they felt regret about the route they have taken.
Limitations
measured whether the participants changed their movement when they encountered the guards. In the second experiment it was much more likely that participants would be stopped than in the first experiment. As a consequence, the guards were much less selective in stopping participants in the second experiment, and therefore, participants opted more for openly evading guards then trying to act normal. Thus, we believe that the high ratio between guards and participants was the reason that we found a smaller number of significant relationships, between mental states and GPS variables, in the second experiment compared to the first experiment. We still found meaningful relationships that were present in both experiments, and we advise that future research should limit the amount of guards in order that not all participants can be checked.
Another limitation of the current study is that we tested for 90 regression estimates, which renders the probability of finding statistical significant relationships merely by chance (Type I error inflation) rather high. It is possible to correct for this chance by reducing the significance level with, for instance, a Bonferroni correction (Holm, 1979), and it is a matter of scientific discussion when and how to adjust the significance level (e.g. Cabin & Mitchell, 2000; Fisher, 1956). For the current study we chose not to correct the significance level since we were interested in exploring the data and finding new relationships while accepting a higher risk of false positives (Wigboldus & Dotsch, 2016). Additionally, to partly reduce the probability of finding statistical significant results by chance, we compared if a statistical significant relationship in one experiment could also be found in the other experiment. We believe that a follow-up study should include hypothesis testing and an experimental design, to confirm the findings of the current study and to ensure ecological validity.
assess in how far participants suppressed impulses and tried to act normal in order not to attract the attention of the guards. Questions asked were for instance: “I would rather have chosen a different route” or “I would rather have run away from the guards”. The participants
that scored high on Suppressed Impulses to Change Movement walked slower, changed their pace more often, walked a longer route, and changed their route more often, and we believe these erratic changes in movement would increase suspicion in the guards instead of reducing them. Additionally, especially in the second experiment we observed that a small group of participants ran away from the guards and chose a different route to avoid the guards. Therefore, a more reasonable description for the Suppressed Impulses to Change Movement measure would be that the questions measured the participants’ uncertainty of which route they should have chosen, or a regret about their route choice. The questions for the Suppressed Impulses to Change Movement measure were adopted from research by Wijn et al. (2017) and in their study, the participants had to follow a predetermined path. Therefore, the participants did not run away from the guards and additionally, the guards did not interact with the participants, which could have triggered a flight response. Consequently, for future research we advise to formulate new questions to assess the suppression of impulses to change movement.
Future development
2015). These accuracy improvements will allow to detect movement patterns in more detail, making it easier to link them to cognitive processes.
Furthermore, future research could extend the features of “psyosphere” by adding
more complex methods, such as machine-learning classification. The data from studies such as the current one might for instance be used to train an algorithm to establish links between aspects of movement or other behaviours and various psychological state and trait variables, such as having a depression (Huang et al., 2016; Saeb et al., 2016; P. S. A. Wolf et al., 2013), or being a pickpocket (Bouma et al., 2014).
Conclusion
With the findings of the current study, we hope we have made it easier for social scientists to use PTs to study movement outside of a laboratory and in a real-world setting. Moreover, we show that “psyosphere” can prepare GPS data, from psychological experiments, for the analysis with commonplace statistical methods, such as linear regression.
References
Adams, B., Phung, D., & Venkatesh, S. (2008). Sensing and using social context. ACM Transactions on Multimedia Computing, Communications, and Applications (TOMM), 5(2), 11.
Akaike, H. (1974). A new look at the statistical model identification. IEEE transactions on automatic control, 19(6), 716-723.
Anderson, J. (1971). Space-time budgets and activity studies in urban geography and planning. Environment and Planning A, 3(4), 353-368.
Asakura, Y., & Iryo, T. (2007). Analysis of tourist behaviour based on the tracking data collected using a mobile communication instrument. Transportation Research Part A: Policy and Practice, 41(7), 684-690. doi:10.1016/j.tra.2006.07.003
Axhausen, K. W., Zimmermann, A., Schönfelder, S., Rindsfüser, G., & Haupt, T. (2002). Observing the rhythms of daily life: A six-week travel diary. Transportation, 29(2), 95-124.
Banerjee, N., Agarwal, S., Bahl, P., Chandra, R., Wolman, A., & Corner, M. (2010). Virtual compass: relative positioning to sense mobile social interactions. Paper presented at the International Conference on Pervasive Computing.
Barliya, A., Omlor, L., Giese, M. A., Berthoz, A., & Flash, T. (2012). Expression of emotion in the kinematics of locomotion. Experimental brain research, 225(2), 159-176.