February 2018 - July 2018
MASTER THESIS
IMPROVING DIAGNOSIS
BY GROUPING TEST
CASES TO REDUCE
COMPLEXITY
Martijn Willemsen
Faculty of Electrical Engineering, Mathematics and Computer Science (EEMCS) Formal Methods and Tools (FMT)
Exam committee: prof. dr. M.I.A. Stoelinga dr. S. Schivo
Abstract
Software quality is an important aspect of software design and software development. To ensure software quality, different types of tests are used. But tests have an inherent problem. Dijkstra wroteProgram testing can be used to show the presence of bugs, but never to show their absence![11]. Extensive testing should be done to come close to finding all bugs. Computers can help in this extensive testing. One way computers can help is through model based testing. Model based testing has shown a lot of promise in improving product quality and developer productivity[40, 21, 34]. Model based testing, or MBT, uses a model of the system to generate many test cases.
The problem with model based testing is that diagnosing the results is hard. The diagnosis is a reoccurring step in the testing process. This is why the diagnosis should be simplified. If many test cases fail, diagnosing these failures becomes a challenge. Due to the number of the test cases and the number of steps in each test case, the failures become hard to comprehend. It can be unclear why tests fail, and which tests fail because of the same fault in the code. To solve the problem of size and incomprehensiveness two major solutions have been identified. The two solutions are complementary. The first solution is grouping test cases with a similar fault. The second solution is to use root cause analysis or fault localisation to identify the step in the test case that produces the fault.
By grouping test cases, all test cases that have the same underlying problem, the same faulty line of code in the system under test, can be merged into a single group. This reduces the number of test cases to be analysed by hand. Root cause analysis helps in the analysis of a single test case. Root cause analysis tries to identify the step in a test case that causes the failure. Without this fault causing step, the test case will pass. The diagnosis is simplified since finding the faulty step helps in translating the failure into code and helps in reproducing the failure.
The result of this research is an implementation of different methods that can execute root cause analysis and can group test cases. The different implementations, SFL and data mining, are validated. The validation is done using a real world system with introduced faults, and scored on different metrics including analysis duration, F-measure and accuracy. This results in the best approach where SFL is used with steps as components including data.
Acknowledgement
This thesis contains a lot of effort from different people. First of all by Machiel van der Bijl. He has helped in guiding the research, writing this thesis and as a general sparring partner to discuss the approach.
Besides Machiel, at Axini everyone has helped tremendously with any questions that have arised and with inspiration on several aspects of the research.
Finally I would like to thank Marielle Stoelinga and Stefano Schivo in their academic guidance during the research and suggestions on how to improve the work submitted. They also helped forming this research.
Contents
1 Introduction 1
1.1 Problem statement . . . 1
1.2 Model based testing . . . 2
1.3 Atana design and implementation . . . 3
1.4 Results . . . 6
1.5 Contributions . . . 6
1.6 Assumptions . . . 7
1.7 Motivating example . . . 7
1.8 Project context . . . 8
1.9 Thesis outline . . . 9
2 Research goal and research questions 11 2.1 Research Goal . . . 11
2.2 Research Questions . . . 12
3 Background 15 3.1 Model based testing . . . 15
3.2 Abbreviations . . . 16
3.3 Definitions . . . 17
4 Related Work 19 4.1 Root Cause Analysis techniques . . . 19
4.2 Increase readability and diagnostics . . . 22
4.3 Data mining techniques . . . 24
5 Literature questions and summary 27 6 Research Method 29 6.1 Validating the solution . . . 31
7 Design 33 7.1 Architecture . . . 35
7.2 Component interaction . . . 35
7.3 Tool and language motivation . . . 38
7.4 SFL analysis service . . . 39
7.5 Data mining analysis service . . . 41
7.6 Security . . . 41
8 Implementation 45 8.1 User and data collection . . . 45
8.2 Atana . . . 46
8.3 Baseline analysis service . . . 47
8.4 SFL analysis service . . . 49
8.4.1 SFL description . . . 49
8.4.2 Problems with SFL . . . 52
8.5 Data mining analysis service . . . 53
9 Results and discussion 55 9.1 Data sets . . . 55
9.2 Settings . . . 56
9.2.1 SFL settings . . . 56
9.2.2 Data mining settings . . . 56
9.3 Evaluation . . . 57
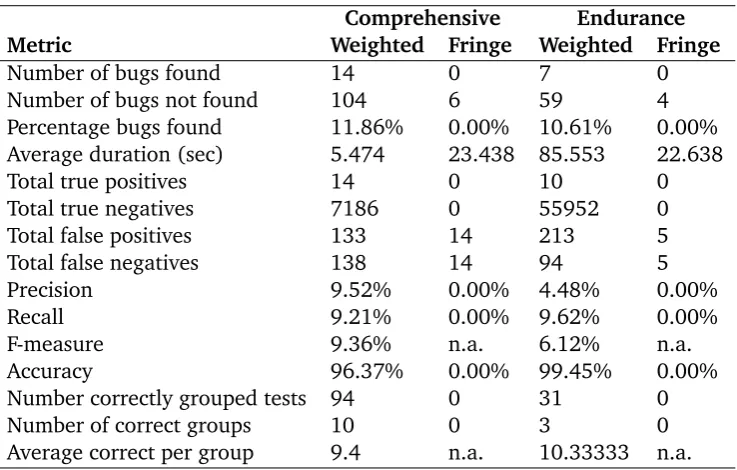
9.4 Baseline results . . . 59
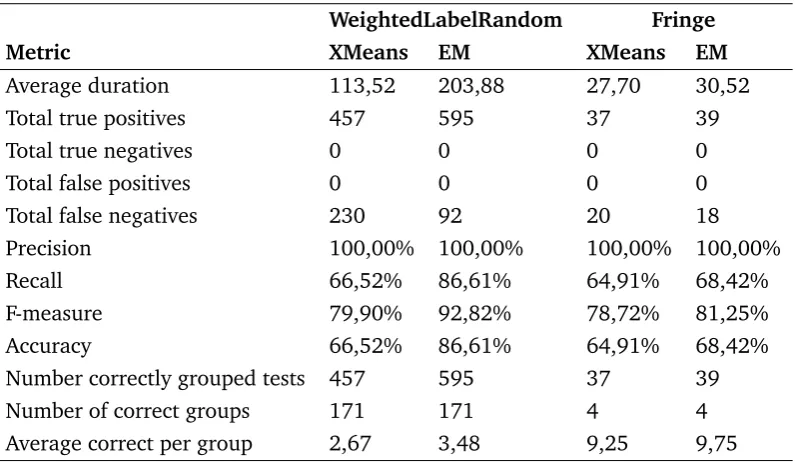
9.5 Data mining analysis results . . . 60
9.6 Spectrum-based Fault Localisation analysis results . . . 63
9.7 Comparing results . . . 70
9.7.1 Data mining↔baseline . . . 71
9.7.2 SFL↔baseline . . . 71
9.7.3 Data mining↔SFL . . . 73
10 Conclusion 75
11 Future work 77
Bibliography 79
Appendices 83
A Test case suggestions 85
1
Introduction
„
Program testing can be used to show the presence of bugs, but never to show their absence!—Edsger W. Dijkstra
1969
As Edsger W. Dijkstra has already mentioned in 1969: Tests can never show that faults do not exist. This is a problem for designing and building safety-critical software. Some software needs to befault-free. Software for aeroplanes for example. The reason that tests can only show the presence of faults is due to the fact that testing is never complete1. A marginally complex system already requires many test cases to cover the full system and to cover the full specification. To be able to come near to completeness, the number of tests that are required is immense. Building this amount of tests by hand is nearly impossible. Computers can help in testing extensively. One way computers can help is through model based testing. Model based testing has shown a lot of promise in improving product quality and developer productivity[40, 21, 34]. Nevertheless it is still not complete. Model based testing, or MBT, is a formal approach to software testing. Model-based testing tools automatically generate high quality test suites based on formal specifications of the tested system. See section 1.2 and 3.1 for a detailed explanation of model based testing.
1.1
Problem statement
The advantage of MBT is also a disadvantage. Due to the large number of test cases, there are also many test cases that are likely to fail. This makes diagnosing the results difficult. Diagnosing the traces is not trivial, but is required every test run that contains failures. The diagnosis, or analysis, is also time consuming and mind numbing, since every step looks similar and the order of the steps matters. This recurrence of the diagnosing stage shows the importance of simplifying this part of the MBT process. There are two major causes that make diagnosis difficult: there are many test cases and these test cases can contain many steps. If there are many test cases that fail, it is a lot of work to analyse. These two problems can be solved using test case grouping and Root Cause Analysis.
1Completeness: If the implementation is not correctly implementing the specification, then at least one test fails.
With test case grouping all test cases that have the same underlying problem can be grouped. The underlying problem is determined in different ways, and this is how the different implementations validated in this research distinguish themselves. All tests in a specific group will then show the same problem in a different way, so only one test case has to be analysed by hand instead of all test cases in that group. This simplifies the work required by the user since the user truly has to do less work. Suppose that three out of the ten failed test cases fail on the same step, this step is probably the same line of code for all three test cases. If this step is fixed, all three tests will not fail anymore. This shows that only one third of the work is left to do, both in analysing the faulty step, and in fixing the problematic line of code.
With Root Cause Analysis, the root cause of a problem can be found. A root cause is the step that produces the symptoms of a failure. If this problem is solved, all symptoms of the problem disappear. With the root cause available, the analysis of a single test case is simplified as the probable faulty step is identified. This step can be presented with the inputs to reproduce the failure. Since the identification of the root cause will narrow the focus of debugging the problem, RCA will result in an easier evaluation of the problem and therefore a quicker fix of the fault in the code or model.
Both methods help in simplifying the analysis of the results of a test run with model generated test cases. A simplified analysis can improve the adoption of MBT since it is less expensive and has a smaller learning curve. A higher adoption of model based testing will result in less bugs in production code[34] and higher quality software.
1.2
Model based testing
MBT allows for testing a system under test with respect to a formal specification. The models of the system are used for generating tests to validate the correctness of the system under test.
Labelled transition systems are one of the ways that the models can be described. A labelled transition system contains states and transitions. The states represent system states and the transitions represent inputs and outputs that are possible from that particular state. An LTS also contains an initial state, which is the state in which the execution of the model starts.
MBT has some concepts that are used in this thesis. A test run is a set of test cases with their verdicts. Each test case consists of multiple steps. The ordered set of steps is the test trace.
Model based testing is described in more detail in section 3.1.
1.3
Atana design and implementation
To actually make the proposed improvements to diagnosis a reality, a tool called Atana is created. Atana uses the traces of the passing and failing test cases to group test cases and identify the root cause of a failure for each test. The grouping and analysis process is implemented in different ways. Each of these implementations is validated.
Atana must contain the following components (see also figure 1.1):
• A trace and model parser
• An API for communicating with the grouping and root cause algorithms
• Multiple separate micro services that implement the grouping and root cause algorithms
• A view to return the results to the user
To parse the traces and models, the FasterXML Jackson2library is used. This library allows for parsing JSON documents (and more data formats) into JVM based objects. Jackson is used in many high profile projects for this purpose. It is also the easiest way to parse the data. Finally it has great integration with the other libraries and programming languages used in this project.
For the REST API the Spring Boot library is chosen. This library allows for simply annotating methods to create REST endpoints. It also allows for calling other REST endpoints with a single method call. Besides easy REST communication, Spring Boot has been chosen for another reason. Spring projects have easy Java bean injection. This allows for a lot of simplicity during the creation of objects like controllers, services and more. Finally Spring Boot already contains a database management library called Hibernate. This allows for storing the parsed data into a MySQL database without writing any SQL queries. Because of these many conveniences Spring Boot is used as the basic framework that is the core of Atana and binds everything together.
2https://github.com/FasterXML/Jackson
The first analysis service implementation to check is an algorithm based on Delta Debugging(DD)[45, 43, 44] and Spectrum-based Fault Localisation(SFL)[41]. Both Delta Debugging and Spectrum-based Fault Localisation are techniques that compare the traces of different test cases and their verdicts to find differences between a passing and a failing test cases. The difference that is found, is then assumed to be the faulty step. Delta Debugging does this comparison in a run-time fashion where it makes a small change, reruns the test case, and sees if the failure still happens. Spectrum-based Fault Localisation does this comparison by only comparing runs that are already available. Suppose that all failing test cases use a certain step, that is never used in a passing test case. This step, that only occurs in failing test cases, is most likely the cause of the failures. Delta Debugging and Spectrum-based Fault Localisation were chosen because they have been used in similar problems and have had good results.
Since this research focuses on analysis after running the test, the first analysis service implementation mainly focuses on Spectrum-based Fault Localisation. The Delta Debugging idea could be implemented in future work to validate the results that SFL provided. This validation could be done by removing the faulty step that was identified by SFL and re-run the test to check if this time the test passes.
The second analysis service implementation applies a data mining algorithm to solve the same problem. Weka[18] is used as a framework for the data mining algorithms since it allows to run several algorithms on the same data set. To see what kind of data mining approach works best, different algorithms are used. Data mining was chosen because it seems to be the silver bullet in any problem. The only way to validate this, is to test it on a real system and compare it to other approaches. Another reason is the fact that looking for patterns is how data mining works on a very basic level. Failing test cases also have patterns that cause the failure. Finding these patterns will help in identifying the root cause and will help in grouping test cases with a similar failure. Data mining is especially well suited for this task, because it allows for some uncertainty in which patterns are the same. Suppose that a parameter of one of the test steps is different in two similar test cases, data mining can still allow them to be the same since the parameter falls in a certain interval.
Returning the results to the user is done through Swagger UI. This tool is created for documenting and testing REST endpoints. This does mean that the results are not properly styled, but the information is available. This also means that there is proper documentation for all endpoints, which allows for easy extension of the project.
The described components are all shown in the architecture in figure 1.1.
Fig. 1.1.: Architecture describing Atana. Swagger, Spring Boot, Jackson, Hibernate and Axini TestManager are existing tools and libraries used to build Atana. The grouping and analysis service and the API in the Spring Boot component are newly created.
The two different analysis service implementations are validated using a mutation testing approach, where several mutants are created and the test cases are applied. Mutants are versions of the original system under test in which a fault is introduced. After running all the tests on the different mutants, the data is stored in Atana and the different analysis services are used to find the groups and root causes. With the known mutations in the current mutant it can be validated that Atana gives the correct test grouping and root causes. The implementations is evaluated based on accuracy, F-measure, recall and resource usage.
Besides the tool, documentation of the tool is also important to be able to reproduce these results. The description of the design and implementation tool contains information about how the tool is developed, how it is tested and what important considerations are taken into account during the implementation process.
1.4
Results
The results of this research is generated by running multiple experiments with Axini TestManager, Atana, and the two analysis services. The experiments are run on four data sets that use different models of the same SUT and different test case generation strategies. For each of the data sets several analysis methods were used.
In the end for the SFL analysis service, the best performing experiment used steps as the components in SFL and the labels of the steps contain the data stored in the model. The best performing experiment for the data mining analysis service used the EM technique.
The comparison between the two best performing results is not possible on most aspects due to a different approach to collecting the results. On only a one single metric, the two are comparable which allows to conclude that SFL using steps with data is the best solution to the research question.
1.5
Contributions
This thesis and related results delivers the following contributions.
• Application of formal fault localisation methods from white box testing to black box testing using MBT.
• A validated new approach to analysing the results of a MBT test run.
• Improve the ease of use of MBT when using large test sets with many failures.
1.6
Assumptions
In this thesis some assumptions are made. The assumptions were not researched explicitly, but are assumed to be reasonable. The following assumptions are made:
1. Model based testing creates many test cases. Since it is an automated technique, it can create many paths through the model that have little differences. All of these paths can be transformed into a test case. This results in many test cases.
2. There are many test cases that have a partial overlap. Since the test cases are created based on paths (sequences of states and transitions) through the model, two traces can have a path that occurs in both traces. Suppose the system under test (SUT) is a web-app with multiple modules. To get to a module, the user must click a menu bar. This is where the overlap can come from. All test cases that will test the same module will have to click the menu bar. If the menu bar is not properly implemented, all test cases that use this menu bar will fail. It is also possible that there is a failure in preparing data for a test case. In the model this overlap would look like a sequence of states and transitions (a path) that are in both test cases.
1.7
Motivating example
Finding the root cause of a symptom is not always easy since the root cause is not always the last step in a test case. The root cause of a failure is the step that causes the failure. If this step was not in the test case trace, the symptoms would disappear. An example of the fact that the root cause is not always the last step in a test case is shown in figure 1.2. This example shows that a simple error, such as switching a greater-than with a less-than, can be hard to find and only shows up after some lengthy test cases (even though this contrived example is still relatively small). There is only a slight difference between the model and the implementation: gt! and lt! are reversed. This could be due to a line of code that compares an inequality. If this inequality check is done the other way around, the output is reversed (as in this example where the transition from state 2 to state 3 is changed into a transition from state 2 to state 4). The other transitions are still available in subsequent states. So if the following test trace was run, it would pass the test:
input?−> gt!−> c?−> d!−> f!−> reset?−> reset!, but this test trace would fail:input?−> gt!−> c?−> e!−> f!. The reason that this test trace would fail is
that the test will end-up in state 9. In this state, the output f! could not be observed because the tester expected to be in state 7. This is also where the test will fail. The bug is not in the last state, where the test case failed, but in the transition between state 2 and state 4. Finding this kind of problem in the implementation (and report it in the model) is the aim of this research.
1 2 input?reset! 3 gt! 4 lt! 5 c? 7 e! 8 d! 10 f! reset? l! 6 c? d! 9 e! f! reset? 1 2 input?reset! 4 gt! 3 lt! 6 c? 9 e! 8 d! reset? 5 c? 7 e! d! 10 f! f! reset? l!
Fig. 1.2.: Example of a model (left) and implementation (right) with a greater than or less than fault which is highlighted in red (note: quiescence is omitted)
1.8
Project context
This graduation project is performed in cooperation with Axini. Axini is a software company specialised in model-based testing. Their main product is called TestMan-ager. It is a model-based testing tool which uses symbolic transitions systems to model systems under test. Axini also has the problem that diagnosing the results of the tests can be hard and time consuming. Some systems only start showing symp-toms after running a test case with2000steps. For now they avoid these problems by running a test set with few test cases and each test case does not go2000steps
deep. Axini TestManager (Axini TM) is used to generate test cases and collect data for analysis in this thesis.
1.9
Thesis outline
The rest of this thesis is structured as follows. In chapter 2 the research goal and the research questions are presented. The background information required for this thesis is explained in chapter 3. The related work and the literature review/summary of the related work are presented in chapters 4 and 5. The research method is shown in chapter 6. The design and implementation of Atana is described in chapters 7 and 8. And the results are presented and discussed in chapter 9. Chapter 10 contains the conclusions, and suggestions for future work are presented in chapter 11
2
Research goal and research
questions
2.1
Research Goal
The goal of this research is to find a way to group test cases that fail in a very similar way. Grouping tests helps in diagnosing problems in the SUT because they allow developers and testers to focus on fewer failed test cases. Since testing is expensive and time consuming, better and easier diagnostics help in lowering costs and spend more time running tests rather than staring at a set of failed test cases.
Similarity can be defined by the root cause of the failure. Using the root cause is important since in model generated test cases there are often overlapping pieces of the SUT tested by different tests. If there is a single fault in the SUT, every test that uses that code will fail. This creates a set with a lot of tests that all fail with the same root cause. If a tester or developer has to go over them all, this will be a very exhausting tasks, both mentally and time-wise.
A way to group test cases is to create a program that can identify the step in the test trace, the transition in the model, in which a fault occurred (the root cause). The basis of this program could be a machine learning technique that consumes the traces of failed tests. The goal of this program is to make the output of generated test cases insightful for users. Data mining is all about patterns. Parts of test traces can reoccur in different tests. If such a partial trace is reoccurring in many failing tests, this partial trace is likely the root cause of the failure for the tests that use this partial trace.
Different techniques, besides data mining, will also be considered to group test cases. Techniques like delta debugging(DD) [44], Spectrum-based Fault diagnosis(SFL) [41], and trace minimisation also seem promising to group test cases. These are all techniques that work by modifying traces to gain information. Trace minimisation, or trace reduction, tries to shorten traces by removing loops and other steps that are not required to reproduce the failure. If this process is performed on all traces, there is a set of shortest possible traces left, that all reproduce the same failure. All traces that are the same now, should be in the same group. DD and SFL are directed more towards root cause analysis. These techniques can find a root cause by comparing traces for passing and failing tests. In SFL this is done by identifying all steps or transitions that occur in failing tests but do not occur in passing test cases. The
occurrence in failing tests makes them more likely to cause a failure. It is usually not the case that a single step or transition only occurs in passing or failing tests, this is why a similarity metric is used to determine if a step or transition is faulty. For DD the comparison between failing and passing test is done by changing a single step or transitions to see if this still causes a failed test case. If the test case does not fail anymore, the modified step is probably the root cause of the failure. If DD or SFL can find a root cause, they can group the tests based on that root cause.
A big advantage of this approach to diagnosis, where the diagnosis is performed mostly automatically, is that it makes the use of automated testing using models more accessible and quicker. Many programs could have fewer faults if testing is was outsourced to computers and the results are concisely communicated to the testers and developers. This accessibility, or ease of use after running the tests, is also a major addition to the state of the art.
The program that results from this thesis, Atana, could be extended in the future to help avoid a known bugs and faults during testing, or focus on a set of often failing tests to make testing more efficient. There is a lot that could be improved on this area of model based testing. The scope of this thesis is initially limited to grouping failing test cases after they have been run to improve diagnostics.
2.2
Research Questions
From this goal, the following main question is derived: What method can effec-tively group similar failing test cases to make diagnostics easier? This question consists of two major parts: grouping similar cases and diagnostics. These two parts work together where the first part is helping to achieve the second part. Diagnostics means the analysis of the results after running the tests. Often this analysis will con-sist of finding the location where the test case has failed. With Root Cause Analysis the diagnostics can be simplified. Adding the grouping would allow a developer to avoid the analysis of all failed test cases in a group.
To answer this question the some sub-questions are considered.
1. How can algorithms like Delta Debugging and Spectrum-based Fault Localisa-tion be used to find the root cause of a failed test case?
2. Does a data mining clustering algorithm work in grouping (failed) test cases?
3. Which data mining techniques can be used to find the root cause of a failed test case?
4. How can the information incorporated in the model be used to improve Spectrum-based Fault Localisation in Model Based Testing?
3
Background
In this thesis, there is some terminology used that will be explained in this chapter. There are also some common abbreviations used, which are also explained.
3.1
Model based testing
Model based testing is the process of checking if a system under test is in compliance with a model[39]. The model describes the required behaviour of an implementation. If a SUT is in compliance with the model, the SUT implements the required behaviour. In this research, labelled transition systems (LTSs) and symbolic transition systems (STSs) are used to describe the model of the SUT. The LTSs are used in the examples and unit tests in Atana, while the STSs are used by the Axini Test Manager. A set of generated test cases can be used to validate the SUT. The biggest advantage of MBT is that a valid model will create valid test cases which need no manual intervention and can test the complete system. This removes all manual labour and therefore human mistakes.
Testing can be done using three strategies: white box, black box or gray box. Black box means that the SUT is interpreted as a black box which means that there is input and output that can be observed, but nothing about the internals of the system is known. During gray box testing some internals are known. And finally during white box testing all internals are known and can be used during testing (such as source code and program flow). In this research black box testing is used. Which means that the internals of the SUT are unknown to the test executor.
Labelled Transition Systems are a way of describing a model of a system. A Labelled Transition System (LTS) consists of states and transitions with labels on the tran-sitions which describe the actions ([39] section 3.1). The actions can be inputs, outputs and quiescence. Inputs end with or start with a question mark. Outputs end with or start with an exclamation mark. Quiescence means there is no output. Formally a LTS is defined as a 4-tuple< Q, L, T, q0 >, where
• Qis a countable, non-empty set of states;
• Lis a countable set of labels;
• T ⊆Q×(L∪ {τ})×Q, withτ 6∈L, is the transition relation;
• q0 ∈Qis the initial state
An example of a Labelled Transition Systems is shown in figure 1.2.
During the execution of the tests with a running SUT, a reset sequence is required. This reset sequence is used to reset the SUT to its initial state. A reset sequence is a sequence of actions that can always, from any state, return the SUT to the initial state from which the tests are started. This also means that a fault in this reset sequence can make tests fail that do not seem to use faulty steps.
Axini uses an extended form of an LTS called an STS: Symbolic Transition System[13]. STSs extend on LTSs by incorporating an explicit notion of data and data-dependent control flow. There are two major differences between an LTS and an STS. The first difference is that an STS contains internal variables. These are added to an LTS in a separate set V, which makes the 4-tuple a 5-tuple: < Q, L, T, V, q0 >. The
other difference is that in an STS variables can be updated and checked during transitions. These two differences allow STS models to be better compatible with the extensiveness of complex systems. STSs therefore also allow for constraints on transitions that can be taken or not and remove states that would otherwise have been required to add constraints.
3.2
Abbreviations
The important abbreviations used in this thesis are given in the table below.
SUT System under test The SUT is the system that will be tested by the generated test cases. Besides SUT there are also some other abbreviations that mean about the same, like SUC and PUC. SUC is a system under concern and the same holds for PUC which is a program under concern. MBT Model Based Testing MBT is the process of using models of the SUT
to test a SUT.
LTS Labelled Transition System The LTS is a model used in MBT. See also section 3.1.
STS Symbolic Transition System The STS is a model used in MBT. See also section 3.1.
RCA Root Cause Analysis RCA is the process of finding the cause that creates the symptom.
3.3
Definitions
The distinction between fault, error, and bug can be vague. These terms have been defined in the IEEE Standard Terminology[22]. A fault is an incorrect step, process, or data definition. An error or bug is the difference between a computed, observed, or measured value or condition and the true, specified, or theoretically correct value or condition. In this paper the term bug denotes a problem with the code. The term fault is used to denote any problem. And the term error is used to denote any problem caused by a human.
A fault and a symptom also need distinction. Many faults may not be directly observable, but a seemingly invisible fault may manifest itself through failures at other observable locations. While faults are the root cause of failures, symptoms are external manifestation of failures. [7] In this context it is useful to know if we are dealing with an actual fault or a symptom of a fault.
Since the thesis focuses on root causes, that is defined as well. According to Lamrauoi et al, a root cause is the fundamental reason for the occurrence of a failing program execution [26]. So in the context of this thesis, that is the step or transition that makes the test case fail.
4
Related Work
Quite some research has been done on model based testing, and in many related fields. An example is automatic test case generation. The generation of test cases can be done in different ways. Generation strategies range from looking at memory usage and trying to attack a system, to generating state walks in a finite state machine, to code coverage based test generation. With these strategies the test cases can be created by listing inputs (actions) and expected outputs (results). These traces of inputs and outputs form the test traces. Test case generation strategies are all very different, but one thing that they all have in common is that many many test cases can be created with possibly very long traces and reproduction paths. To reduce the load on the tester or developer that uses MBT tools, Root Cause Analysis has been used [31].
Several search queries were used for finding related work. The main keywords used are: data mining, model based testing, spectrum-based fault localisation and root cause analysis. Besides these keywords that were used in searches for papers, citations of relevant papers are also used to further improve the related work. Especially since the related work of others could be useful in this section. These search queries and related work resulted in several themes and approaches that reappeared in the majority of the papers and in which they can be grouped.
4.1
Root Cause Analysis techniques
Researching the topic of RCA introduced many different applications of RCA. Often applications are in hardware. For example a chair that is made, but has failing joints. The root cause of these failing joints is somewhere during the production process of the joints, so maybe the tenon machine creates to large pockets for the tenons to fit. The configuration of the tenon machine is the root cause of all chairs with failing joints. The approaches of papers that use RCA in hardware is not really transferable to software programs and those are therefore not discussed. All related work provided different insights in the whole concept of root cause analysis and what is important in this topic.
One insight is the localisation of faults in the whole framework. Where does the fault occur? In which part of the development and testing tool-chain? This insight shows that it is possible to find if test case generation produces faults, or if some other step in the testing framework has produced a fault [30, 31]. Finding faults
in the whole framework could be very useful when a SUT returns something that the test tool does not understand. Identifying these faults can be very hard to do by hand, because of the many permutations that are possible and is hard to keep track of. The topic of RCA in tool-chains is related to this thesis, yet still different in the sense that the goal of this research is to really interpret the results of the tests, not the whole tool-chain. This thesis and the related research could be combined to improve the usability of the whole tool-chain. Furthermore the tool that is the created in [30] is based on predefined rules, which require effort of the user. This research hopes to remove this effort and make it a seamless integration with the rest of the tool-chain and have a small learning curve.
A different way of approaching the problem of RCA is from a more mathematical point of view. Lamraoui et al [26] propose to use a new encoding for the full flow-sensitive Trace Formula. The full flow-flow-sensitive Trace Formula is equivalent to the control flow graph of the program over a certain path through the program. With this graph, a root cause can be found by going over the graph and check assertions on the different calls to other methods. These checks keep the parameter values in mind to give more details on when a certain method call fails, and where this call originates from. A more detailed explanation can be found in [27]. The full flow-sensitive trace formula can find all root causes of faults but is usually large and not very scalable. To create a new encoding, and there for make the full flow-sensitive Trace Formula more scalable, they make, among others, use of coverage information. This could prove important in proving where a developer could map a state into the code. So if the resulting program of this research would determine the state in which the root cause occurs, this still has to be translated to the location in the code. The feasibility of this approach is still left to determine but this idea can prove valuable in the path to success. The new encoding does not seem as useful since it creates traces itself where this research assumes that the traces are already created. The post-processing step where different traces are being compared does seem useful in the trace reduction (see also section 4.2). In this step the failing traces and the succeeding traces are being compared to exclude passing sub-traces from a failing one.
Zeller [45, 43] has a different method to reach the root cause of a problem. He uses Delta Debugging, which tries to isolate the difference between a passing and a failing test and with this information he tries to find the full cause effect chain. The chain contains a reason for each effect that is observed. An example of such a cause-effect chain could be that the user inputs a negative value. This input is not validated, and is trusted. This input is later used as a lookup in an array. There is no value found in the array at that specific index. Which causes the program to use an exception handler. The exception handler tries to save the problem by extracting a default value, which was not yet set. So the program crashes and does not return anything
to the user. With this chain one can find the root cause of the failure. Which is, in the example, the invalid input to be allowed. The biggest disadvantage of this approach is that it is required to re-run tests to check if a specific change in the test trace still causes a failure. Zeller has also applied this technique to real programs and uses a debugger to find the root cause within the program. Finding the root cause within the code of a program is something that cannot be done in a black box MBT project since it does not have the source code available. The idea of finding differences between the steps in passing and in failing test cases could be useful in this research. What is very useful is that Zeller has also created and provided a prototype called AskIgor.org (described in more detail in [8]). The prototype could help in implementing this technique. Artho [5] has extended the technique described by Zeller with an iterative version of delta debugging which uses previous versions of a program to find the bug. This is especially useful when there is no input available that passes, since a passing program is a requirement to delta debugging by Zeller. This is not as useful as regular delta debugging since this research aims at finding the root cause of a failure from a test case based on a single program version, not multiple. Nor does it have access to the raw program to compare the differences. A big advantage of delta debugging is that it also helps in readability as it reduces the size of the reproduction path as well. The reproduction path is the set of steps that have to be performed to reproduce a fault. The importance of being able to find a short reproduction path shows especially in [43] where they reduced the GNU Debugger to a single faulty line. In essence, Delta Debugging is a step-by-step change of the test to identify at which step the test starts failing or passing. The smallest change to go from passing to failing or the other way around is the root cause of the failure. Note that this requires at least two tests, but explodes exponentially when more tests are compared. This essence could be useful and applied to model based testing.
Some other techniques have also been proposed, like comparing coverage of a passing and a failing program with the difference being the probable root cause (Harrold et al [19, 23]). Another technique is explicit specification, which is based on a model checking. It combines multiple methods to extract a useful debugging trace from the counter example that is provided by the model checker (Groce [16]). And finally, Nearest neighbor (Renieris et al [33]) is proposed, which tries to find the most similar test that passes to a failing test and does a comparison between these two tests. This is very similar to Delta Debugging and SFL and could even be considered as an addition to simplify both these techniques.
4.2
Increase readability and diagnostics
Trace minimisation, or trace reduction, is a technique to shorten the traces of a failing test. This helps with the readability of what actually went wrong since there is less to read and therefore less to remember. An example of such a trace minimisation procedure is presented in figure 4.1. The model on the left contains one faulty transition. The first test trace contains a loop, which is removed from the second test trace. The actual faulty step remains in the test trace, but the trace is a lot shorter. This makes the failure reproducible for humans without having to perform too many steps. Kanstrén et al [24] are trying to make traces shorter using data mining. They use a test case generator and keep constraining the generation of test cases. Each test is then run again and shorter cases are looked for that reproduce the same fault. Note that this will result in a single shortest test case that reproduces the fault.
1 2 a! 3 b! 4 c! e! f! 5 d! 1 2 a! 3 b! 4 c! 5 e! 6 b! 7 c! 8 f! 1 2 a! 3 b! 4 c! 5 f!
Fig. 4.1.: An example of trace reduction. The left figure is the model. The middle one is the long trace. The most right figure is the shortened trace
Kanstrén et al also used the reduced set of traces for pattern mining. First they summarised the number of different steps required to reach the failure. Secondly they ordered the trace sequences.
The work of Kanstrén et al provided a lot of inspiration. One idea that came up was to use data mining to generate traces and the utility function of the traces is the time it takes to reproduce the same fault. If the trace never reproduces the fault, it has an infinitely large utility value, while the shortest trace has the lowest utility. This could be used in a generative algorithm. Another idea is to make a tree structure to show the equivalent test sets / traces. The root of the tree is the last state in the set of states and transitions that occur in all test cases. Then it branches into the last performed steps in all traces before this state, and so on (see figure 4.2 as a simple example where 1 and 2 are the two test cases and 3 is the combined tree). The broader the tree, the more problems are there in that specific piece of code, since one can arrive at the same fault in many different ways with many different test cases. This a visual interpretation of the traces and helps with root cause analysis as well.
A different way to increase readability is to combine dif-ferent traces in a single representation. Adam et al [4]
suggest again a graph based representation (see again figure 4.2). This representa-tion makes use of the human’s recognirepresenta-tion of images. In a more measurable way: a state that has the most incoming and outgoing transitions is probably an important state in determining the root cause. The rest of the research by Adams et al is less relevant to this work since it focuses a lot on generating the traces from user sessions. This trace generation is irrelevant since the traces are already known. One thing that is very interesting is the fact that they consider that some steps in a trace do not really matter for the result. Simply removing steps in a trace is a way to reduce the traces as well. After removing a step the whole traces have to be re-run, which could take some time.
Fig. 4.2.: An example of combining two test cases (1 & 2) into a tree (3) where the simi-lar steps are combined.
Nieminen et al [31] have done research into Root Cause Analysis as well and the result of their analysis process is an XML file. This is a very useful result as it is semi-structured data which can easily be read by a machine. Using XSL and a viewer this can also be read by humans. This allows the data to be further processed in the tool chain. Whether the usage of XML is really relevant for readability in the current research is still to be determined, but a useful thing to con-sider. Nieminen et al have used algorithms for extracting the root cause of failure for a mobile switching server. Regrettably the paper does not report what algorithms were used.
Finally Weiglhofer et al[41] have done research in grouping failing test cases to improve the readability of the result. They used Spectrum-Based Fault Localisation (SFL) as a grouping method. Chen et al [6] also used SFL for Root Cause Analysis. The research that Weiglhofer et al and Chen et al have done has a similar goal to the research done in this thesis, and is therefore very useful as a comparison in how well both methods work. There is a difference between their research and ours in the sense that they used LOTUS as a specification language and tried to create groups based on branch coverage in LOTUS. In this research states are used as classification entities; each test case can fail due to a fault in that state. This is a new approach to using SFL, but since it has been applied to many different situations, it is promising. It has also been validated by Abreu et al [1]. How the states translate to code is not in the scope of this research. The pseudo code provided by Weiglhofer et al can help in implementing test case grouping service with Spectrum-Based Fault Localisation.
4.3
Data mining techniques
Data mining is a very broad field; there are many different techniques. This section of related research focuses on what other researchers have used in similar problems and what is important to consider when data mining the traces of a test case.
The first step for any data mining problem is to prepare the data. Without data preparation the data mining process will not perform as well as with clean data. The build model can incorporate coincidences that are irrelevant to the real problem. Suriadi et al [36] really focus on that aspect of the whole process. They tried to enrich the data by combining the traces with external data and with the data itself. An example of this could be to add stack-traces to the execution traces. Or maybe count occurrences of a specific execution step within all test cases and use that as a feature in the data mining process. The data preparation step is also mentioned by Gypta et al [17]. They have their data stored in a MySQL database and used some joins to prepare the data. They also formatted dates consistently and finally converted the data into the form so the classifier can read it. This shows some important steps the need to be taken before the actual data mining can start.
Grishma et al [15] propose to use unsupervised learning to find root causes, because there are hardly any labelled datasets for this task. In some cases the defects might be labelled improperly. That is why they suggest and test some unsupervised learning techniques:
K-means K-means creates K clusters where all points in the cluster are close to each other according to some distance metric
Agglomerative Clustering The procedure starts by considering individual objects and then merging those objects which are closely placed.
COBWEB COBWEB builds taxonomy of clusters without having a predefined num-ber of clusters.
Density Based Scan Regions in which the objects are densely present are consid-ered as clusters, and the separating regions are characterised by less dense objects
Expectation Maximization Expectation Maximization is a statistical method that tries to estimate different parameters from unobservable variables.
Farthest First Farthest first selects the node that is the farthest from the current node to create clusters (see [10], section 2.2 for a more detailed description).
Grishma et al conclude that K-means, in combination with a different algorithm to make K-means more effective, works best in a situation where there is no labelled data set available and the root cause is still required to be found by grouping data. Based on this suggestion K-Means is uses a data mining technique, especially since it is a grouping technique. Girshma et al did not go into how they used the technique to find the root causes.
From the suggestion to use unsupervised learning by Grishma et al, and because of the promising results that data mining techniques like neural networks and deep learning have shown, Neural Networks is another algorithm that can be used in an unsupervised learning environment. Stevanovic et al [35] have used an unsupervised neural network to detect malicious website visitors. This is a classification or clustering problem into four classes or clusters: human visitors, well-behaved web crawlers, malicious crawlers and unknown visitors. They have used two techniques: the Self-Organizing Map (SOM) and Modified Adaptive Resonance Theory 2 (Modified ART2). Stevanovic et al do not evaluate the accuracy of the two different classifiers, but do get reasonable results which shows that these techniques work. What is noticeable is that they do have an initial label for each data entry. In this work it can be assumed that every symptom is the initial label of each entry and the neural network will change these labels if applicable.
Lat et al [25] also had the problem of not having a labelled dataset. They solved this using semi-supervised learning. They first identified a general set of root causes, and trained on a relatively small set of self-labelled data. They used this to form the rest of the data. To form the rest of the data, they used K-means clustering and label propagation[48]. Their problem was defined as a classification problem, which is something that could be done as well. The root cause of a problem can be classified into any of the existing states or transitions since this is a finite set. So using a small set of training data and an unsupervised learning system, a classifier could be trained that can later classify new traces into an existing state. This only works if the model of the system remains the same.
Gupta et al [17] used a J48 decision tree as a classifier to find root causes. This classifier is build into Weka [18]. Weka contains a GUI and has an extensive API which allows researchers to test and compare multiple classifiers on the same dataset with ease. Gupta et al chose this over R, Tanagra, Yet Another Learning Environment (YALE), and Konstanz Information Miner (KNIME) because of this easy to use interface. Weka does not contain a complex neural network yet. It only contains a Multilayer Perceptron classifier, which is a supervised neural network. Weka can
however be extended with new algorithms. This shows that Weka could also be a useful tool in this research. Gupta et al did not research software failure based on tests, and had to find out if a trace is abnormal or not. This is big difference with this research where it is known that a test failed but need to find out what caused that failure. One thing that could also be very useful is that they treat the data set as a sequential dataset for which special data mining techniques could be used[12]. Reidemeister et al [32] used a decision tree as well, they used the C4.5 classifier for RCA, which is the abstract form of a J48 decision tree. They also tried to find faults, but applied it again in a very different application.
Cheng et al [7] use logistic regression for fault localisation in complex networks. They look for root causes in networks of systems instead of a single system, but their approach could probably work for a single system as well. A big advantage is that it is targeted at a graph and a labelled transition system is a graph as well. Logistic regression is a supervised learning algorithm, so the data should be labelled, which is not the case in our data sets. Cheng et al solve this by using two stages. An estimation stage and a prediction stage. The estimation is done with regression analysis. They estimate the labels to get a labelled data set. In the prediction phase there is a classification problem left, that is also faced in this research, except that logistic regression can only classify into two classes.
Thung et al [38] try to find root causes of a bug by studying the treatments of bug report. Treatments can be submitting a fix to version control or marking a bug report as "won’t fix". If a tester or user finds a bug, they will report it. The developer will fix the bug and commit the fix for the bug to a version control system. These two sources are used for data mining. This time it is a labelled dataset since both the symptom (the bug report describes this) and the root cause (the code fix describes this) are available. This is a very different classification problem, but a very interesting point of view and one that could actually be used in iteratively developed software. If one integrates the automatic test run with every build of the software and one compares the before and after result, labelled data could be extracted. This is a slow process and relies on humans to correctly fix the bug and not just suppress the symptom. It also requires a lot of time and effort. This way of working does provide a very fine-grained result when the classifier is trained since it can tell on line-by-line basis if that line is possibly a root cause of the symptom or not. The data mining technique that is used for this is an SVM classifier. An extension to this classifier was also used in [37].
5
Literature questions and summary
This chapter will discuss concisely what information is needed to answer the research questions posed in section 2.2. This chapter will also discuss the answers to these information questions or literature questions. This chapter can be considered as a conclusion/summary to the related work.
To answer the research questions, these literature questions need to be answered first:
1. What are methods to getsimilarcases? Where similarity is defined as testing a common area of a SUT.
2. What methods for root cause analysis are available?
3. What data mining technique works for grouping and clustering data and do they work unsupervised?
4. How can a proper test set be generated for validation?
The first question is about getting similar cases. Similar cases are test case that test the same area of a SUT. There are quite some methods that can achieve this, as is evident from the related work. All the methods are worked out in more detail in section 6. In general three main methods can be distinguished: using a data mining clustering technique; finding the root cause of a failure and group based on the same root cause; and based on a number of the same states and transitions in a test case (for example based on trace minimisation).
For finding root causes, there are also some methods shown in the related work but these are not very descriptive and there might still be quite some work to be done on this front. Of course a brute force technique could be used where a step is removed from the test case trace and if the test does not fail anymore, this step is the root cause of the failure. A second, and probably more sensible method is using SFL, or Spectrum-based Fault Localisation. The third method that was found is to use trace minimisation and if a minimal trace can be found. Using trace minimisation does not return a single state, but a shortest reproducible path that can be seen as the root cause. Finally using a decision tree and use the decision that has the highest entropy as the root cause.
The related work has identified quite a number of different data mining techniques that can be used for different purposes. For now grouping, or clustering, data and classifying data are the focus points of this research. For grouping data the following techniques have been proposed: K-means, Expectation Maximisation (EM) and a neural network called self organising map. For classifying data into the correct classes the following techniques have been proposed: J48 decision tree (C4.5 implementation), logistic regression, and SVM classifier. All these different classifiers can be tested if they work with Weka. Weka[18] is a data mining framework with many data mining techniques built in and Weka can be integrated in Atana, any of the classifiers can be applied that is defined in Weka and test it. Not all of the mentioned algorithms work unsupervised so it might be necessary to manually label the data set or use label propagation as mentioned by Lat et al [25, 48].
Generating a proper validation set is vital for this research to deliver valuable results. Mutation testing is often used to validate unit tests by creating mutants and checking if the tests will fail. If they don’t fail, the tests are not checking enough. In fact bugs are introduced in the code and check if the tests catch these bugs. Since SUT with introduced bugs is needed, a mutant generator can be used to introduce these bugs in the SUT.
The SUT that is used in this research to validate Atana is a python program. After looking up the available mutation testing tools for python, the following three relevant tools were found:
• Mutmut: https://github.com/boxed/mutmut
• Cosmic Ray: https://github.com/sixty-north/cosmic-ray
• Mutpy: https://github.com/mutpy/mutpy
Out of these three, only Mutmut allows storing the resulting file. It mutates control sequences (like: ’<’ becomes ’<=’, and ’in’ becomes ’not in’) and inputs (like: integers are increased by one).
Mutmut is based on Mutpy and Cosmic Ray. Mutpy is extensively described in [9]. The main focus of Mutpy is on how incompetent mutants (mutants that create invalid code and result in TypeErrors at runtime) can be avoided and deleted from the test set. The authors of [9] also describe all different mutations that Mutpy can do, which allows for a better evaluation of the Mutmut mutation tool. If Mutpy would support just creating mutants, it would have been a better choice since it has a better theoretical underlying base, but this is not the case and therefore Mutmut is used with the knowledge of Mutpy in mind.
6
Research Method
This research uses a practical approach. It will use the design science methodol-ogy[20] to find an answer to the given research questions in section 2.2. This allows the research to be validated in a real-world environment. This also validates whether the findings are applicable in a business setting. A final benefit of this approach is that the results of the research can be adopted easily.
The practical approach consists of creating a tool that can solve the problem that is defined in the research goal: make it easier to evaluate the results of model based testing (section 2.1).
Several methods for finding root causes and grouping test cases can be evaluated. The following approaches have been identified:
• Supervised data mining techniques to classify steps into their root cause and group test by their root cause. Example techniques are a Bayes Classifier or an SVM Classifier. To apply supervised learning the root cause state field needs to be filled. To generate these labels, a brute force tactic could be used, in which every combination is tried and see if it fails and then check if this works. Another solution is to use a K-Means clustering technique as described in the related research (section 4.3). Finding how this can be done is one of the uncertainties that must be researched before data mining for the root cause can start.
• Unsupervised data mining techniques to group test cases and find root causes. This can be done in two ways. Just grouping test cases using techniques like K-means. After the tests have been grouped, it can be used to evaluate the root causes. The other way is to use the data mining technique to find the root cause and then group the test cases on the root cause again. Using an unsupervised approach avoids having to label the data, but might also be less accurate.
• Trace minimisation is a technique that can shorten traces to make them easier to interpret. This also allows for comparing traces that look the same, which can be merged into the same group. Traces could be the same if two have the same ending sequence. This does not provide a root cause yet, but neither does the unsupervised grouping data mining technique.
• Delta Debugging to get a minimal trace again and all minimised traces that are the same, should have the same root cause.
• Spectrum-based Fault localisation(SFL) is a very intuitive way of finding the root cause. SFL compares failed tests to passed tests to see if certain parts of failing tests do not occur in passing tests. If there is a part in the failing test that does not occur in the passing test, this is most likely the cause of the failure. SFL is further explained in the related work and section 8.4.1.
• Using a decision tree to see what steps have the most influence in if a test case passes or fails. The steps with the highest entropy, or influence, are the root causes of the failure of that particular test.
To be able to start using data mining techniques, the data has to be pre-processed in a table with the following columns:
• test trace step 1
• ...
• test trace step n
• number of steps in the test case
• number of reoccurring steps in the test case
• root cause
The column with the root cause is the label of the trace (in which "class" the trace must be classified). The rest of the columns are the features that can be used for classification. This layout is used in Weka, which is integrated to simply test different data mining algorithms. How the table is filled with values depends on the settings of the data mining analysis service. The different options are described in section 7.5.
Many different solutions have been identified, but the scope is limited to validating two solutions. At first Spectrum-based Fault diagnosis is tried on MBT. This method has proven to work in other applications and is therefore very promising. Validating the effectiveness in MBT applications is a great addition to the state of the art and might answer the research question in itself. The second approach that is tried is the unsupervised learning approach. Data mining and machine learning appear great
tools to solve many problems and finding the root cause of the failure could be one of these problems.
6.1
Validating the solution
When a possible solution has been implemented, it needs to be validated. The validation consists of running the implemented solution on a program that has a known set of bugs with known root causes. This test results in a score that can be compared between different solutions.
The different solutions are scored according to the following scoring criteria:
• Number of bugs found
• Number of failing tests correctly grouped
• Duration of the search / resources used
• Regular precision and accuracy metrics using false positives, true positives, false negatives and true positives.
The method that is awarded the highest overall score will be the considered the method that answers the research question: What method can effectively group similar failing test cases to make diagnostics easier?
To be able to gather these scores a SUT with an introduced bug must be created. To create the SUT with specific types of test cases that should be found is quite a difficult thing. Defining test cases is notoriously hard, and defining good test cases is even harder. To create the program and introduce bugs, a passing SUT with an existing model and test cases can be used. The MBT system can generate a lot of test cases. After having verified that everything still works, bugs are introduced. To do this mutation testing is used. This process creates mutants of the working programs. A mutant has a specific line of code changed in some way, which possibly makes it an invalid program for which the tests should not pass. Many mutants could be created to create a test set of multiple systems.
Note that these faults/bugs are introduced by the mutant generator. After all mutants have been generated, a proper test set is available that will allow for proper testing of the implemented solutions described in the previous section.
7
Design
This chapter describes the design of Atana. Atana, the software that will collect test data and help in trace analysis, works with several components. Some of these components are also discussed separately. Finally security is discussed as this is part of the whole design and is applicable to all components.
Atana is the core of the solution to the problem described in section 1.1. Atana receives and stores the information required, like the test model, the test traces, the coverage information and log files. Atana also manages/orchestrates the components that execute the analysis. These components, or analysis services, provide the implementation that execute the analysis and returns the result. The analysis services can be implemented as separate programs, or micro-services. This separation allows the analysis services to be implemented in the language and framework that fits best with that specific implementation.
To be able to receive and store the aforementioned data, Atana must meet a few requirements. First it should expose a REST endpoint where the data can be sent to. Furthermore it should be able to parse and validate the data that was send to that endpoint. After parsing the data, it should be stored in a database. The last requirement for Atana is that it should be able to send specific data to an analysis service on demand and return the result.
For the implementation of the requirements for Atana the following libraries and tools have been chosen. First Jackson1is used for parsing the JSON data into data
objects. Jackson is a serializer and a deserializer for JSON and XML. The deserialised data objects can be stored in a database. The database that has been chosen is a MySQL database since this is the same database that Axini was already using. Finally Spring2is chosen. Both for its ease of use for services, REST controllers and database repositories. And also because Spring can execute REST-calls to the different external micro-services through a easily testable component. Combining these libraries turns into the architecture in figure 7.1.
Fig. 7.1.: Architecture describing Atana. Swagger, Spring Boot, Jackson, Hibernate and Axini TestManager are existing tools and libraries used to build Atana. The grouping and analysis service and the API in the Spring Boot component are newly created.
7.1
Architecture
The architecture for Atana is shown in figure 7.1. The user can interface with the system through Swagger UI. Swagger UI is a tool that helps in documenting APIs and also allows to send requests from the web interface. The documentation of the API is also made available through Swagger UI. Swagger UI can be accessed through a browser. Other applications, or a separate front-end, could connect to Atana without using Swagger UI.
Axini TestManager generates and runs the tests on the SUT. Data from Axini Test-Manager is needed in Atana. The data (the model, coverage information and test traces) can be downloaded as a set of JSON files, which should be submitted to Atana. This can be done at once, or in several steps. This data flow from the Axini TestManager to Atana is shown as a single request, called data, in the architecture.
The API layer is the layer that is the gateway to the rest of the system. It provides access to the database, which is the core of Atana. To be able to write queries to the database the Hibernate framework is used. This allows for type safe queries and the queries (SQL) are automatically generated. The other major component of Atana is Jackson. Jackson can convert JSON document into data objects and the other way around. This is required to be able to store the JSON requests in the database with Hibernate. This whole set of components is running on a framework called Spring Boot. This framework provides the REST implementation for the API, easy registration and usage of services and seamless integration with Hibernate.
The analysis services are separate micro-services. These services are described in more detail in sections 7.4 and 7.5. The analysis services provide the implementation that execute the analysis and returns the result. To do this the service needs data. This data is supplied by Atana through two requests. The first post request sends all available test result data to the service that is required, like the test model and the test traces. This request is shown as the init step in the architecture. The second post request sends the test case that needs to be analysed. This request is shown as the data step.
7.2
Component interaction
This section describes the interaction between the different components. To describe this interaction, an example is used. This example describes a test run that was
1https://github.com/FasterXML/jackson 2https://spring.io/
Fig. 7.2.: Sequence diagram that represents the actions executed by the different actors during the usage of Atana and the related services. The solid arrows represent the requests that are started by the current actor. The dotted arrows represent responses to a request.
executed and is later analysed by Atana. The analysis process is described through the interaction between the different components. The different requests are presented in more detail in the sequence diagram in figure 7.2. The actors in the diagram represent the different systems involved, and the user that operates the whole system.
The first thing that has to be done is to prepare the systems. These first requests can be run in parallel and in any order. The configuration step for Atana consists of setting the implementation for the analysis service. For this research all analysis services use theGroupingAndAnalysisServiceRestImplimplementation which redirects the methods in the class to a rest endpoint. In this case Atana is configured to use SFL and send the requests to localhost port 8000 since this is where the SFL service will run.