publisher policies. Please scroll down to view the document itself. Please refer to the repository record for this item and our policy information available from the repository home page for further information.
To see the final version of this paper please visit the publisher’s website. Access to the published version may require a subscription.
Author(s): Michael Keen and Ben Lockwood
Article Title: The Value Added Tax: Its Causes and Consequences Year of publication: 2007
Link to published version:
http://www2.warwick.ac.uk/fac/soc/economics/research/papers/twerp_8 01.pdf
The Value Added Tax: Its Causes and Consequences
Michael Keen and Ben Lockwood
No 801
WARWICK ECONOMIC RESEARCH PAPERS
The Value Added Tax: Its Causes and Consequences
Michael Keen and Ben Lockwood
1May 2007
Abstract
Almost unknown in 1960, the value added tax (VAT) is now found in more than 130 countries, raises around 20 percent of the world’s tax revenue, and has been the centerpiece of tax reform in many developing countries. This paper explores the causes and consequences of the remarkable rise of the VAT. A key question is whether it has indeed proved, as its proponents claim, an especially effective form of taxation. To address this, it is first shown that a tax innovation—such as the introduction of a VAT—reduces the
marginal cost of public funds if and only if it also leads an optimizing government to increase the tax ratio. This observation leads to the estimation, on a panel of 143 countries for 25 years, of a system of equations describing both the probability of VAT adoption and the revenue impact of the VAT. The results point to a rich set of determinants of VAT adoption, this being more likely, for example, if a country has a program with the IMF and the less open it is to international trade. In the revenue equation, the presence of a VAT does indeed have a significant impact, but also a complex one, with a negative intercept effect counteracted by positive effects that are greater the higher are per capita income and, more tentatively, openness. While the sign of the revenue impact of the VAT is thus in general ambiguous, most countries that have adopted a VAT seem to have gained a more effective tax instrument in doing so (though this is less apparent in sub-Saharan Africa), and most without it seem likely to gain from its adoption.
JEL Classification Numbers: H20, H21
Keywords: Value added tax; tax reform
Authors’ E-Mail Addresses: [email protected];[email protected]
INTRODUCTION
Fifty years ago the value-added tax (VAT) was rarely heard of outside of France and a few dry specialist texts. Now it raises about 20 percent of the world’s tax revenue, and affects about 4 billion people. Widely adopted in sub-Saharan Africa and elsewhere, it has been the centerpiece of tax reform in many developing countries. By any standards, the rise of the VAT has been the most significant development in tax policy and administration of recent decades. And it is not over yet. Several Caribbean countries are in the process of adopting a VAT, for example, while Libya, Syria and the United Arab Emirates are among those planning introduction in the coming years. All this is widely recognized. Yet the causes and consequences of the rise of the VAT have received virtually no attention, either theoretical or empirical. Essentially nothing is known about the two most basic questions of all: Are there any signs that the VAT has lived up, in practice, to the claims made for it by its advocates (and feared by some of its opponents)? And what exactly is it that has driven its remarkable spread around the world?
On the first of these, a key claim made by proponents of the VAT, especially for developing countries, has been that it would enhance efforts to mobilize much needed tax revenue, not only directly but through wider improvements in tax administration and compliance. The same argument is sometimes turned around, however, by those distrustful of the uses to which government would put additional revenue. This political economy concern has been especially influential in the United States, and was a key reason why the recent presidential panel could not reach agreement on whether or not the adoption of a VAT there (the only OECD country without a VAT) would be desirable: “Some panelists were….concerned that introducing a VAT would lead to higher total tax collections over time and facilitate the development of a larger federal government—in other words, that the VAT would be a ‘money machine’.” (President’s Advisory Panel (2006, p. 192)).
Underlying both views—of the VAT as a beneficial expansion of the armory of tax
instruments available to governments, or as all too easy a source of revenue—is a common presumption of fact: that adoption of a VAT makes it easier to raise revenue, and in that sense improves the efficiency of the overall tax system. This presumption can be challenged on theoretical grounds, as we touch on shortly. The concern of this paper, however, is to test it empirically: Is there any evidence that the VAT has, in fact, proved an especially efficient form of taxation? Pursuing this issue further, we also ask: Does the impact of the VAT of the effectiveness of the tax system vary systematically with country characteristics, being, for example, more or less marked in less developed economies? All this is not to suggest, it should be stressed, that the revenue-raising capacity of the VAT is the only criterion by which it should be judged, nor indeed that the VAT is necessarily desirable even when it can be shown to be associated with increased revenue. The concern here is simply with the factual question of whether there are any signs, and if so under what circumstances, that adoption of the VAT has indeed led to a more efficient tax system.
Beyond this, however, the question is of interest and importance in itself. What have been the roles, for example, of regional emulation, and of the international financial institutions, in the spread of the VAT? This matters not only for historical understanding of the VAT
experience, and for gauging the prospects of its further spread, but for addressing the wider question of how innovations in domestic tax design transmit themselves across countries; a potentially informative aspect of the VAT in this context being that the direct cross-border spillover effects of adoption are relatively limited (compared, for instance, to those from the corporate tax), so that competition for tax base itself is unlikely to play a significant role. This paper explores these and other empirical issues related to the performance and adoption of the VAT, using an unbalanced panel dataset for 143 countries over 26 years. There being no obvious way to test directly for efficiency gains from the VAT, we develop here an indirect approach. We first show that, in principle, and under weak conditions, access to a more efficient tax instrument would be expected, all else equal, to lead to an optimizing (but not necessarily benevolent) government to increase the tax ratio (the ratio, that is, of tax revenues from all sources to GDP). Guided by this theoretical result, we then test empirically for any impact on the tax ratio of the presence of a VAT. This boils down to adding a dummy for the presence of a VAT—and, importantly, various interaction terms—to regressions familiar from the long-established ‘tax effort’ literature, which seeks to explain cross-country differences in tax ratios.2 And then we ask whether the impact is positive. All this, of course, can also be thought of as simply a direct test of whether the VAT has proved to be a ‘money machine.’3 To control for endogeneity bias, and investigate the determinants of the take-up of the VAT, the VAT dummy is itself also explicitly modeled and a take-up equation also estimated.
The literature on the VAT is surprisingly sparse, given that it has now become a core part of the most countries’ tax systems. On theoretical aspects, while there is of course a large literature on the optimal design of taxes on final consumption, few contributions concern themselves with the crediting and refund mechanisms (and their potential imperfections) that make the critical difference between a VAT and, for example, a retail sales tax—and which are therefore the distinctive source of any efficiency gain or loss associated with the VAT. The literature establishing conditions under which uniform commodity taxation is optimal, for instance,4 is just as applicable to any other form of consumption tax as it is to the VAT. 5
2 An early contribution is Bahl (1971), with the literature continuing through Tanzi (1992) and others to Alesina and Wacziarg (1998) and Rodrik (1998).
3 Keen and Lockwood (2006) explore the money machine idea in more detail both theoretically and empirically (for a panel of OECD countries, for which—in contrast to the much wider sample here—data on revenue raised by the VAT are available). They refer to this notion of a positive association between the presence of a VAT and total revenue as the ‘weak’ money machine hypothesis.
Empirical work on the VAT is also scant. A few papers have sought to model the revenue raised by, and compliance with, the VAT, often with a view to estimating a revenue-maximizing rate.6 Desai and Hines (2005) consider the impact of the VAT on international trade. finding that—particularly for other than high income countries—both openness and export performance are negatively related to both the presence of the VAT and the extent of revenue reliance upon it. There has previously been no work, however, modeling the take-up of the VAT. Only two studies of which we are aware have looked at the impact of the VAT on the efficiency of, and (a closely related aspect, as we shall see) the revenue raised by the full tax system. Nellor (1987), proceeding essentially by case study, provided an early assessment of the revenue impact of a few VAT adoptions. Closest to the present analysis, however, is Ebrill and others (2001), who address similar questions but do so using only a single cross-section of data, and—as also do Desai and Hines (2005) and the other papers cited above—taking the presence or absence of a VAT as exogenous. These restrictions mean that these previous results are subject to potentially serious biases.
The plan of the paper is as follows. Section II develops a simple framework for thinking about the adoption and revenue impact of the VAT, using this to derive a direct test for the presence of efficiency gains associated with its implementation. The estimation strategy and dataset are developed and described in Section III (with the latter characterized more fully in an appendix). Results are reported and discussed in Section IV, and the country-specificity of the effects of the VAT to which they point is explored in Section V. Section VI summarizes and concludes.
I. MODELING THE IMPACT AND TAKE-UP OF THE VAT
This section discusses the nature and likely impact of the VAT, and develops a methodology for understanding its adoption and evaluating its impact on the overall effectiveness of the national tax systems.
A. Background
The essence of the VAT is that it is levied on all transactions but, being credited against tax due on traders’ sales, ultimately comes to bear—if the crediting chain is unbroken, and tax properly charged on imports and remitted on exports—only on final consumption.7 The principal claim made by advocates of the VAT (and indeed by some of its opponents, as noted above) is that, if well-designed, this structure makes it a particularly efficient tax. 5 Similarly, several recent results on tax design in the presence of an informal sector referred to later, do not capture the key feature of the VAT that informal producers will bear tax on their inputs in so far as these are imported or purchased from registered traders.
6 See Agha and Houghton (1996), Aizenman and Jinjarak (2005), Ebrill and others (2001), Matthews and Lloyd-Williams (2000) and Matthews (2003).
There are several potential sources of efficiency gain associated with adoption of a VAT. In practice, the VAT often replaces either a turnover tax (bearing on all transactions) or a single-stage sales tax (levied at retail or some other level). Turnover taxes, however, bear on intermediate transactions, and so induce production inefficiencies; sales tax often do so too (since it is hard to distinguish these from final sales)8 and, moreover, can be particularly vulnerable to evasion and avoidance (because revenue is lost completely if, for some reason, the tax is not properly imposed at the single point of sale), and so tend ultimately to levy high rates on narrow bases. In other cases, the VAT has been adopted as part of a package of trade liberalization, compensating for the revenue loss from the reduction of tariffs whilst
preserving the gains in production efficiency from moving producer prices closer to world prices. At a more general level—and especially in developing countries—adoption of the VAT is often seen as the central element in a program of modernizing tax administration, developing the use of methods of self-assessment whose generalization is expected ultimately to ease administration and compliance in relation to other taxes too.
But it could be, on the other hand, that the VAT has actually reduced efficiency, for it clearly has potential weaknesses. When the VAT chain is broken—as, for many reasons, it
commonly is, production inefficiencies may be created, which could in principle offset the benefits of greater assurance of revenue collection. The VAT has also proved vulnerable to high profile criminal attack: ‘carousel fraud,’ for example, which exploits arrangements for the taxation of intra-community trade within the European Union, has amounted to around 1.5–2.5 percent of net revenue, or more, in the United Kingdom (Keen and Smith, 2006). And imperfections in the refund system, and/or excessive statutory exemptions, may have meant that the VAT has in practice functioned largely as a tax on exports and intermediate production, and so tended to reduce exports and national output (this being one potential explanation of the Desai-Hines (2005) result, to which we shall return). Informality can also have an important bearing on the impact of the VAT. Piggott and Whalley (2001) show that expanding the base of a consumption tax can reduce welfare by increasing the scale of
inefficient informal production, while in similar vein Emran and Stiglitz (2005) argue that the VAT may be inferior to tariffs in the presence of an informal sector (with the substantial qualification—stressed and pursued in Keen (2006)—that most of the VAT collected in developing countries is in fact levied on imports, and so functions precisely as a tariff for purchasers in the informal sector).
Thus the question of whether the VAT has enhanced the efficiency with which tax revenue is raised is (or should be) ultimately an empirical one. The question then is how any such efficiency gains (or losses) might be detected empirically.9
8 Ring (1999), for instance, estimates that about 40 percent of the revenue raised by sales taxes in the United States falls on business purchases.
B. The Revenue Impact of a Tax Innovation
To address this, consider a very stylized economy consisting of a single representative consumer with preferences U(C,G), defined over private consumption C and public
expenditure G. Assume that U is strictly increasing in both arguments, quasi-concave, and— a minimal simplification—that C is normal in demand. Public expenditure is financed by some form of taxation that generates revenue R, so that the consumer’s welfare is simply
), , (Y R R
U − where Y denotes gross income; which, we suppose, is a function Y(R,V)of both the level of taxation and the nature of the tax instruments available, the latter
parameterized by a scalar V. (In the empirics below, V will be a dummy variable taking the value unity if a VAT is present and zero if it is not). Capturing the inefficiency loss from taxation, pre-tax income decreases with R, with −YR >0 (denoting derivatives by subscripts) being the marginal deadweight loss from taxation, assumed throughout to be positive.
(Marginal deadweight loss, we shall suppose, increases with the amount of revenue raised, so that YRR <0). A tax innovation, corresponding to an increase in V , thus raises the efficiency of the tax system ifand only if it implies a reduction in the marginal deadweight loss from taxation, so that YRV >0.
Turning to the testable implications of changes in the tax instruments available, suppose first the case in which the government is wholly benevolent. For any V (taken as given for the moment), it then chooses R to maximize U[Y(R,V)−R,R]. The necessary condition for this gives the modified Samuelson rule:
=1− R >1
C
G Y
U U
, (1)
showing marginal willingness to pay for the public good to be set equal to unity plus the marginal deadweight loss from taxation.
To derive the effect of an exogenous increase in the efficiency of the tax system on the amount of tax revenue that is optimally raised, and a suitable estimating equation to investigate the effect empirically, denote the revenue ratio by r ≡R/Y and make the arguments of necessary condition (1) explicit to rewrite it as:
0 ] , ) 1 [( )
1 ) , ( ]( , ) 1 [( )
, ,
(r V Y ≡U −r Y rY Y rY V − +U −r Y rY =
H C R G (2)
This implicitly defines the tax ratio as a function r(V,Y)of the level of gross income and the state of the tax system, V, taking a first order approximation to which gives:
VY Y
V
r≈β0+β1 +β2 +β3 . (3)
tax instruments. Equation (3) is the basis of the first element of the estimation strategy developed further below, focused on the efficiency impact of the VAT once it is in place. The focus of empirical interest will be on the impact on r of an increase in V, corresponding to the adoption of a VAT. This speaks directly to the ‘money machine’ argument, since it identifies the ultimate revenue impact, all else equal, of introducing a VAT. More
fundamentally, however, this is informative on the nature and magnitude of any efficiency gains from the VAT, since:
PROPOSITION: )rV(V,Y has the same sign as YRV.
Proof: See Appendix A.
Thus the tax ratio will be positively associated with the presence of a VAT if and only deployment of a VAT reduces the marginal deadweight loss of the tax system. The intuition is simple. As it becomes less costly to raise revenue at the margin, so more will optimally be raised; and so, conditional on observed income Y, the tax ratio will rise.
The discussion so far has presumed benevolent policy-making. This is clearly not the view of the world, however, of those who—like some on the President’s Advisory Panel—resist the introduction of a VAT on the grounds that it may lead to an undesirable increase in the size of government. But the approach pursed here does not require that one take any particular view of government and policy making. At a purely descriptive level, as noted earlier, the empirical results themselves speak directly to the money machine issue: an empirical finding that the presence of a VAT is associated with a higher tax ratio has no implication, for instance, for whether or not its introduction has in any sense increased welfare. More important for present purposes, however, is that the revenue impact of an increase in V plausibly continues to be informative on the efficiency impact of the tax innovation even when policy-making is not benevolent. Suppose for instance, that policy is made to maximize some function Ψ(L,U) defined over some item of public expenditure L that benefits only the policy-maker and on private utility.10 Thus policy makers attach some but not sole
importance to the welfare of their citizens, if not through sheer benevolence then from self-interest in terms of re-election or the avoidance of threats to their position. The policy problem in this case can be written
R max
{
L
max Ψ
[
L,U(Y(V,R)−R,R−L)]
}
≡ RmaxU*[Y(V,R)−R,R] , (4)
and so has the same general form as that examined above. In particular, Proposition 1 continues to apply, so that—given the irrelevance of the preference structure to that result— the derivative of the tax ratio with respect to V , conditional on observed income, continues to
have the same sign as YRV. The empirical results below thus bear, it should be stressed, on the efficiency of the VAT, not on its welfare impact.
In using these results to guide the empirical investigation, it is important to note that the presence or absence of a VAT is to be related to total tax revenue, not simply to revenue from sales taxation. When it is adopted in tandem with trade liberalization, for instance, one would expect a VAT to raise more revenue than the predecessor sales tax simply because of the switch of revenue away from trade taxes and towards sales taxes. Similarly, the concern of the panelists cited above was not with the revenue that a VAT itself would raise, but the extent that this would represent an increase in the aggregate tax burden. The point is simply that the VAT needs to be evaluated as part of a wider tax system.
C. The Decision to Adopt a VAT
The analysis so far has treated V, the state of the tax system, as a continuous variable, and exogenous. In fact, of course, the adoption of a VAT is a major policy decision, often involving changes in the structure of the national tax administration, extensive information campaigns and, in many developing countries, a significant change in the way of doing tax business (moving to systematic self-assessment). Thus adoption is costly, and far from exogenous. This matters not only for the empirical analysis of the effects of adoption— implying possible self-selection biases unless the adoption decision is itself modeled—but also in its own right, since the reason why so many countries, but not all, have chosen to adopt a VAT is evidently of interest in itself.
To analyze the adoption decision—in terms (to begin) of the model of benevolent policy making above—suppose that implementation of the VAT involves additional administration and compliance activities which imply a real resource loss of some fixed amount K, reducing the amount of revenue collected that is available to finance the public good G. The VAT will then be adopted if and only if:
G
maxU[Y(1,G+K)−G−K,G] > G
max ]U[Y(0,G)−G,G , (5) where V =1 refers to the state in which the VAT is adopted and V =0 to that in which it is not. A sufficient condition for adoption, it is easily seen, is that
), , 0 ( ) ,
1
( G K Y G
Y
K < + − ∀G (6)
so that adoption of the VAT unambiguously reduces the deadweight loss from the tax system by more than it increases implementation costs.11 Re-expressing the same argument in terms of the function U* in (4) above, the same conclusion holds with non-benevolent policy-making of the form considered earlier.
In practice, of course, the adoption decision may reflect considerations beyond this
comparison of deadweight and implementation costs. It may involve special difficulties, for example, in federal states which (like the United States) allocate substantial sales tax powers to lower level jurisdictions, since implementation of the VAT in the absence of border controls raises particular difficulties.12 In the empirical modeling of the adoption decision below we attempt to control for a range of such additional considerations.
One consideration to which we have not yet paid explicit attention is the role of distributional considerations in the adoption and design of the VAT. These may be secondary, however, if other tax and spending instruments are available that are better targeted to the pursuit of equity concerns. While such instruments are clearly available to most developed countries, in developing countries too spending measures may well be more effective devices for
alleviating poverty.13 In this spirit, one could interpret the framework above as incorporating distributional concerns by thinking of the consumer whose welfare is enters the policy maximand above as deriving an altruistic benefit from the amount of a transfer G paid to the poor. More generally, while distributional concerns may—rightly or wrongly14—lead governments to tinker with the rate and exemption structure of the VAT, this might be expected to mitigate rather than overturn the efficiency gains that are the main argument given for adoption of the VAT, and whose existence we seek to test.
D. Limitations
It is important too to stress two key features of this framework developed here.
First, in interpreting a positive association between total revenues and the presence of a VAT as signaling a gain in effectiveness from the use of the latter (in a sense, a ‘supply’ side effect on tax revenues), the implicit assumption is that the additional variables—in both revenue and adoption equations—control adequately for any changes in the general demand for public expenditure. While Keen and Lockwood (2006) develop a direct test between demand and supply-based explanations for adoption and development of the VAT, this requires data on revenue from the VAT itself—which is simply not available for a panel anything as large as that analyzed here, and especially for the lower income countries that are a primary focus of our interest.
Second, in assessing the overall gain in effectiveness from adoption of the VAT we shall focus on its impact in the revenue equation. This, however, relates only to the ex post gain
12 See for instance Chapter 17 of Ebrill and others (2001) and the symposium on this topic in the December 2000 issue of International Tax and Public Finance, 2000.
13 See for instance the careful comparison between VAT and spending instruments for Ethiopia by Muñoz and Cho (2004).
once a VAT is in place. From a broader perspective, account would also need to be taken of the costs K incurred in adoption. In the absence of an explicit functional form for the policy maximand, however, we are not able to estimate this from the approach taken here.
II.
III. EMPIRICAL SPECIFICATION
This section sets out our estimation strategy and describes the dataset used. A. The Revenue Equation
The theoretical considerations above suggest modeling the revenue ratio r as:
it t i it it V it it
it V X V X u
r =α +β′ +β′ +μ +λ + (7)
where i and t are country and time indicators respectively, Vit a dummy variable taking the value unity if country i has a VAT in year t and zero otherwise, andXit captures other variables (discussed further below) affecting the tax ratio. The termμi is a country-specific effect, λtis a time effect, and the idiosyncratic error uit is assumed to be both spatially and temporally uncorrelated: that is, E[uitujt]=0 for j≠i, and E[uituis]=0 for s≠t.
Consistent with (3) above, this VAT-augmented revenue equation allows the effect of the VAT to be more complex than a simple shift of intercept, entering also in interaction with other variables.
B. The Adoption Equation
The underlying notion, articulated in (5) above, is that a country will adopt the VAT if and only, given subsequent optimization over its rate structure and other design features, this leads to higher welfare (for policy makers, if not necessarily for the citizenry). We model this in a simple but fairly general way by supposing this difference in welfare to be given by
, ' it it
it Z
W =δ −ε
Δ for some set of explanatory variables Z (which may overlap with those appearing in X of the revenue equation) and errors ε. So:
⎩ ⎨ ⎧
< ≥ =
it it
it it it
Z Z V
ε
δ
ε
δ
' , 0
' , 1
(8)
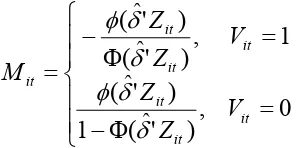
whereεit is assumed to be normally distributed and both spatially and temporally uncorrelated. Thus Pr[Vit =1]=Pr[εit ≤δ′Zit], where (.)Φ denotes the standard normal distribution (and (.)φ will denote its density) and the adoption equation is estimated as a probit.
both subsequently re-adopting). This presumably reflects the high fixed costs (not least, one suspects, political) of implementing or removing a VAT. To allow for this evident
sluggishness, we include the lagged value of the VAT dummy, Vi,t−1 amongst the regressors in Zit. With so few VATs repealed, the estimate of the coefficient on Vi,t−1will be dominated by the persistence of the VAT, with the remaining elements of δ largely identified from the observations in which a VAT is not already in place.
C. Logical Consistency and Cross Equation Restrictions
In two equation systems such as (7)–(8), with one of the variables binary, attention needs to given to their logical consistency (Maddala, 1983). In the present context, this is shown in Appendix B to have two important implications. The first is that current revenue rit cannot in itself be an element of Zit, so that the system (7)–(8) is recursive: the implications of this for estimation are discussed in the next section. The second is that both equations are always identified.
Logical consistency does not, however, rule out including among the potential determinants of adoption the anticipated revenue gain from implementation of the VAT, which the revenue equation (7) implies to be α +βV′Xit. This implies the cross equation restriction that if two or more variables in X do not affect adoption other than through their impact on revenue, then their relative coefficients in the adoption and revenue equations should be the same. There appear, however, to be no variables that one can confidently assert to affect revenue without also having an independent effect of the likelihood of adoption (as will become clear in the discussion of included variables below). We therefore do not impose or test any cross equation restrictions.
D. Estimation
Equations (7) and (8) form a mixed system of both continuous and discrete dependent variables. Since logical consistency requires this to be a recursive system, if uit andεit are independent then separate estimation of the two equations is both consistent and efficient. Specifically, the revenue equation (7) can be estimated by OLS (or by GMM, with the inclusion of a lagged dependent variable) and the adoption equation (8) can be estimated as a dynamic probit (‘probit with state dependence’) by maximum likelihood, with the log
likelihoods summed over all observations in the sample.15 For the latter, it should be noted, fixed effects cannot be included in (8),16 a point to which we return. In this dynamic probit, the initial values of the VAT dummies, Vi0, are taken as exogenous.
15 Wooldridge (2002).
It could plausibly be, however, that uit and εit are correlated. If this covariance were negative, for example—so that a country with a particularly high level of revenue for some reason unmeasured by us (that is, with a high uit) is for the same reason also more likely (have a low εit)—then failing to allow for this would evidently lead to an upward bias in the estimate of the intercept shift α associated with the VAT itself: the efficiency gain, that is, would tend to be over-estimated. As shown in Appendix C, this bias can be dealt with by a simple two-step estimation procedure, based on Maddala (1983), in which the probit (8) is first estimated by maximum likelihood and the estimate δˆ this generates used to construct the auxiliary variable:
⎪ ⎪ ⎩ ⎪ ⎪ ⎨ ⎧ = Φ − = Φ − = 0 , ) 'ˆ ( 1 ) 'ˆ ( 1 , ) 'ˆ ( ) 'ˆ ( it it it it it it it V Z Z V Z Z M δ δ φ δ δ φ (9)
which is then included in the revenue equation (7), now to be estimated as
t i it u it it V it it
it V X V X M
r =α +β′ +β′ +σ ε +μ +λ , (10)
with the estimated coefficient on Mitthen being an estimate of the covariance between uit and εit. Estimation of the adoption equation, it should be noted, is the same whether or not allowance is made for possible correlation between uit and εit. In this dynamic probit, the initial values of the VAT dummies Vi0 are taken as exogenous.
E. Data and Variables
[image:14.612.232.380.228.302.2]Here we provide a brief overview of the data and sources used in the empirical analysis to follow (a fuller account being in a data appendix).
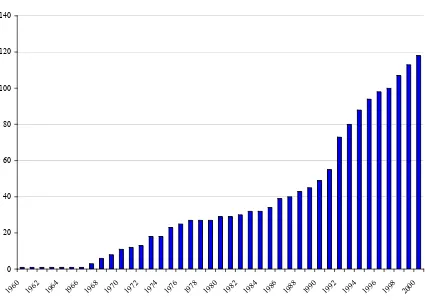
Figure 1 charts the spread of the VAT (for the universe of countries, not those in the sample). After its Francophone origins—Côte D’Ivoire is shown as the only country with a VAT in 1960, though arguably France should also be included—wider adoption began in the latter 1960s, primarily amongst the initial members of the European Union and in Latin America. Steady growth followed, until a further dramatic expansion of the VAT, not only by the countries entering transition but also by many developing countries, in sub-Saharan Africa as elsewhere.17
The sample period used is from 1975 to 2000. As can be seen from Figure 1, this excludes some early adoptions, but the choice is driven by a scarcity of data on other variables for these years.
Figure 1: The Number of Countries with a VAT
0 20 40 60 80 100 120 140
1960 1962 1964 1966 1968 1970 1972 1974 1976 1978 1980 1982 1984 1986 1988 1990 1992 1994 1996 1998 2000
Revenue data are from the World Economic Outlook (WEO), and relate to general
government and grants. Each country has at least ten years of data on this variable; and the mean number of years of data available is 23.4, out of a maximum of 26. (Data on revenue raised by the VAT itself, it should be noted, this of course significantly limits the exercises that we are able to conduct, and indeed is a key reasons for our focus on the simple presence or absence of a VAT).
The countries of the Former Soviet Union (FSU) and Central and Eastern Europe are excluded from the sample.18 This is for two reasons. First, WEO data on r before 1992 for FSU countries appear to artificially constructed, yielding implausible values. Moreover, after 1992 these countries were introducing VATs at the same time as undertaking wider
structural reforms that reduced the size of the public sector, introducing a negative correlation between VAT adoption and total revenue for these countries that reflects the highly unusual circumstances of their transitional reforms. With these exclusions, the final sample is an unbalanced panel of 143 countries over the period 1975-2000.
At the heart of the analysis, of both efficiency effects and adoption, are the VAT dummies
it
V describing whether or not country i had a VAT in place at time t. Not all VATs are alike, however, They differ substantially along many potentially important dimensions of design: in the number and level of rates, in the extent of zero-rating and exemptions, in whether or not they extend to retail stage, in the level of the threshold(s), and in the promptness and
extensiveness of refunds—features, it should be noted, for which the usable panel data do not exist. Thus one would not expect all VATs to generate the same potential efficiency gains, and indeed reasonable people may (and do) differ as to whether a particular tax has extensive and effective enough crediting to be properly regarded as a VAT at all. While the yes/no distinction made by the VAT dummy is broader brush than it may at first seem, failing to capture many important distinctions between VATs, it is clearly informative nonetheless. Variables that have become standard in modeling tax revenues—and also treated here as potential determinants of the decision to adopt a VAT—include income per capita (YPC), the share of agriculture in GDP (AGR) (expected to be positively and negatively correlated, respectively, with the tax ratio; and negatively correlated with each other), openness (OPEN, measured as the sum of the GDP shares of imports and exports), and country size (as
captured by population, POP). Rodrik (1998), for example, finds openness to be negatively related to the size of government, while population is negatively correlated to openness (see for example Alesina and Wacziarg (1998)).
We also experiment, in both adoption and revenue equations, with demographic variables: the proportions of the population 14 or younger (DEPYOUNG ) and 65 or over (DEPOLD). These may affect the need for tax revenue to support those out of the labor market (previous work, such as Persson and Tabellini (2003) and Rodrik (1998), commonly finds the tax ratio to be increasing in the number of elderly), and—with the VAT in part a tax on accumulated savings of the elderly—may also enter the politics of the adoption decision.
To explore the role of the international financial institutions in the take-up decision, dummies for participation in IMF programs are included in the adoption equation, differentiating between those focused on crisis resolution (IMFCR) and on development and poverty relief (IMFNCR). These are also included in the revenue equation, since they may be associated more generally with pressures to raise revenue.
sales taxation to lower levels, given the technical difficulties, noted earlier, created by the absence of internal border controls.
In the adoption equation, use is also made of regional dummies, distinguishing between Asia-Pacific (AP), the Americas (AS), the EU15 plus Norway and Switzerland (EU+)¸ North Africa and the Middle East (NME), small islands (SI) and sub-Saharan Africa (AFR). To capture possible neighborhood effects, a variable NEIGHBOURmeasures the proportion of countries in the same region as country i that implemented a VAT in period t.
IV. RESULTS
Results are reported for the two equations (7) and (8) in turn, beginning with the later.
A. Adoption of the VAT
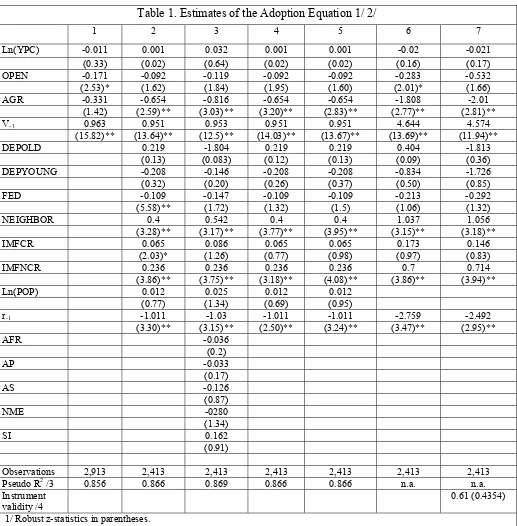
Table 1 reports the results of dynamic probit estimation of (8). For ease of interpretation, coefficient estimates are expressed as marginal effects in the first five columns: they are thus to be read as the impact on the probability of VAT adoption of a small change in a
continuous variable or of a change from zero to unity in a dummy (evaluated at the mean of the regressors). The z-statistics relate to the underlying coefficients.
Column 1 reports a baseline specification, including as regressors only those variables most standard in the ‘tax effort’ literature—income per capita, openness, and the size of the agricultural sector—together with the lagged VAT dummy. The last of these proves highly significant, as the discussion above would lead one to expect. While it may seem surprising that there is no sign of higher income countries being more likely to adopt a VAT; this is simply stresses that with its spread over the last twenty years or so it has ceased to be a tax only for more prosperous economies. Still more striking, and potentially of considerable importance, is that openness enters with a significant negative coefficient.
Table 1. Estimates of the Adoption Equation 1/ 2/
1 2 3 4 5 6 7
Ln(YPC) -0.011 0.001 0.032 0.001 0.001 -0.02 -0.021
(0.33) (0.02) (0.64) (0.02) (0.02) (0.16) (0.17)
OPEN -0.171 -0.092 -0.119 -0.092 -0.092 -0.283 -0.532
(2.53)* (1.62) (1.84) (1.95) (1.60) (2.01)* (1.66)
AGR -0.331 -0.654 -0.816 -0.654 -0.654 -1.808 -2.01
(1.42) (2.59)** (3.03)** (3.20)** (2.83)** (2.77)** (2.81)**
V-1 0.963 0.951 0.953 0.951 0.951 4.644 4.574
(15.82)** (13.64)** (12.5)** (14.03)** (13.67)** (13.69)** (11.94)**
DEPOLD 0.219 -1.804 0.219 0.219 0.404 -1.813
(0.13) (0.083) (0.12) (0.13) (0.09) (0.36)
DEPYOUNG -0.208 -0.146 -0.208 -0.208 -0.834 -1.726
(0.32) (0.20) (0.26) (0.37) (0.50) (0.85)
FED -0.109 -0.147 -0.109 -0.109 -0.213 -0.292
(5.58)** (1.72) (1.32) (1.5) (1.06) (1.32)
NEIGHBOR 0.4 0.542 0.4 0.4 1.037 1.056
(3.28)** (3.17)** (3.77)** (3.95)** (3.15)** (3.18)**
IMFCR 0.065 0.086 0.065 0.065 0.173 0.146
(2.03)* (1.26) (0.77) (0.98) (0.97) (0.83)
IMFNCR 0.236 0.236 0.236 0.236 0.7 0.714
(3.86)** (3.75)** (3.18)** (4.08)** (3.86)** (3.94)**
Ln(POP) 0.012 0.025 0.012 0.012
(0.77) (1.34) (0.69) (0.95)
r-1 -1.011 -1.03 -1.011 -1.011 -2.759 -2.492
(3.30)** (3.15)** (2.50)** (3.24)** (3.47)** (2.95)**
AFR -0.036
(0.2)
AP -0.033
(0.17)
AS -0.126
(0.87)
NME -0280
(1.34)
SI 0.162
(0.91)
Observations 2,913 2,413 2,413 2,413 2,413 2,413 2,413
Pseudo R2 /3 0.856 0.866 0.869 0.866 0.866 n.a. n.a.
Instrument
validity /4 0.61 (0.4354)
1/ Robust z-statistics in parentheses.
2/ * significant at 5 percent; ** significant at 1 percent.
3/ Pseudo R2 is unity minus the ratio of the maximized log likelihood to the log likelihood when only a constant term is included.
Starting with the first of these, it has been evident for some time that the VAT has tended to spread in regional bursts. What the findings here add is an indication that this regional aspect to the spread of the VAT does not reflect simple correlation with some deeper common causes. What remains unclear, however, is quite what it is that is driving these regional bursts.19 Since direct international spillovers from the VAT are relatively limited—the gain from adopting a VAT is not obviously greater if one’s trading partners also have a VAT—the answer seems likely to lie in some form of yardstick competition, with countries noting the stronger performance of neighbors with a VAT in place.
The significant impact on the adoption decision of participation in an IMF program— countries that enter a non-crisis program without a VAT having a 25 percent higher chance of adopting one in the year thereafter, all else equal—tends to confirm the widespread perception that the Fund itself has played a significant role in the spread of the VAT. While this variable may to some extent be proxying fiscal difficulties that in themselves point towards revenue enhancement, including through the adoption of a VAT, the effect remains even with the inclusion of lagged tax revenue. And indeed—as one might expect given that adoption of the VAT is a major structural reform, not a quick revenue-raiser—it is
participation in a program focused on structural adjustment rather than a crisis-related program that is associated with a greater likelihood of adoption.
Third, the significantly negative coefficient on lagged revenue suggests, also as one would expect, that the likelihood of undertaking the major effort of VAT adoption is lower the greater is a country’s ability to raise revenue from existing sources.
The FED dummy is also highly significant in Column 2, with federal countries emerging as less likely to adopt a VAT. This is as the technical issues noted above would lead on to expect, at least for federations in which sales tax powers are largely reserved to lower-level government.. As will be seen, however, this effect, proves less robust than the three just discussed.
The demographic variables added in column 2 seem to have no effect on the probability of adoption, a result that recurs in all our specifications. There thus appears to be no significant force, for example, to the political economy argument that the VAT is more likely to be adopted where the young have greater political influence, since one of the main
consequences of introducing a VAT (which typically means strengthening taxes on
consumption) is a redistribution away from the elderly. This may reflect the availability of other instruments by which the same type of intergenerational redistribution can be achieved; any other form of general consumption tax, for example, is in this respect likely to have much the same effect as a VAT.
The specifications in the first two columns have the unattractive feature of precluding any heterogeneity across countries. Since maximum likelihood estimation of the parameters of
interest δ is inconsistent in the presence of fixed effects,20 and a random effects specification yields results essentially identical to those reported in column 2, the regional dummies described above are added in column 3. The coefficients on these show relatively low take-up of the VAT in the Americas (in the Caribbean, rather than the mainland) and in the Middle East (relative to the baseline of the EU, in which adoption is compulsory). Estimates for the remaining variables remain broadly unchanged except that the coefficient on the FED dummy becomes marginally insignificant. This is as might be expected, as some regions will contain more federal countries than others.
Turning to robustness, columns 4 and 5 repeat the specification of column 2 but allow for clustering in the error terms within years (which allows generally for spatial correlation) and countries (which allows generally for serial correlation) respectively: this affects only the standard errors of the estimates, not their point values. The broad conclusions are unaffected. For completeness of interpretation, column 6 reports in probit form the same specification as in column 2, so that the coefficients correspond directly to δ in equation (8).
One particularly intriguing aspects of these results is the role in the adoption decision that emerges for openness. Looking across specifications 1–5, it has a consistently negative impact on the probability of adoption, and this is significant at the 10 percent level or better (a z-statistic of 1.64) in three of the five regressions. Deferring the interpretation of this until the next subsection, it is important to consider first whether this aspect of our results might not simply reflect a specification error. For a country’s openness is plausibly endogenous to the presence of a VAT: to the extent that export refunds are improperly denied, for example, the VAT may function as an export tax and thus be a cause of, rather than a consequence of, reduced openness. The point is one of some importance. As noted earlier, Desai and Hines (2005) interpret their finding that (at least for low income countries) openness is lower, all else equal, in countries that have a VAT as suggestive that the VAT may in practice operate to some degree as an export tax. But it could be, conversely, that the apparently negative impact of the VAT on openness stressed by Desai and Hines arises simply because more open economies are for some reason less likely to adopt a VAT, and does not reflect the impact of the VAT itself.
To explore this issue, the final column of Table 1 drops population as an explanatory variable, and then instruments openness by population. Population is known to be strongly correlated with openness and also plausibly exogenous (it is always very insignificant, with a very small coefficient, in regressions 2–5). In column 6—where it is not instrumented— OPEN enters with a significantly negative coefficient. In column 7, the coefficient remains negative, increases in magnitude, and is still significant at 10 percent. The implication is that openness does indeed negatively affect the probability of adoption. It may thus be premature to conclude from the negative association between openness and the presence or extent of a VAT that the VAT itself has tended to be damaging to trade performance.
B. Revenue Impact of the VAT
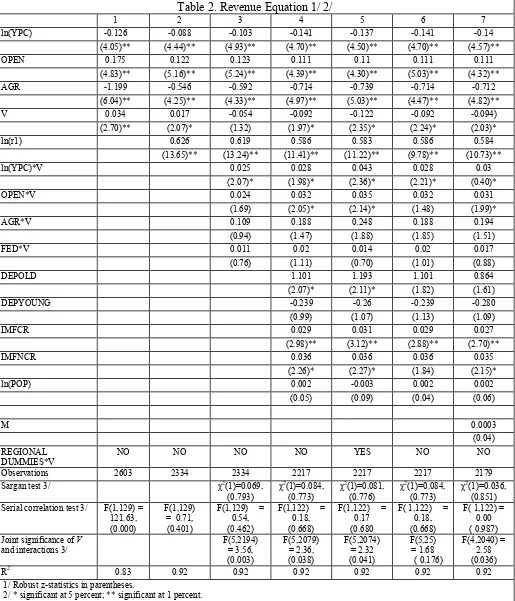
Estimates of the VAT-augmented revenue equation (7) are reported in Table 2, the dependent variable in each case being the log revenue ratio, ln(r). Country fixed effects are included in all regressions (a Hausman test decisively rejecting a random effects specification21), but for brevity are not reported.
To provide a simple benchmark, column 1 takes a basic tax effort equation, with only a few traditional favorites appearing, and simply adds the VAT dummy. Though not our primary concern, it is convenient to consider first the results for the traditional favorites—which are in qualitative terms broadly unchanging across the specifications considered.
The strong positive effect of openness that emerges is well known from Rodrik (1998) and others, and the negative association of revenue with the share of agriculture is also
unsurprising (this being a hard sector to tax, as noted above).
The significantly negative effect of per capita income is more surprising, in that it seems to be widely presumed—in line with Wagner’s law, invoking an income elasticity of demand for public services in excess of unity—that government size typically increases with the level of income. In fact other studies that, as here, control for country fixed effects have also found a negative association between per capita income and government size: this result recurs, for example, in Rodrik (1998). While it is not our purpose here to explain this regularity, it is important to note that such a negative effect is perfectly consistent with the simple
framework of Section II; and, indeed, that framework itself suggests that the measured income effect may well be negative even if the underlying income elasticity exceeds unity. All this follows on differentiating the function r(V,Y) implicitly defined by (2) to find (details being in Appendix B) that the impact on the revenue ratio of an increase in income,
Y
r , has the same sign as EΩ−1,where E denotes the income elasticity of demand for the public good, and Ω∈[0,1], with Ω=1 if YR =YRR =0. If taxation were lump sum, for
example, so that Ω=1, then the revenue ratio would indeed be increasing if and only if the income elasticity exceeds unity. But this is no longer the case once the efficiency costs of raising revenue are recognized. These naturally temper the taste for increased public spending, making it more likely that, all else equal, the tax ratio will fall with income.
Table 2. Revenue Equation 1/ 2/
1 2 3 4 5 6 7
ln(YPC) -0.126 -0.088 -0.103 -0.141 -0.137 -0.141 -0.14
(4.05)** (4.44)** (4.93)** (4.70)** (4.50)** (4.70)** (4.57)**
OPEN 0.175 0.122 0.123 0.111 0.11 0.111 0.111
(4.83)** (5.16)** (5.24)** (4.39)** (4.30)** (5.03)** (4.32)**
AGR -1.199 -0.546 -0.592 -0.714 -0.739 -0.714 -0.712
(6.04)** (4.25)** (4.33)** (4.97)** (5.03)** (4.47)** (4.82)**
V 0.034 0.017 -0.054 -0.092 -0.122 -0.092 -0.094)
(2.70)** (2.07)* (1.32) (1.97)* (2.35)* (2.24)* (2.03)*
ln(r1) 0.626 0.619 0.586 0.583 0.586 0.584
(13.65)** (13.24)** (11.41)** (11.22)** (9.78)** (10.73)**
ln(YPC)*V 0.025 0.028 0.043 0.028 0.03
(2.07)* (1.98)* (2.36)* (2.21)* (0.40)*
OPEN*V 0.024 0.032 0.035 0.032 0.031
(1.69) (2.05)* (2.14)* (1.48) (1.99)*
AGR*V 0.109 0.188 0.248 0.188 0.194
(0.94) (1.47) (1.88) (1.85) (1.51)
FED*V 0.011 0.02 0.014 0.02 0.017
(0.76) (1.11) (0.70) (1.01) (0.88)
DEPOLD 1.101 1.193 1.101 0.864
(2.07)* (2.11)* (1.82) (1.61)
DEPYOUNG -0.239 -0.26 -0.239 -0.280
(0.99) (1.07) (1.13) (1.09)
IMFCR 0.029 0.031 0.029 0.027
(2.98)** (3.12)** (2.88)** (2.70)**
IMFNCR 0.036 0.036 0.036 0.035
(2.26)* (2.27)* (1.84) (2.15)*
ln(POP) 0.002 -0.003 0.002 0.002
(0.05) (0.09) (0.04) (0.06)
M 0.0003
(0.04)
REGIONAL DUMMIES*V
NO NO NO NO YES NO NO
Observations 2603 2334 2334 2217 2217 2217 2179
Sargan test 3/ χ2(1)=0.069,
(0.793) χ
2(1)=0.084,
(0.773) χ
2(1)=0.081,
(0.776) χ
2(1)=0.084,
(0.773) χ
2(1)=0.036,
(0.851) Serial correlation test 3/ F(1,129) =
121.63, (0.000)
F(1,129) = 0.71, (0.401)
F(1,129) = 0.54, (0.462)
F(1,122) = 0.18, (0.668)
F(1,122) = 0.17 (0.680
F( 1,122) = 0.18, (0.668)
F( 1,122) = 0.00 ( 0.987) Joint significance of V
and interactions 3/ F(5,2194) = 3.56, (0.003) F(5,2079) = 2.36, (0.038) F(5,2074) = 2.32 (0.041) F(5,25) = 1.68 ( 0.176) F(4,2040) = 2.58 (0.036)
R2 0.83 0.92 0.92 0.92 0.92 0.92 0.92
1/ Robust z-statistics in parentheses.
But interest here focuses, of course, on the role played in this VAT-augmented tax effort equation by the VAT dummy. And here the key feature of Column 1 is that the presence of a VAT emerges as being significantly and positively associated with the tax ratio. The effect is not, however, very large: adoption increases the revenue ratio by 3.4 percent. This is about one half of a percentage point of GDP, for example, at an initial revenue ratio of 15 percent: substantial, though not spectacular, and certainly indicative of a worthwhile gain in
effectiveness of the tax system from adoption of the VAT.
The baseline specification in column 1 is only an instructive first pass, however, being marked by serial correlation of the errors.22 To deal with this, the remaining columns include the lagged dependent variable, addressing the potential bias this creates (which may in any event be fairly modest, as the time dimension of the panel is fairly long) by instrumenting using third and fourth lags. Columns 2–7 show that proceeding in this way removes the serial correlation in column 1. Moreover, all specifications in columns 2–7 pass the Sargan test for instrument validity.23
Column 2 simply adds these dynamics to the baseline specification of column 1, implying now a distinction between short- and long-run effects of VAT adoption. The short run effect is to increase the revenue ratio by 1.7 percent. In the long run, however, the effect is to increase the revenue ratio by 4.54 percent (=1.7/(1-0.626)); again a sizeable revenue gain, though not a spectacular one.
Column 3 adds interaction terms that enable the impact of the VAT to be more than a simple shift of intercept, potentially varying across countries according to their income levels, openness, reliance on agriculture, and whether they are federal or unitary. Column 4 adds more control variables (the same set as in the adoption equation), and column 5 adds region dummies interacted with VAT, in order to investigate whether VAT adoption has had different effects in different regions. Column 6 clusters by year to allow for spatial
correlation in the error term (generally increasing the standard errors with many degrees of freedom used in the estimation of partial correlations). Finally, column 7 allows for
correlation between the errors in revenue and probit equation, in the manner described above.
22 The statistic reported in Table 2 is a simple test for serial correlation in the presence of fixed effects proposed by Wooldridge (2002, p275). This runs a pooled OLS regression of the estimated residuals from (7), uˆit , on
1
ˆit−
u . The error term in this auxiliary regression is clustered by country, to allow for the fact that under the null hypothesis of no serial correlation in uˆit, the time-demeaned errors are negatively correlated. The null
hypothesis of no serial correlation is then simply the hypothesis that the lagged residual is not significant in this regression. The table reports F-statistics for the null hypothesis, along with the p-values for this test statistic in brackets.
23 The Sargan test for over identification regresses the estimated residuals from the IV equation it
Several conclusions emerge robustly from specifications 3–7. Again it is useful to dispense first with the impact of the non-VAT controls. DEPOLD is positively associated with the tax ratio, reflecting the fiscal costs associated with a more elderly population: this, as noted earlier, is in line with previous results. Participation in a Fund program, whatever its nature, is also associated with significantly higher revenue ratios: by something in the order of 3 percent. Importantly, the coefficient on the Mills ratio variable M in column 7 is
insignificant and small: there is thus no evidence that the errors in the probit and the revenue equations are correlated:
What is most important for present purposes, is the significance and complexity of the interaction terms in V that emerge. One broad effect of introducing these is that the coefficient on the simple VAT dummy becomes significantly negative. The first two
interaction effects (only)—with income per capita and openness—are significant in (almost24) all of the specifications. Moreover, in all of these specifications an F-test of the joint
significance of the VAT dummy, both on its own and interacted, is almost always significant at the 5 percent level, the exception being when allowance is made for potential spatial correlation of the errors (in specification 6). This leaves little doubt that the VAT has, in itself, had a significant effect on revenue performance and hence too, by the argument in Proposition 1, on the effectiveness of overall tax systems. What is not immediately obvious, as will be seen shortly and analyzed further in the next section, is whether this effect has on balance been positive.
Turning to the individual interaction effects, the robustly positive coefficient on ln(YPC)*V . is consistent with the widespread notion that higher income countries cope more easily with the distinct administrative and compliance requirements of the VAT.25
A second and especially intriguing result is that the coefficient on the interaction term
OPEN*V is generally positive, implying that more open economies gain more, all else equal, from adoption of the VAT 26 This in itself is easily rationalized. VAT collections at the border typically account for a large part of total VAT revenues: most developing countries, in particular, collect more than half of their gross VAT revenues in this way.27 The border, that is, is a good tax handle for the VAT, just as it is for tariffs. All else equal, one would thus expect the VAT to function better in more open economies, since the tax base is then more readily accessible. What is less clear, however, is how this can be reconciled with the earlier
24 The t-statistic for the interaction OPEN*V has a p-value of 0.09, and so is significant at the 10% level, in specification 3, but has a p-value of only 0.15 in specification 6.
25 This result is also consistent with Ebrill and others (2001): they too find, in their cross-section analysis, a revenue gain associated with adoption of the VAT that increases with the level of income.
26 Ebrill et al (2001) find the opposite, with the revenue gain from adoption lower in more open economies. The insignificance of the Mills term found above suggest that this is unlikely to be a consequence of their failure to control for endogeneity of the VAT. It may rather reflect the inclusion in their sample of the CRBO countries that we omit: these are relatively closed economies, all of them with a VAT.
finding that more open economies are less likely to adopt a VAT: if these are economies in which the revenue performance of the VAT is likely to be better, should they not also be more likely to adopt it? The two findings are clearly consistent, however, if for some reason adoption of a VAT is particularly costly in more open economies. And that may indeed be the case for many developing countries. For a relatively open developing country, tariffs are a comparatively easy source of revenue, implying correspondingly weakened incentives to develop the ability to enforce tax collection inland. While a VAT may prove to be an even more effective revenue source, its implementation generally requires a fundamental change in the way of doing tax business domestically, with the development of methods of self-assessment quite different from those commonly associated with tariff collection. The need for such wider modernization of domestic tax administration to implement a VAT (including, in many cases, a fundamental restructuring of the tax administration) is indeed widely seen as a principal benefit of introducing a VAT, acting as a catalyst for wider reform. It may be that these costs are systematically greater in more open countries that have traditionally been more reliant on tariff revenue, even if that same feature—greater openness—points to greater benefits once those costs have been incurred.
Given the interaction terms and additional controls, the further effect of region dummies interacted with the VAT dummy (in column 5) is negligible. To save space, these coefficients are not reported: they are neither individually nor jointly significant.
The pattern of effects that emerge is thus quite complex. In particular, the differing signs of the intercept shift and interaction effects associated with the VAT imply that the sign of the revenue impact of the VAT, and hence the direction of the apparent effect of the VAT on the overall effectiveness of the tax system, varies across countries according to their
characteristics. To explore this—and derive a sense of whether or not most countries are likely to have gained, or stand to gain, from the adoption of the VAT—the estimated equations above can be used to generate country-specific estimates of the revenue gain or loss from adopting the VAT. That task is taken up in the next section.
V. PREDICTING THE REVENUE GAINS FROM A VAT
The purpose now is thus to explore in quantitative terms the basic qualitative ambiguity implied by the results of the preceding section: Do those results imply that all, some, or none of the countries which have adopted a VAT will have experienced a revenue gain—and hence too an improvement in the effectiveness of their tax systems—from doing so? And what of the countries that did not adopt? Would they indeed be expected to lose effectiveness from adoption?
The task then is essentially one of prediction. In interpreting the predictions, however it is important to stress that these relate only to the revenue and efficiency gains from the VAT once it has been adopted. As discussed in Section II, moving to a VAT may in itself require incurring costs that need also to be borne in mind in assessing revenue and effectiveness effects from an appropriately wider perspective.
selection bias. Thus any of the regressions in Table 2 can be used to predict changes in the tax ratio as a result of the introduction of a VAT. As the region dummies are uniformly insignificant in column 5 of Table 2, we use for this purpose the regression 4 of Table 2. This predicts the short-run change in r associated with the presence of a VAT to be
it V FED it
V AGR it
V OPEN it
V YPC
it YPC OPEN AGR FED
r =βˆ * ln +βˆ * +βˆ * +βˆ *
Δ (11)
where βˆX*V is the estimated coefficient on the interaction between X and the VAT dummy.
Consider first the prediction for countries that had not adopted a VAT by the end of the sample period in 2000. Short of undertaking the exercise of forecasting future values of the control variables, the natural approach is to calculate the impact effect of introduction in 2000: that is, to use (14) to calculate Δri,2000 for these countries. The long-run effect can then be obtained by multiplying Δri,2000 by 1/(1−λ), where λ is the coefficient on the lagged dependent variable. From regression 4 of Table 2, λ = 0.586, so the long-run effect is 2.41 times the impact effect. To correct for fluctuations over the business cycle (in YPC and OPEN in particular), and to deal with gaps in the data, the lower part of Table 3 presents the average of Δri,tfor the period 1990-2000. The mean value of the impact effect is shown by region, along with the numbers of countries for which the impact is positive or negative. Except in sub-Saharan Africa, nearly all countries without a VAT in 2000 are predicted to gain from its introduction. And for some regions the mean predicted percentage increase in total revenue is quite large: 6 percent, for instance, in the Americas.
For countries that had adopted a VAT by the end of the sample period, we calculate the percentage increase in the tax ratio in the year 2000, taking into account the cumulation of gains (through the lagged dependent variable) since introduction. This is simply
λ λ2000 τ ,τ 1999
, 2000
, i ... i
i r r
r + Δ + Δ
Δ − (12)
where I denotes the year in which country i adopted the VAT. These cumulated but annual effects are shown in the upper part of Figure 3. The mean value of the effect is again shown by region, along with the number of countries for which it is positive or negative. In most regions, a clear majority of countries emerge as gaining from the VAT. For sub-Saharan Africa, however, the numbers are more balanced.
25 Table 3: Revenue Effects of the VAT—Illustrative Calculations 1/
Asia-Pacific Americas EU+ North Africa and Middle East
Small Islands Sub–Saharan Africa
Critical income level 2/ 1,546 3,027 4,462 3,083 1,785 1,124
Countries with a VAT: 3/ Number with Δr >0 Number with Δr <0 Average (Δr/r)
19 3 2.10
14 9 0.51
17 0 4.15
3 2 0.45
8 0 4.03
11 14 -0.81
Countries without a VAT: 3/
Number with Δr >0 Number with Δr <0 Average
(
Δr/r)
6 1 4.73
3 0 6.24
-- --
9 0 0.02
13 1 2.87
8 6 0.91
Source:Authors’ calculations.
1/ Calculated from point estimates in Column (4) of Table 2. Regions defined as in Appendix 1 of Ebrill et al (2001). For countries that adopted a VAT within the sample period, the calculation is of the percentage gain from the date of adoption until the end of the sample period (2000). For countries that have not adopted by 2000, it is of the average predicted percentage gain based on the averages of the control variables over the period 1990-2000.
2/ Income level (2000 USD, in PPP) above which adoption of the VAT would be predicted to increase the tax ratio, evaluated at region means of OPEN, AGR and FED.
3/ As of 2000.
VI. SUMMARY AND CONCLUSIONS
The remarkable rise of the VAT has attracted remarkably little analytical or empirical attention. This paper attempts to start filling this gap, exploring both the causes and consequences of the spread of VAT. Using a panel of 143 countries observed over 25 years, we estimate a recursive two-equation system characterizing both the decision to adopt a VAT and the impact of the VAT on revenue once adopted. The latter is of interest not only in itself but also, it has been shown, as an indicator of whether or not the VAT has proved, as its proponents claim, an especially
effective form of taxation.
There emerges a rich set of determinants of VAT adoption. Income per capita, interestingly, is not amongst them: the VAT is no longer the preserve of high income countries. A country is less likely to adopt a VAT, however, the larger is its agricultural sector (this being a hard-to-tax group, and perhaps harder under the VAT than under other taxes), and the lower is its past revenue ratio (suggesting a greater need to enhance revenues). The IMF also appears to have played an independent role and significant role in the spread of the VAT: participation in a non-crisis IMF program in itself significantly increases the likelihood of adopting a VAT. Yardstick competition also seems to have been significant, with a country more likely to adopt a VAT the greater the proportion of others in the region who have already done so. Most strikingly, and intriguingly, the results indicate strongly that, all else equal, more open economies are less likely to adopt a VAT.
A central question in assessing the consequences of the VAT is simply: Has it enabled countries to increase their tax revenues? This is important both in itself—put another way, it relates to the truth of the presumption underlying the ‘money machine’ concerns raised prominently in recent discussions of possible VAT adoption in the United States—and because, in the simple
the overall efficiency of the tax system, but with a greater degree of offset through reduced use of other taxes (notably, perhaps, tariffs). It does suggest, however—given clear signs of