Game Based Learning, Hypotheses as Guidance
Marten S. Korf (s0186449)
University of Twente, Enschede, The Netherlands
Faculty of Behavioural Science: Bachelor Psychology
1
stsupervisor: Dr. H.H. Leemkuil
2
ndsupervisor: Dr. H. van der Meij
1 | P a g e
ABSTRACT
The goal of this study is to examine whether it would be possible to guide students to specific learning goals by giving them pre-formulated hypotheses. These hypotheses were presented to the students in the experimental group as instructional support. They used them as a guide to explore the game Lemonade Tycoon 2, New York City. They had half an hour to learn the game, and half an hour to achieve a high game score. After gameplay students filled in a knowledge test about what they learned from the game. Students in the experimental group scored better at answering the hypotheses-related questions. Therefore there is evidence that the pre-formulated hypotheses have helped the students by guiding them to their learning goals.
2 | P a g e
Game based Learning (GBL) is a powerful instrument to teach students problem solving skills and domain specific knowledge. A well-constructed game can contribute to increased motivation to learn and increased time on task (Slavin, 2003). Games are a safe environment in which students can test, in an engaging way, different variables and get quick feedback on their expected outcomes. The feeling of being in control, an appealing context, and interface (Leemkuil, 2006) contribute to long lasting motivation to learn things they might not even be interested in.
Garris et al. (2002) found that students in a virtual environment feel strongly involved, are focused and motivated to reach long term goals. Other benefits are high and active engagement, tailored learning pace, immediate feedback, transferable experience and risk-free exploration of consequences (Trybus, 2009).
EdTechReview defines GBL as a type of game play that has specific defined learning outcomes. Generally, GBL is designed to balance subject matter with gameplay and the ability of the student to retain and apply acquired knowledge to the real world. In addition to this definition Wouters et al. (2013) points out that games for educational purposes should be interactive (Prensky, 2001; Vogel et al., 2006) based on a set of agreed rules and constraints (Garris et al., 2002), directed toward a clear goal that is (often) set by a challenge (Malone, 1981), and constantly providing feedback either as score or a change of the virtual world (Prensky, 2001).
3 | P a g e
go wrong? In order to achieve personal goals or a goal set by the game or a third party, people constantly formulate hypotheses (Gee, 2003). Testing these hypotheses makes them explore the concepts in the game and learn the variety of ways to interact and manipulate the variables behind these concepts. Using the feedback provided by the game in the form of a score or feedback report they can confirm or dismiss their current hypothesis and formulate a new one. Regardless of the outcome of the hypothesis, they have explored and learned about variables and concepts in the game. This would be the ideal situation, but so far experiments show that students have difficulties indicating variables, formulating testable hypotheses and drawing conclusions (De Jong, 2006; Leemkuil, 2011).
So where can it go wrong? Wouters et al. (2013) concluded that without instructional support students may use their limited cognitive capacity for ineffective activities and focus on irrelevant information at the cost of activities that contribute to learning. Therefore instructional support is needed to guide students in selecting and organizing useful information. Any directed support, like feedback, explanations and scaffolding, influencing the learning task can be seen as instructional support. But, too much instructional information inside or outside the game will overload the working memory (Atkinson et al., 2000). Since games already come with in-game instructions there is not much room left for instructional support. And yet instructional support has great benefits for learning domain-specific knowledge from a game.
4 | P a g e
needed to choose the most relevant hypothesis out of three presented alternatives. After making a decision they needed to find evidence in the game to test the chosen hypothesis. Results show that the students choosing a higher number of correct hypotheses to test, demonstrated higher learning gains and completed more in-game goals than students choosing less correct hypotheses to test. Although the students were not able to explain why they chose the hypothesis, Spires et al. (2011) concluded that hypothesis testing strategies play a central role in narrative-centred learning environments, demonstrating their connections to learning gains and problem solving in game play. Therefore it is interesting to examine the possibility of using pre-formulated hypotheses as instructional support outside of the game, as a follow up on the results of Spires using in-game hypotheses.
The goal of this study is to examine whether it would be possible to guide students to specific learning goals by giving them pre-formulated hypotheses, which should challenge them to explore specific concepts in the game. This should help them gain more explicit knowledge from the game by manipulating the variables influencing those specific concepts.
5 | P a g e
the scores of the second round of gameplay are used for analyses. After gameplay students fill in a post-test questionnaire functioning as a knowledge test about what they learned from the game.
The prediction is that students with pre-formulated hypotheses as instructional support will perform better at (1) the post-test questionnaire and (2) the game than the students in the control group without any instructional support. Furthermore it is expected that there is a correlation between (3) the scores on the post-test questionnaire and the game score.
METHOD
Participants
In this study 33 students participated, 17 female and 16 male, with the average age of 20 years. The control group consisted of 16 students (10 female, 6 male) and the experimental group of 17 students (7 female, 10 male). Students from both groups participated in exchange for course credits of the Bachelor Psychology program.
Materials
Pre-test questionnaire
6 | P a g e
spend on playing any version of Lemonade Tycoon (5). Aside from these five questions, also age, gender and Sona-systems code were requested.
The game
[image:7.612.72.382.431.666.2]For this study the game Lemonade Tycoon 2 – New York City was used. In this game players are challenged to grow from a small start-up lemonade stand to become a lemonade tycoon. This business simulation challenge provides players with some concepts of real life business, and players are able to influence costumer satisfaction, popularity and their balancesheet by manipulating corresponding variables like product, place, price, promotion and personnel (marketing mix). In the career mode, used in this study, players start with one basic lemonade stand in a low rent district with a standard starting capital of 500. This start is enough for purchasing the right amount of ingredients, and allows for expanding within the district, move to a more popular district or upgrading the stand / buying upgrades for stand.
Figure 1:Screenshot from Lemonade Tycoon 2, New York City
7 | P a g e
Five hypotheses were used to challenge students to find specific concepts in the game and to manipulate their variables (appendix 2). Structurally, the hypotheses were identical. Each hypotheses informed the student about two concepts and the relation between them. The hypotheses were positively, truthfully-stated and non-falsifiable. An example of a hypotheses used in this study is the following: Increased popularity of your stand positively influences total revenues. This hypothesis informs the student about popularity and revenues being a concept in the game, and it states the relationship between popularity and total revenues. This hypothesis is designed to challenge the students to find the variables influencing popularity and to find out how they can manipulate them to achieve the best results. Table 1 shows the five hypotheses and their related questions.
Table 1. The five hypotheses and their related questions.
H1: Minimizing waiting time positively influences customer satisfaction Q5: Name three ways to lower waiting time
H2: Optimizing ordering lemon, sugar, ice and cups positively influences net profit
Q6: Describe for each of the stock products the optimal way to place an order, before you have purchased any upgrades
H3: Increased popularity of your stand positively influences total revenues Q7: Name three ways to increase the popularity of your stand
H4: Minimizing the need for marketing campaigns positively influences net profit
Q8: Describe three situations when you would or when you wouldn’t run a marketing campaign
H5: Optimizing product pricing positively influences total revenues
Q9: Describe three factors influencing your decision making process for pricing the products
8 | P a g e
The post-test questionnaire consisted of nine questions. It was used as a measuring tool for explicit knowledge derived and derivable from concepts in the game (appendix 3). The questionnaire contained only open questions formulated as one short sentence each. The first four questions were about a few basic concepts of the game, which were not directly related to the hypotheses (category 1). Answering these questions would not require being able to manipulate variables in the game but rather making observations during game play. An example of a category 1 question is: Name three reasons for customers to be unsatisfied. In the customer feedback section of the game players can find the answer to this question. Formulating hypotheses and manipulating variables are not needed for this. The last five questions were explicitly related to the pre-formulated hypotheses (category 2). Answering these questions required to have explored specific concepts and to have drawn correct conclusion during the process of manipulating the variable of these specific concepts. An example of a category 2 question is: Name three ways to increase the popularity of your stand. This question is directly related to the hypothesis that is formulated to challenge students to find which variables manipulate the popularity of the stand.
Game score
The game score was calculated by dividing retained earnings by the amount of days, that have passed, in the game. This gives an average retained earnings as game score. This method of scoring was selected because it is the only one that shows the players progress in terms of both cash and investments done over time.
9 | P a g e
The students participating were randomly devided in two groups using a fixed interval schedule. Each student participated solo and used a dedicated disturbance free room with a computer. The students were instructed to fill in the pre-test questionnaire. After doing so, they were shown the game and received information and instructions about the session: “During this research you will be playing the game Lemonade Tycoon 2. You will play the game twice, for half an hour, and afterwards you will receive a questionnaire. In the first half an hour your goal is to learn the game as much as you can. In the second half an hour you will be challenged to reach the best score you can. You are not allowed to use walkthroughs or tutorials.” Students in the experimental group received the list with hypotheses. They were instructed to checkmark the hypotheses they tested during gameplay. This request was given to make sure the students were aware of the hypotheses and that they used them during gameplay. Both groups were instructed that they were allowed to restart the game in the first half an hour voluntarily or when they would get stuck. In the second half an hour they could restart only when they would get stuck. Between the two sessions of gameplay two informal questions were asked: whether they succeeded and about the weather in the game. This was done in order to standardize the break between saving the game data and restarting the new game. The answer to what the students would say was always “ok”. After the second gameplay session the students were given the post –test questionnaire and they were told that after they filled it in they were allowed to leave the room. Afterwards the students were allowed to ask questions about the research.
10 | P a g e
For the scoring of the post-test questionnaire an answering key was developed (appendix 4). This was done by using the answers given by the students, definitions of terms and concepts, the game and data analysis. The goal for each question was to construct a good predictor for explicit knowledge in order to distinguish between students who learned and explored, and those who didn’t. The answers had to be concluded from the game, to be correct, to answer the question, and were not allowed to overlap. Additionally, when asked, the answers had to be descriptive. Following the example of the question “Name three ways to increase the popularity of your stand” four answer categories were formulated: price, product, marketing, and upgrade related. For each category a maximum of one point was given. For example, answering radio advertisement and newspaper advertisement, both in the category of marketing, would lead to one point although both answers individually would be seen as correct.
For the data analyses, multiple independent t-tests were conducted using SPSS to measure the differences between the two groups. This was done for the category 1 questions (maximum 8 points), for the category 2 questions (maximum 15 points), for the total post-test questionnaire (maximum 23 points), and for each individual question. Also multiple Pearson correlation tests were conducted resulting in a correlation matrix (Table 3), for each group, for scores on game, question category 1, question category 2, total questionnaire and total experience.
11 | P a g e
the combined experience score no difference was found between the two groups (t (31) = .935, p = .357. Therefore no corrections are done in further analyses.
RESULTS
In order to find an answer for the main research question of this thesis the difference in scores of the category 2 questions are the most relevant because these questions are formulated based on the pre-formulated hypotheses. The independent t-test for scores give t (31) = 3.05 which gives p = .005 (2-tailed), which is a strong difference. Also a strong difference is found for the total questionnaire score (t (31) = 2.87, p = .007 (2-tailed)). For the category 1 questions no difference is found (t (31) = 1.078, p > 0.1). Table 2 shows the average scores of each group for the category 1 questions, the category 2 questions and the total score. The maximum score for category 1 was 8 points, and for category 2 it was 15. This gives a total maximum of 23 points.
[image:12.612.69.436.532.646.2]Table 2 also shows the game score, which is the averaged retained earnings. To answer the second research question an independent t-test was conducted on the game scores, giving t (31) = 0.54, p > 0.1. Therefore nu difference was found between the two groups based on game score.
Table 2. Descriptive statistics for the scores on the post-test questionnaire
Group Category-1 Category-2 Total Game
Control 5.38 7.97 13.34 -10.49
(1.09) (1.98) (2.66) (31.92) Experimental 5.82 10.06 15.88 -5.36 (1.29) (1.95) (2.42) (21.70)
12 | P a g e
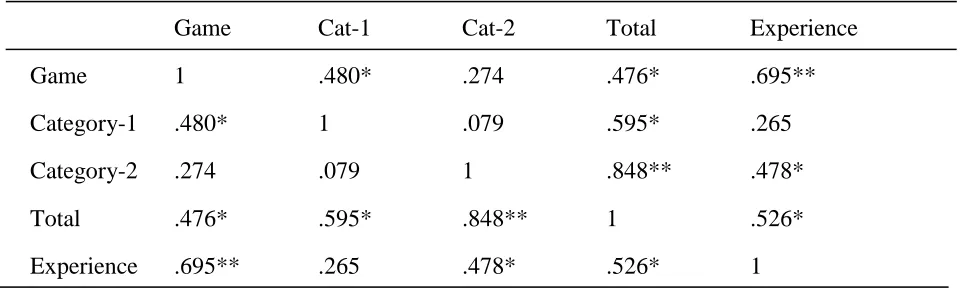
[image:13.612.60.542.315.461.2]in the first column of the table. For the experimental group significant correlations were found for game score with category 1 and total questionnaire, but not for game score with category 2. For the control group no correlations were found between game score and questionnaire scores. Other interesting results are the correlations for the experimental group between total experience and game, category 2 and total questionnaire score. Furthermore, for the experimental group a correlation is found for total questionnaire score with category 1 and no correlation with category 2. For the control group both the categories correlate with the total questionnaire score.
Table 3. Correlation matrix for scores on Game, Question Category 1, Question Category 2, Total Questionnaire, and Total Experience for Control Group
Game Cat-1 Cat-2 Total Experience
Game 1 .313 -.096 .057 .297
Category-1 .313 1 .455* .748** .365 Category-2 -.096 .455* 1 .931** .351
Total .057 .748** .931** 1 .411
Experience .297 .365 .351 .411 1
Correlation matrix forExperimental Group
Game Cat-1 Cat-2 Total Experience
Game 1 .480* .274 .476* .695**
Category-1 .480* 1 .079 .595* .265
Category-2 .274 .079 1 .848** .478*
[image:13.612.57.539.497.641.2]Total .476* .595* .848** 1 .526* Experience .695** .265 .478* .526* 1
13 | P a g e
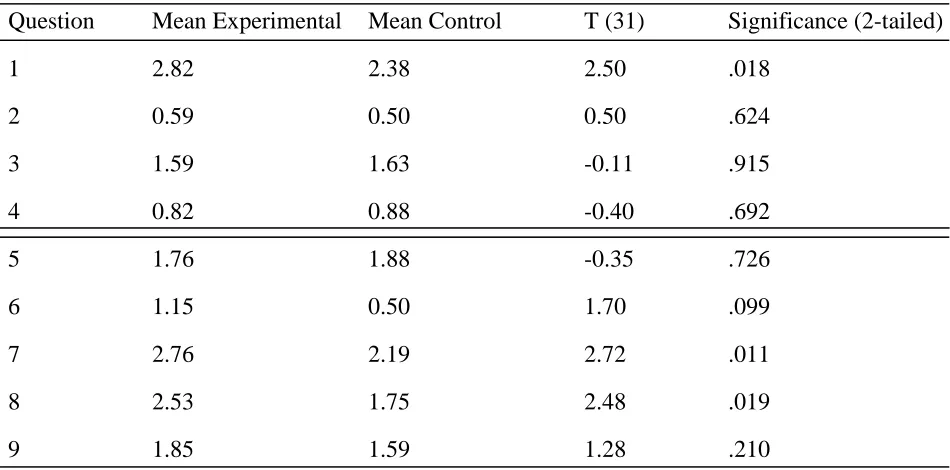
difference. In the top half of the table the four questions of category 1 are presented. For these questions neither group received any guiding. It is therefore curious that a difference is found for the score of question 1.
[image:14.612.68.543.285.520.2]The bottom half of the table the five question of category 2 are presented. For these questions the experimental group received guiding. Questions 6,7 and 8 show all three a difference in scores. For questions 5 and 9 this difference was not found.
Table 4. Questions with significant difference between groups
Question Mean Experimental Mean Control T (31) Significance (2-tailed)
1 2.82 2.38 2.50 .018
2 0.59 0.50 0.50 .624
3 1.59 1.63 -0.11 .915
4 0.82 0.88 -0.40 .692
5 1.76 1.88 -0.35 .726
6 1.15 0.50 1.70 .099
7 2.76 2.19 2.72 .011
8 2.53 1.75 2.48 .019
9 1.85 1.59 1.28 .210
14 | P a g e
The goal of this study was to examine whether it would be possible to guide students to specific learning goals by giving them pre-formulated hypotheses. This would challenge them to explore specific concepts in the game which would help them gain more explicit knowledge from the game by manipulating the variables influencing those specific concepts.
Students in the experimental group scored better at answering the hypothesis-related questions. The answers they provided were more descriptive. They were able to give more distinctive variables for manipulating the different concepts. Therefore there is evidence that the pre-formulated hypotheses have helped the students by guiding them to their learning goals. Since there is no difference found between the scores of the two groups on the non-hypotheses related questions, we can conclude that the groups were of equal basic skill. For standardizing the results it was important to pay attention to the difference in experience between the two groups. There was a consistent correlation between self-estimated experience and scores on the post-test questionnaire, as shown in Table 3 of the results section. In this study there was no difference between the two groups on the total experience score. It is therefore logical to accept that the difference between the two groups on hypothesis-related question is explained by the pre-formulated hypotheses as instructional support.
No difference was found between the game score of the two groups. A difference was expected because of a head-start of information for the experimental group due to the hypotheses that were given to them. It might be that the students in this group focussed too much on testing these hypotheses, and that they paid less attention to other concepts in the game and their variables.
15 | P a g e
hypotheses scored better on the questionnaire than the students that focused mainly on getting a high game score. As further evidence for this conclusion, no correlations was found between the scores of category 1 and 2 of the questionnaire, and the score of the total questionnaire correlates with the score of category 1.
How do these finding relate to other researches? Spires et al. (2011) concluded that the students in his study that choose a higher number of correct (in-game) hypotheses to test, demonstrated higher learning gains. In this study the hypotheses were presented outside of the game and they were all formulated to be beneficial for learning. The students that played the game with these hypotheses scored better on the post-test questionnaire than the students that played without. The results for providing hypotheses outside of the game as instructional support are in line with Spires et al. (2011) results of presenting them inside the game.
16 | P a g e
concept in the game, whilst students in the experimental group mentioned that they didn’t know how to influence the concept. This means that they still explored the concept and therefore were guided by the hypothesis. Question 9 (Describe three factors influencing your decision making process for pricing the products) also didn’t turn out to be significant. A possible explanation could be that at least 8 different answer categories can be seen as correct. The question was therefore not exclusive enough to make for a good predictor.
This method with pre-formulated hypotheses would be interesting to explore in further research. This is the case mainly because this type of instructional support carries a lot of information and it challenges exploration. Furthermore it uses a few short sentences to guide students directly towards their learning goals. In practice, this method can help teachers formulate learning goals for their students, in business simulation games, that are most relevant for the course.
17 | P a g e
REFERENCES
Atkinson, R. K., Derry, S. J., Renkl, A., & Wortham, D. (2000). Learning from examples:
Instructional principles from the worked examples research. Review of educational
research, 70(2), 181-214.
de Jong, T. (2006). Scaffolds for computer simulation based scientific discovery learning. In J. Elen & D. Clark (Eds.), Handling complexity in learning environments: research and theory (pp. 107-128). London: Elsevier Science Publishers.
Edtechreview, What is game based learning: http://edtechreview.in/dictionary/298-what-is-game-based-learning, retrieved October 2014
Garris, R., Ahlers, R., & Driskell, J. E. (2002). Games, motivation, and learning: a research and practice model. Simulation & Gaming, 33, 441–467.
Gee, J. P. (2003). What video games have to teach us about learning and literacy. New York: Pal grave/ St. Martin’s.
Leemkuil, H. H. (2006). Is it all in the game?: Learner support in an educational knowledge management simulation game. Enschede, University of Twente.
Leemkuil, H., & de Jong, T. (2011). Instructional support in games. In S. Tobias & D. Fletcher
(Eds.), Computer games and instruction. Charlotte, NC: Information Age Publishers
Malone, T. (1981). Toward a theory of intrinsically motivating instruction. Cognitive Science, 4, 333–369.
Prensky, M. (2001). Digital game-based learning. New York: McGraw-Hill.
Slavin, R. (2003). Educational psychology: Theory and practice. Boston: Pearson Education.
Spires, H. A., Rowe, J. P., Mott, B. W., & Lester, J. C. (2011). Problem solving and game-based
learning: Effects of middle grade students' hypothesis testing strategies on learning
18 | P a g e
Stewart, J., et al. (2013) The Potential of Digital Games for Empowerment and Social Inclusion of Groups at Risk of Social and Economic Exclusion: Evidence and Opportunity for
Police, Institute for Prospective and Technological Studies, Joint Research Centre. Trybus, J., New Media Institute,
http://www.newmedia.org/game-based-learning--what-it-is-why-it- works-and-where-its-going.html, retrieved October 2014.
Vogel, J. J., Vogel, D. S., Cannon-Bowers, J., Bowers, C. A., Muse, K., & Wright, M. (2006).
Computer gaming and interactive simulations for learning: a meta-analysis. Journal of Educational Computing Research, 34, 229–243.
Walther, L.R.F.Z.J (2013) Debriefing Topics and Their Effect on Learning with Computer Games. Enschede, University of Twente
Wouters, P., & Van Oostendorp, H. (2013). A meta-analytic review of the role of instructional
19 | P a g e
APPENDIX 1: PRE-TEST QUESTIONNAIRE
Participant Nr: Age: Sex: M / F
With these questions we want to estimate your experience with computer games.
1. How much experience do you have with computer games in general?
⃝ (Almost) None ⃝ Some
⃝ (Very) Much
2. Please estimate how many hours did you spend playing computer games in the last week?
⃝ 0 ⃝ 1-3 ⃝ 4-6 ⃝ 7-9
⃝ 10 or more
3. How much experience do you have with playing digital strategy games in general?
⃝ (Almost) None ⃝ Some
⃝ (Very) Much
4. How much experience do you have with playing business-simulation games?
⃝ (Almost) None ⃝ Some
⃝ (Very) Much
5. Please estimate how many hours experience you have with playing Lemonade Tycoon ( version 1 or 2 or “Sim Lemonade Millionaire”).
⃝ 0 ⃝ 1-3 ⃝ 4-6 ⃝ 7-9
20 | P a g e
APPENDIX 2: HYPOTHESES
Minimizing waiting time positively influences customer satisfaction
Optimizing ordering lemon, sugar, ice and cups positively influences net profit
Increased popularity of your stand positively influences total revenues
Minimizing the need for marketing campaigns positively influences net profit
21 | P a g e
APPENDIX 3: POST-TEST QUESTIONNAIRE
1. Name three reasons for customers to be unsatisfied:1:
2:
3:
2. What is meant with ‘lost sales’?
3. Except the supplies for making lemonade, name three possible expenses for running the business:
1:
2:
3:
4. Explain why the umbrella upgrade influences customer satisfaction:
5. Name three ways to lower waiting time: 1:
2:
22 | P a g e
6. Describe for each of the stock products the optimal way to place an order, before you have purchased any upgrades:
Lemon:
Sugar:
Ice:
Cup:
7. Name three ways to increase the popularity of your stand: 1:
2:
3:
8. Describe three situations when you would or when you wouldn’t run a marketing campaign:
1:
2:
3:
9. Describe three factors influencing your decision making process for pricing the products: 1:
2:
23 | P a g e
APPENDIX 4: ANSWERS TO POST-TEST QUESTIONNAIRE
Only one answer per category allowed, more answer within the same category will not count for points.
1. Name three reasons for customers to be unsatisfied:
Category 1: Product
Category 2: Price
Category 3: Waiting time
Total: 3 points
2. What is meant with ‘lost sales’?
Lost sales are those selling opportunities that you have lost because an item was out of stock or any other reason that caused you to lose the opportunity to sell
Total 1 point
3. Except the supplies for making lemonade, name three possible expenses for running the business:
Category 1: Marketing
Category 2: Permits
Category 3: Staff
Total: three points
4. Explain why the umbrella upgrade influences customer satisfaction:
It keeps the customers dry on the rainy days and cool on the hot days, it influences customer satisfaction because of the service provided
Total 1 point
5. Name three ways to lower waiting time:
Category 1: Upgrade related to waiting time
Category 2: Staff training
Category 3: Expansion
24 | P a g e
6. Describe for each of the stock products the optimal way to place an order, before you have purchased any upgrades:
Lemon: Recipe and weather based
Sugar: Recipe and weather based
Ice: Weather based
Cup: Popularity and weather based Total 3 points
For this question quarter of a point is given for each descriptive answer and an additional half a point for elaboration. As an example: A lot of lemons (0.25), because they are the most important (0.5). Mentioning that for bulk purchase, of the products, a discount is received was rewarded with a bonus point, but not exceeding the maximum of three points.
7. Name three ways to increase the popularity of your stand:
Category 1: Marketing
Category 2: Related upgrade
Category 3: Good product
Category 4: Low price
Total 3 points
8. Describe three situations when you would or when you wouldn’t run a marketing campaign:
Category 1: Related to growth
Category 2: Related to popularity
Category 3: Related to weather
Category 4: Related to revenues
Total 3 points
9. Describe three factors influencing your decision making process for pricing the products:
Category 1: Weather
Category 2: Costs
25 | P a g e Category 4: Popularity
Category 5: Location
Category 6: Customer Feedback
Category 7: Level of the stand
Category 8: Waiting time
Total 3 points
For this question half a point is given for each correct answer, and an additional half a point for
either direction or eleboration. As an example for direction: When it is raining (0.5 point) I
lower the price (0.5 point). An example for eleboration: The erea I’m in (0.5 point) to keep the