Inventory management with orders
without usage
ASML
University of Twente
Final report
H.E. van der Horst
March 6, 2015
without usage
Executed commissioned by: ASML
Date: March 6, 2015 Version: Final Concept
By
H.E. van der Horst
Supervision University of Twente
Department Industrial Engineering and Business Information Systems Dr. M.C. van der Heijden
Dr. A. Al Hanbali
Supervision ASML
Department Customer Logistics – Inventory Control Dr. K. Oner
Ir. R. van Sommeren
Faculty & Educational program
Faculty of Behavioural, Management and Social Sciences Master: Industrial Engineering and Management
V
OCABULARY
Abbreviation Description
ATTS Average time to shortage; Measurement to divide the stock, when there is not enough stock for the outstanding orders
CL Customer Logistics; Planners and forecasters are employers in this department. Inventory Control is a sub-department
Critical parts Parts of which there are too little on stock to fulfil the demand within lead time from the supplier
Continental parts
availability These customers have a CSD contract and are delivered from the hub warehouse in their continent; This is out-of-scope in this research, because the current inventory management optimization does not take this into account.
CS Customer Service; Engineers are employers in this department. Local Logistics Centre is a sub-department
CSD Customer Satisfaction Degree; Percentage of demand which you can pick immediately from the region of the customer or at global level (is included in some contracts)
Demand All parts ordered; Include usage, scrapped parts and returned parts, like serviceable, repack and requalification
DOA Death on Arrival; Parts, which the engineer wanted to use, but got a failure before they arrived at the customer
DTWP Down Time Waiting for Parts; Percentage of time a machine is down and the customer has to wait for a part for this machine
Global parts
availability These customers have a CSD contract and are delivered from the central warehouse Init order The order to fill the safety stocks, when the safety stocks have been changed Inventory Control Sub-department of Customer Logistics; The objective is to control the inventory
level and ordering activities, to improve the forecast of inventory and to check the quality of ordering and forecasting
KPI Key Performance Indicator
Local logistics centre Sub-department of Customer Logistics; Located at the Local Warehouse Local parts availability These customers have a DTWP contract and are delivered from the local
warehouses
Multi-echelon model Model to optimize the amount of stock in the local warehouses and central warehouse
MyQ Portal, where the local logistics centre and the operational planning department create there purchase orders; Coupled to SAP
Plant Simulation Tool for discrete-event simulation, which can model processes and measure their performance
Replenishment Cycle
Time RCT; Lead time of orders, which is the time between placing the order at the local warehouse to the central warehouse and the arrival of the order at the local warehouse
Repack Parts which are returned and unpacked, but which are not tried in the machine. They have to be repacked at the local warehouse
Replenishment order The order driven by the SAP-system; This order is requested when the inventory level is lower than the safety stock
Requalification Parts, which are returned and tried in the machine, but became not the solution. In this case the old part is set back in the machine and the part to requalify has to be checked if it is still working properly. The parts, which have to be
ROP Reorder Point
Rush order The order, driven by a manual order of parts
Sales Order The order, what is on beforehand sold to the customer
SAP ERP-system of ASML
Scrap Parts, which are returned and to inexpensive that it is more cost-effective to scrap these parts and order new parts
Serviceable Parts, which are returned and not even unpacked, but only taken to the customer
SKU Stock Keeping Unit, which has at ASML a personal SKU-code
SLA Service Logistic Agreements; Maintenance contracts with customers of the machines ASML delivers with targets DTWP and CSD
M
ANAGEMENT SUMMARY
Currently ASML determines the safety stock levels by having the usage as main input in the model, Spartan, to determine the safety stock levels. However at ASML the orders of parts are not all used parts, but returned: ??% of the orders from the local warehouse to the customer are not used and will be returned. Next to that, ??% of the emergency transportation costs are due to orders without usage. Also the replenishment cycle time is higher for orders without usage.
Thereby the problem in this research is: “ASML is facing higher emergency transportation costs, longer replenishment cycle time and higher risk of not satisfying the customer contracts due to not incorporating orders without usage in the inventory level determination.”. Hereby the core question becomes:
“How should ASML respond to orders without usage into the inventory level calculations? What would be the impact of this incorporation in terms of:
- Emergency transportation costs; - Inventory holding costs;
- Replenishment cycle time;
- Risk of not satisfying the customer contracts?”
In this research first the current process and forecast is explained. A new part only will be send to the local warehouse of a customer, when a part is needed and not on stock, or when the inventory level is lower than the safety stock, which is a result of a usage of a part. The inventory level only changes when a part is used and not when a part is sent to the customer. This is the policy at ASML. Then the part is allocated. When returning a part, it can be used (??%), serviceable (??%), requalified (??%), repacked (??%) and other returns (??%). The other returns are out-of-scope in this research. This means that ??% of the orders from the local warehouse to the customer is not taken into account in the forecast, because they are not used. This has the consequence of lower safety stocks than needed, which result in higher emergency transportation costs.
The forecast at ASML is determined by the exponential smoothing of usage. In the optimization the local safety stock levels are determined by Spartan, whereby the down time waiting for parts is the constraint and the holding and emergency transportation costs are minimized. The forecast of the central demand is the usage during lead time. In the optimization of the central inventory the reorder points are set by minimizing the holding costs with the constraint of the customer satisfaction degree. The limitation in this research is that the current inventory model and current measurement of the usage may not be changed. Only a change in the input of the inventory model may be the result of this research. The optimizations of the central and local inventory systems are not coupled, whereby a higher inventory value for the local inventory system does not result in a lower inventory value for the central inventory system to keep the same targets.
The impact of not including the orders without usage is measured. The impact of orders without usage on the emergency transportation costs is €?? million in 2013, which is ??% of the total cost. The impact on the replenishment cycle time is that the cycle time for a SKU with a high number of orders without usage is higher than a SKU with a low number of orders without usage.
Silver. They present four forecast methods. Method 2 of Kelle and Silver is found to be the most appropriate method, because of his high robustness and low number of calculations in the method. Next to that, the method performs almost as good as the best method. The forecast of method 2 decreases the demand (usage and returns) with the parts which return during lead time.
Method 2 of Kelle and Silver has the drawback that negative demand may arise for SKUs having many subsequent periods with zero demand, which have a high number of requalification orders returning in the coming period. Also this method has still extra calculations than the current forecast. Thereby a new method is developed. This method is simpler than method 2 of Kelle and Silver and the forecast is the demand (usage and returns) minus the average number of orders returned.
These methods are applied to the inventory optimization methods of ASML and the most appropriate method is chosen. The best method is chosen based on the smallest difference in outcome of the simulation of the reality at ASML and the optimization per method. In the simulation of the local inventory the developed method has the closest results to the optimization of the local inventory.
Implementing the developed method results in the annual savings of €?? million worldwide, which includes the annual holding and emergency transportation costs. Next to that, implementing the developed method results in the reduction in out-of-stocks of ?? parts annually, which is 33% of the planned out-of-stocks. The costs of these out-of-stocks are not taken into account in the annual savings and thereby there can be more costs reduction. The method needs an investment in inventory value of €?? million. The risk and annual costs of the extra inventory value is taken into account in the annual savings.
In reality the current method results in an underperformance in DTWP, RCT and CSD, because not all demand is taken into account. The DTWP and CSD are in reality 1% lower than in the current method (with not taking the returns into account). There is no significant difference in the RCT.
A qualitative result of adding the returns to the forecast, is a better planning, which results in more satisfied suppliers and a better reaction of the suppliers on the demand of ASML. A better reaction on the demand, results in less critical parts. Next to that, the emergency transportations will be reduced, which results in more efficiency and a better consolidation of orders.
The recommendations, based on this research, are as follows:
- Include the return flow in the optimization of the local safety stock levels and the central ROP by
determining the forecast with developed method.
- In the next years ASML will implement a new multi-echelon inventory model, whereby the
optimizations of the central and local inventory costs are combined. The advice is to implement this multi-echelon inventory model including the developed method. The current prototype is not yet fully developed, whereby the results are not yet comparable to the current situation. The recommendation is to calculate the methods with the correct CSDs, when the software is available and check if the expectation is correct.
Further research is required for the following topics:
- A reverse logistics multi-echelon multi-item inventory model, whereby the multi-echelon model is
combined with the full return flow.
- The reduction of orders without usage, to reduce to core problem of having orders without
P
REFACE
After a fantastic time in Enschede and at the University of Twente, I hereby present my master thesis. This thesis is the last delivery of the master program Industrial Engineering and Management with the specialization Production & Logistics Management. The research for this thesis was executed at ASML in Veldhoven.
First of all I want to thank all people with whom I worked together, lived together, had nice evenings and nights and who motivates me in my whole student life. I really liked my time with my study colleagues, my roommates of the Borstelweg and Bentinckstraat, at Rowing Club Euros, at Study association Stress, with my sorority Nefertiti, in my Student Union board and with my company PIP Advice.
With a lot of energy I worked on this research. It was fun to learn how to implement a theoretical model in a real, dynamic environment. Besides that it was a good learning experience making all stakeholders of this research clear what the goal was, methods were and results were.
I would like to thank my supervisors within ASML, K. Oner and R. van Sommeren, for their insights in the problem and methods at ASML. I appreciated the time they spent in my research and their trust in me to give me the full freedom and responsibility in my research. I also would like to thank my colleagues for their critical input and their help for gathering information and getting contacts within the company. Next to that, I also would like to thank my first supervisor of the University of Twente, M.C. van der Heijden, for his contribution, critical reviews and enthusiasm for this research. Also thanks to my second supervisor, A. Al Hanbali, for his support and also critical review. It is really motivating when both supervisors really read your thesis report and give clear feedback.
I would like to thank all readers for their time to review my thesis report: Sophie, Jelco, Elieke, Tabea, Tim and Irene. Next to that, I would like to thank my boyfriend Jelco for his positive support during my study and master thesis. At last I would like to thank my parents, Gerard and Carla, for their support during my entire study.
T
ABLE OF
C
ONTENTS
Vocabulary ... iii
Management summary ... v
Preface ... vii
1. Assignment description ... 2
1.1. Company description ASML ... 2
1.2. Motivation of the research ... 2
1.3. Objective & research questions ... 4
1.4. Scope ... 7
1.5. Planning ... 8
2. Current way of working ... 10
2.1. Ordering process at the local warehouse... 10
2.2. Process of returning parts ... 13
2.3. Current forecast method ... 16
2.4. Current determination of reorder points at the local warehouse ... 18
2.5. Current determination of ROPs at the central warehouse ... 19
2.6. Conclusion ... 20
3. Current performance on orders without usage ... 22
3.1. The segments with high number of orders without usage ... 22
3.2. Impact of orders without usage... 25
3.3. Returning time of orders without usage ... 26
3.4. Conclusion ... 28
4. Literature review forecast method ... 30
4.1. Forecast methods from literature... 30
4.2. Criteria forecast method ... 31
4.3. Choice of method ... 31
4.4. Conclusion ... 35
5. Applied method ... 37
5.1. Applied forecast method to ASML ... 37
5.2. Disadvantages of method 2... 39
5.3. Conclusion ... 40
6. Impact methods ... 42
6.1. Test methods on correctness ... 42
6.3. Impact on DTWP ... 48
6.4. Impact on CSD ... 48
6.5. Impact on replenishment cycle time in central warehouse... 49
6.6. Other effects of developed method... 49
6.7. Conclusion ... 50
7. Implementation Plan ... 52
7.1. Implementation plan of developed method ... 52
7.2. Drawbacks & risks of implementation plan ... 55
7.3. Conclusion ... 56
8. Conclusions & Discussion ... 58
8.1. Conclusion ... 58
8.2. Recommendations ... 59
8.3. Discussion... 59
8.4. Further research... 60
References ... 62
Appendix ... 64
Appendix A: Forecasting... 64
Appendix B: Confidential: Reference of confidential names of regions ... 68
Appendix C: Inventory models ... 69
Appendix D: Confidential: Figures in chapters 1, 2 and 3 ... 71
Appendix E: Simulation model in Plant Simulation ... 72
L
IST OF
T
ABLES
Table 1.1: Planning of master thesis. ... 8
Table 2.1: Overview of differences in order and transportation types. ... 13
Table 2.2: Return of parts. ... 14
Table 2.3: Reasons for ordering without usage from interviews. ... 15
Table 3.1: Replenishment cycle time per usage and percentage orders without usage per SKU. ... 26
Table 4.1: Notation in method 2 of Kelle and Silver and their descriptions. ... 32
Table 4.2: Input parameters in example of method 2 of Kelle and Silver. ... 34
Table 5.1: Example of the negative values of Method 2 of Kelle and Silver. ... 39
Table 6.1: Source of data in results. ... 42
Table 6.2: Results in costs of simulation model of region 2 per method. ... 44
Table 6.3: Optimization of Region 2. ... 45
Table 6.4: Optimization of Region 2 in Chapter 6. ... 45
Table 6.5: Results in costs of simulation model of region 2 per method. ... 46
Table 6.6: Optimization and evaluation, normalized with holding costs of developed method. ... 47
Table 6.7: Difference in DTWP per region. ... 48
Table 7.1: Tasks, actors and costs of informing decision makers. ... 52
Table 7.2: Tasks, actors and costs of pilot of method in one region. ... 53
Table 7.3: Tasks, actors and costs of implement method for all regions. ... 54
Table 7.4: Tasks, actors and costs of measuring process. ... 54
Table 7.5: Tasks, actors and costs of evaluation implementation and method. ... 55
L
IST OF
F
IGURES
Figure 1.1: Twinscan NXE - one of ASML's machines for producing chips (ASML, 2013). ... 2
Figure 1.2: Current Service Process. ... 3
Figure 1.3: Replenishment cycle time per percentage used. ... 4
Figure 1.4: Problem cluster of the unavailable parts at the local warehouse. ... 5
Figure 2.1: Process of replenishment order. ... 11
Figure 2.2: Process of rush order. ... 12
Figure 2.3: Process of return order... 14
Figure 2.4: Monthly forecasting of failure rates. ... 16
Figure 3.1: A select number of SKUs causes most shipments without usage to the local warehouse ... 23
Figure 3.2: A select number of SKUs causes most orders without usage at the customer. ... 23
Figure 3.3: Number of parts returned per month. ... 23
Figure 3.4: Orders without usage per machine type. ... 24
Figure 3.5: Transportation type per usage bucket. ... 24
Figure 3.6: Emergency transportation costs per usage and (no) ROP/SSL ... 25
Figure 3.7: Emergency transportation costs per usage and machine down... 26
Figure 3.8: Parts to repack are repacked, scrapped or replenished. Data from 2013; ... 27
Figure 3.9: Parts to requalify are requalified, scrapped or replenished. ... 27
Figure 5.1: Applied inventory model of the reverse logistics at ASML. ... 37
Figure 6.1: Inventory model in simulation. ... 43
Figure 6.2: Optimization of local inventory for each test. ... 44
Figure 6.3: Reality of using the SSLs of the current method and the real demand. ... 46
Figure 6.4: Optimization of central inventory for each test. ... 47
Figure 6.5: Reality of using the ROPs of the current method and the real demand. ... 48
Figure 7.1: Implementation of developed method at ASML. ... 52
Figure A.0.1: Greedy method of SPARTAN following A.A. Kranenburg (2006). ... 65
Figure A.0.2: Approximate evaluation method ... 66
Figure A.0.3: Review of Spartan output ... 67
Figure C.0.4: Different inventory figures of the recovery process ... 70
Figure E.0.12: Four processes in simulation. ... 72
1.
A
SSIGNMENT DESCRIPTION
1.1.
Company description ASML
ASML is founded in the Netherlands in 1984 and is located nowadays on more than seventy locations in sixteen countries. This 30-year old company is a world leader in the production of lithography systems for the semiconductor industry. ASML designs, develops, integrates, markets and services complex machines for the production of integrated circuits or chips. These chips are used in electronic, communication and information technology products, which everyone uses in daily life. The headquarter of ASML is in Veldhoven, where
also the main part of the research and development activities takes place. ASML is traded on Euronext Amsterdam and NASDAQ (ASML, 2013). The strategy of ASML is: “Technology leadership combined with customer and supplier intimacy, highly efficient processes and entrepreneurial people” (ASML, 2014). ASML is divided in three business units: Business Segments, Business Operations and Business Support. Within the business unit Business Operations, the inventory control of service parts and improvement of service logistics take place in the department Customer Logistics. The sub-department for these activities is Inventory Control. In the Inventory Control department the objective is to control the inventory level and ordering activities, to improve the forecasting of the central inventory and to check the quality of ordering and forecasting. This project falls within the Inventory Control department.
1.2.
Motivation of the research
ASML has service logistic agreements (SLAs) with customers buying ASML machines. Based on these SLAs ASML has to obtain service targets with the following performance indicators:
- DTWP: Down Time Waiting for Parts: Percentage of time a machine is down and the customer
has to wait for a part.
- CSD: Customer satisfaction degree: Percentage of demand which you can pick immediately from
the hub warehouse in the region of the customer or which you can pick globally. In literature called fill rate.
Because of these SLAs, inventory is needed in the local warehouses, hubs and central warehouse to obtain these service targets.
Three different service logistic agreements are possible for customers:
1. Local parts availability: These customers have a DTWP contract and are delivered from the local warehouses.
2. Continental parts availability: These customers have a CSD contract for the region of that customer and are delivered from the hub warehouse in their continent.
3. Global parts availability: These customers have a CSD contract for the global inventory and are delivered from the central warehouse.
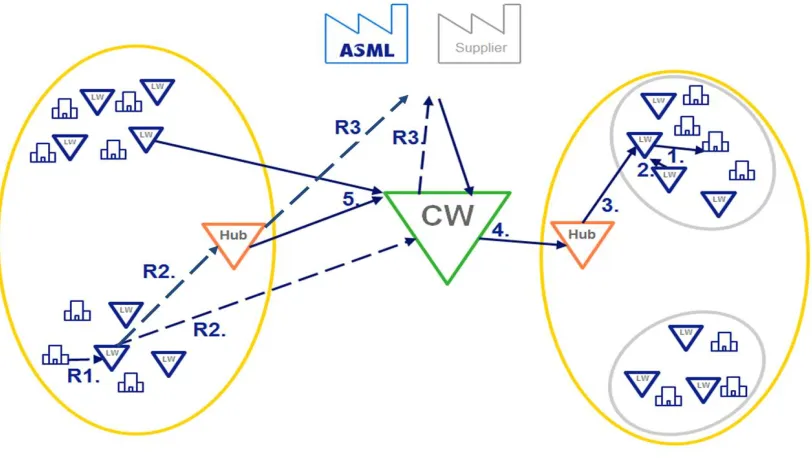
For all customers the engineer will decide which parts to order when he receives a failure notification. The engineers at customers with a DTWP contract contact the logistic employees at the nearest local warehouse, who will order a part from their local warehouse ((1) in Figure 1.2). When the part is not available in the local warehouse, they order the part from the local warehouses in the neighbourhood (2)
[image:16.612.395.587.94.210.2]or from the hub in the neighbourhood (3). When there is no part available at these warehouses they will ask the central warehouse to look for that part globally: so at the central warehouse (4) or at hubs or local warehouses (5) globally (in other regions). When the parts are located, these will be sent to the engineer (1-5).
The engineer will repair the machine with the parts and all parts which are not used will be sent back to the local warehouse (R1). Parts to repack are parts which are unpacked, but which are not tried in the machine. Parts which have to be repacked and not used are repacked at the local warehouse. Parts to requalify are parts which are tried in the machine, but became not the solution. In this case the old part is set back in the machine and the part to requalify has to be checked if it is still working properly. The parts, which have to be requalified, are sent via the hub or central warehouse (R2) to the supplier (R3). Serviceable parts are parts which are not even unpacked, but only taken to the customer.
Engineers for the continental customers contact the logistic employees at the nearest hub warehouse, who will order a part from their hub warehouse. When the part is not available the part is asked at the central warehouse. They will return their parts to the hub warehouse.
[image:17.612.80.486.352.581.2]The same for global customers, then the engineer contacts the logistic employees at the central warehouse, who will order a part from their central warehouse. They will return their parts to the central warehouse.
Figure 1.2: Current Service Process.
Figure based on a presentation of TacticalPlanning1 (TacticalPlanning1, 2014). The figure is changed to the situation, which is described above.
The start of this research is due to a signal from the engineers, who reported that the lead time of orders, which came from other local, central or hub warehouses, was high and that they have to wait long for spare parts. (InventoryControl3, 2014)
warehouse was lower than the targeted 86%. To figure out the gap between the actual RCT and the planned RCT the department Customer Logistics wrote down twenty-three possible causes (InventoryControl3, 2014). One of these possible causes, namely orders without usage are not taken into account in planning, is the start of this research. In the remainder of this section, further information about this research is given. In the next section the problem statement is given.
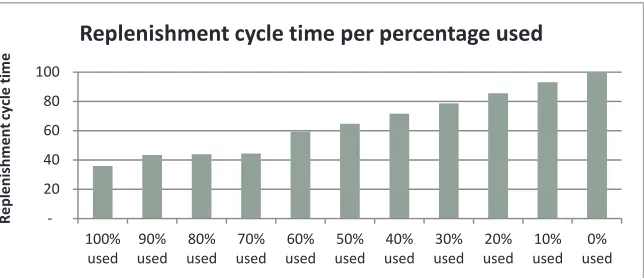
In Figure 1.3 the horizontal axis is scaled by the percentage of parts used per order. 0% used means that all parts in that order are not used, but returned. The vertical axis is the average replenishment cycle time, as mentioned above. As you can see in Figure 1.3, the average cycle time is doubled between full usage and no usage. There could be multiple reasons for the higher RCT for parts with low usage:
- Parts, which are ordered but less/not used, have a low safety stock, because there is not the
expectation that these parts will be ordered. This could result in a higher lead time (as result of fewer parts in the field).
-
Next to that, parts, which are ordered without usage, but need to be requalified, have to be sent to the supplier and are an amount of time not available as inventory. There is no planning on this demand and thereby this could result in higher cycle times.1.3.
Objective & research questions
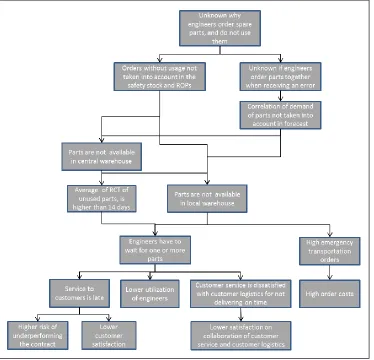
Based on interviews with the head Inventory Control, four employees of Inventory Control, the manager Customer Logistics and an employee of Customer Logistics, a problem cluster is set up as in Figure 1.4. The upper part of the problem cluster (Figure 1.4) contains the root problems. The results of these root problems are in the lower part of the figure.
The root problem is that it is unknown why engineers order parts, which won‟t be used. This results in the following:
- First, it is unknown if engineers always order the same parts, when receiving the same errors.
Not having this knowledge leads to not taking the correlation of parts into account in the forecast of the failure rates and thereby the determination of the safety stocks.
- Second, it results in not using the information of orders in the determination of the base stock
levels. This means that the determination of the base stock levels is only based on used orders and not on orders without usage.
The lack in taking into account the correlation and orders without usage results in having stock out of parts in the central warehouse, when it was expected that they were on stock. This has the effect that also in local warehouses there could be out-of-stocks.
[image:18.612.243.565.148.287.2]Another result of not taking into account the orders is the longer lead time of replenishments of orders without usage or with less usage. This is explained in Figure 1.3 in section 1.2.
Figure 1.3: Replenishment cycle time per percentage used. Based on data of 2013. Normalized to 0% used is RCT of 100.
20 40 60 80 100 100% used 90% used 80% used 70% used 60% used 50% used 40% used 30% used 20% used 10% used 0% used R e pl e ni shm e nt cy cl e t im e
Finally this results in:
- Higher personnel, transportation and order costs; - Higher replenishment cycle time;
- Higher risk of not satisfying the DTWP and CSD in the contract; and
- Lower satisfaction on the collaboration of Customer Service and Customer Logistics.
The engineers are employees of the Customer Service (CS) department. The planners and forecasters are employees of the Customer Logistics (CL) department.
Because it costs too much time to take both the correlation of parts and the determination of safety stocks into account, the research is limited to the determination of safety stocks based on orders without usage.
Hereby the problem can be defined as follows:
[image:19.612.76.450.194.554.2]“ASML is facing higher emergency transportation costs, longer replenishment cycle time and higher risk of not satisfying the customer contracts due to not incorporating orders without usage in the inventory level determination.”
The purpose of the research is to give advice to ASML about determining the base stock level based on the orders and the return flow, by:
- Analysing the process of ordering and returning;
- Analysing the current forecasting method and current method of determination of the safety
stocks and reorder points;
- Analysing the impact of orders without usage; - Reviewing literature to find forecast methods;
- Developing the forecast which incorporates the order and return flow of orders without usage; - Comparing the results of the current method and the new method;
- Giving an implementation plan of the new method.
Hereby the core question becomes:
“How should ASML respond to orders without usage into the inventory level calculations? What would be the impact of this incorporation in terms of:
- Emergency transportation costs; - Inventory holding costs;
- Replenishment cycle time;
- Risk of not satisfying the customer contracts?”
The current model for determining the safety stocks and reorder points is the basis in this research. The new forecast will be the input in this model.
This core question can be divided in different research questions; the so called knowledge questions (Heerkens, 2005). These questions can be answered by reviewing the related literature, interviews at ASML and data from ASML. The research questions are as follows.
1. What is the current way of working in the order and return process and how does ASML forecast and determine the base stock levels?
a. How does the ordering process perform at the local warehouse? b. How does the process of returning parts perform?
c. How does the current forecast method of the used parts perform?
d. How does the current determination of reorder points perform at the local warehouse? e. How does the current determination of reorder points perform at the central warehouse? 2. What is the impact of not including orders without usage in the determination of base stock
levels?
a. In which segments of ASML is the number of orders without usage the highest?
b. What is the impact of orders without usage on the emergency transportation costs and replenishment cycle time?
c. How long is the return lead time of orders without usage?
3. Following the literature, what forecast method can be used to determine the demand and return flow?
a. Which methods are possible to forecast the demand and return orders? b. What are the criteria to select the forecast method?
4. How can the chosen method be added to the current determination of the base stock level? a. How can the method be applied to ASML to forecast the order and return flow?
b. What are the disadvantages of the method and how can these disadvantages be covered?
5. What is the impact of the new methods compared to the current method?
a. Which forecast of the methods is the most correct in the optimization compared to the reality?
b. What is the cost impact by adding the forecast of the new method to the current inventory model?
c. What is the impact on DTWP by adding the forecast of the new method to the current inventory model?
d. What is the impact on CSD by adding the forecast of the new method to the current inventory model?
e. What is the impact on replenishment cycle time by adding the forecast of the new method to the current inventory model?
f. What are other effects at ASML by adding the forecast of the new method to the current inventory model?
6. How can the new forecast method be implemented at ASML? a. What is the plan to implement the forecast method?
b. What are the risks and drawbacks of the implementation and how can ASML handle these?
1.4.
Scope
The scope in this research is the following:
- The description of the process in this research starts when the error in the machine has occurred. - The description of the process in this research ends when the parts are used or returned to the
local or central warehouse and added to the inventory level.
- The current forecast method and translation to the safety stock model will not be changed,
because this is not reasonable to obtain in six months. The forecast will be added to this model.
- The customers with continental parts availability are not taken into account in this research,
because they are currently also not taken into account in the inventory management optimization.
- The research is done for service parts.
o The tools are out of scope.
1.5.
Planning
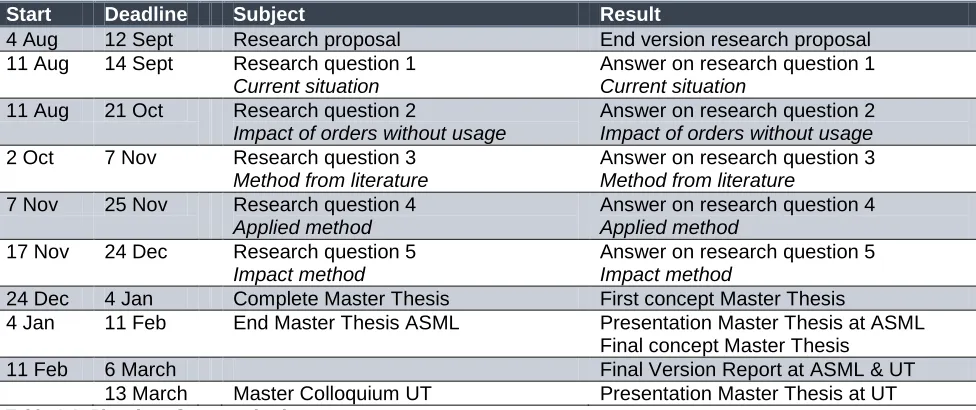
The planning in this research is as in Table 1.1.
Start Deadline Subject Result
4 Aug 12 Sept Research proposal End version research proposal 11 Aug 14 Sept Research question 1
Current situation
Answer on research question 1 Current situation
11 Aug 21 Oct Research question 2
Impact of orders without usage
Answer on research question 2 Impact of orders without usage 2 Oct 7 Nov Research question 3
Method from literature
Answer on research question 3 Method from literature
7 Nov 25 Nov Research question 4 Applied method
Answer on research question 4 Applied method
17 Nov 24 Dec Research question 5 Impact method
Answer on research question 5 Impact method
24 Dec 4 Jan Complete Master Thesis First concept Master Thesis
4 Jan 11 Feb End Master Thesis ASML Presentation Master Thesis at ASML Final concept Master Thesis
[image:22.612.69.557.115.320.2]11 Feb 6 March Final Version Report at ASML & UT 13 March Master Colloquium UT Presentation Master Thesis at UT
2.
C
URRENT WAY OF WORKING
This chapter answers the research question that is formulated in section 1.3: “What is the current way of working in the order and return process and how does ASML forecast and determine the base stock levels?”. First the changes in inventory level are described. Then the current forecast methods and inventory models for determining safety stocks and ROPs are declared.
2.1.
Ordering process at the local warehouse
This section answers the sub-question: “How does the ordering process perform at the local warehouse?”. This section is divided in order types and transportation types.
2.1.1.
Order types
The orders can be divided in different types: Init, sales, replenishment and rush (HeadInterfaceTeam1, 2014).
The init orders are the orders to fill the safety stocks, when the safety stocks have been changed. This order type is out of scope, because it is not possible to forecast these orders. These orders are one-time changes. Next to that, the delivery lead time of init orders is the length of the lead time of delivering new parts from the supplier to the central warehouse.
The sales orders are orders which are sold to the customer beforehand, when the customer maintains the machine by himself. The sales orders are out of scope of this research, because these orders also cannot be forecasted and have also the lead time of the supplier (HeadInterfaceTeam1, 2014).
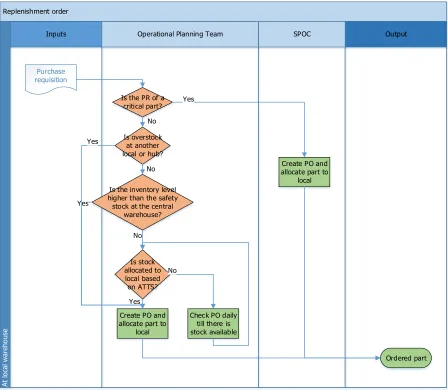
Replenishment orders, as typology at ASML, are orders driven by the SAP-system. These orders are requested when the inventory level is lower than the safety stock. The parts of the replenishment orders can be shipped from another local warehouse, when there is overstock at that local warehouse. When there is no overstock at the local warehouse the parts will be shipped from the central warehouse. The process is visualised in Figure 2.1 (HeadInterfaceTeam1, 2014).
Replenishment order
Inputs Operational Planning Team SPOC Output
At loca l w ar eh ou se Ordered part Purchase requisition
Is the PR of a critical part?
No
Is overstock at another local or hub?
Is the inventory level higher than the safety stock at the central
warehouse? No Is stock allocated to local based on ATTS? No No
Create PO and allocate part to
local Yes Yes
Yes
Create PO and allocate part to
local Yes
[image:25.612.75.523.72.462.2]Check PO daily till there is stock available
Figure 2.1: Process of replenishment order.
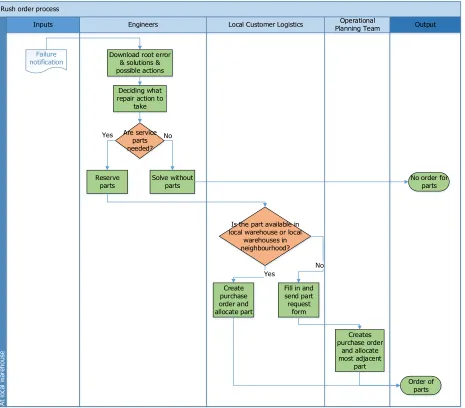
The rush order process is as follows (in Figure 2.2) (HeadInterfaceTeam1, 2014):
1. The engineers receive a failure notification from the system or by phone from the customer. They download the root error, root causes, solutions and possible parts to order in different systems. 2. The engineers decide if and what to order and make a reservation in MyQ. MyQ is the portal to
reserve the parts, which is connected to SAP.
3. The Local Customer Logistics department checks if the part is available in their local warehouse or in the local warehouses in the neighbourhood and creates a purchase order in MyQ when the part is available.
When the part isn‟t available in their local warehouse or in the local warehouses in the neighbourhood, the local customer logistics department fills in and sends a Part Request Form to the Operational Planning Team.
Rush order process
Inputs Engineers Local Customer Logistics Planning TeamOperational Output
At lo ca l w ar eh ou se Failure notification Are service parts needed? Solve without parts No Reserve parts Yes
No order for parts
Is the part available in local warehouse or local
warehouses in neighbourhood? Create purchase order and allocate part
Fill in and send part request form Yes No Creates purchase order and allocate most adjacent part Order of parts Download root error
& solutions & possible actions
Deciding what repair action to
[image:26.612.77.542.72.480.2]take
Figure 2.2: Process of rush order.
Concluding, a new part only will be ordered when a part is needed and not on stock or when the inventory level is lower than the safety stock, which is a result of a usage of a part. When a part is picked and sent to a customer, the part is allocated. This means that the inventory level only changes when a part is used and not when a part is sent to the customer.
2.1.2.
Transportation types
The replenishment and rush orders can be transported in three types: emergency, priority and routine. Emergency deliveries will be delivered as fast as possible. This results in a delivery time of a few hours within a country and a few days between countries (TransportController1, 2014).
Routine deliveries will be picked on the next day and will be transported when possible. This results in a delivery time of one day within a country and six to nine days between countries (TransportController1, 2014).
Per order type and per transportation type an overview of the differences is given in Table 2.1. The choice of priority and emergency of a replenishment order is how fast a planner wants to have the critical part on stock (TransportController1, 2014).
Order type Replenishment Rush
Transportation type Routine Priority Emergency Routine Priority Emergency
Is the order manual made in
SAP? Yes Yes Yes
Is the order requested automatically by SAP?
Yes Yes Yes
Is the machine down? Yes
Are the parts needed for a
planned action within 14 days? Yes
Is the part a critical part? Yes Yes
Table 2.1: Overview of differences in order and transportation types.
2.2.
Process of returning parts
This section answers the sub-question: “How does the process of returning parts perform?”.
When a part is used, the inventory level decreases. When a part is not used and is returned, the local customer logistics department fills in the material notification and adds the reason of returning in the material notification. In table 2.2 the different reasons of returning parts are given following the material notification.
The data of the return flow are gathered in two phases: the used parts and the returned parts. The data of the used parts are gathered at August 15, 2014 and contains all order lines of goods received between January 1, 2013 and December 31, 2013. The data are gathered by Analyst3, responsible for forecasting, in SAP. The data of the returned parts are gathered at August 20, 2014 and contains all order lines of goods receipt between January 1, 2013 and December 31, 2013. The data are gathered by TacticalPlanning2, responsible to determine safety stocks, in SAP. All incomplete order lines are out of scope, because incomplete order lines cannot be analysed. For verification the data of returned parts are gathered at August 27, 2014 by CriticalParts1, member of the critical parts team. The data for verification of used parts are gathered by OperationalPlanner2, member of the critical parts team, at August 21, 2014.
Reasons for sending back Percentage of total ordered parts
Percentage of returning parts
Death on arrival 2% 5%
Repacked 3% 10%
Requalified 7% 21%
Serviceable 21% 64%
Used 67% -
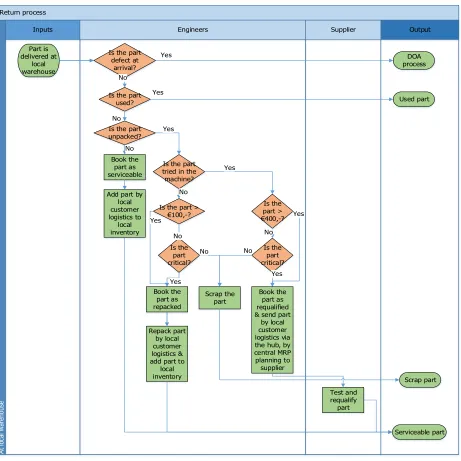
The process of returning the parts is given in Figure 2.3. The parts labelled as “DOA” are out of scope of this project. The reason for this is that when these parts would not have a failure when they arrived or when they were installed, they would be used.
Return process
Inputs Engineers Supplier Output
At lo ca l w ar eh ou se
Is the part defect at
arrival?
Book the part as serviceable Is the part unpacked? Yes Part is delivered at local warehouse No Is the part
used? Yes No Used part Serviceable part No DOA process
Add part by local customer logistics to
local inventory
Is the part tried in the machine? Yes No Repack part by local customer logistics & add part to
local inventory Test and requalify part Is the part > €400,-? Is the part >
€100,-? Is the part critical? Is the part critical? No Scrap the part Yes Yes No No Yes Scrap part Book the part as requalified & send part
by local customer logistics via the hub, by central MRP planning to supplier No Book the part as repacked Yes Yes
[image:28.612.78.539.237.698.2]The parts, which returned with the label “Requalification”, were sent back by the local logistics centre to the hub. The hub sent them back to the supplier, who tested the parts and sent them back to the hub. In the hub the parts are added to the stock of the hub. When the part to be requalified has a price lower than €400,- and is not a critical part, the part is scrapped before going to the supplier. Critical parts are parts, of which there are too little on stock to fulfil the demand within lead time from the supplier. If a part to be requalified cannot be repaired, the part is scrapped. In total 15% of the parts to requalify is scrapped. The lead times are given in section 3.3 (Criticalparts1, 2014).
The parts to be repacked are sent to the local warehouse, then repacked and added to the stock at the local warehouse. When the parts to be repacked have a price lower than €100,- and they are not critical parts, then the part is scrapped, before repacking. In total 16% of the parts to repack is scrapped. The lead times are given in section 3.3 (Criticalparts1, 2014).
The serviceable are added to the stock in the local warehouse immediately. The lead times are given in section 3.3 (Criticalparts1, 2014).
2.2.1.
Reasons of returned parts from interview
To answer the question why parts are ordered without usage, interviews were hold with stakeholders of the returning process. The results can be found in Table 2.3.
Category Reason for ordering parts without usage No. of
references System Different possible root causes for the failure mentioned in the system 5
System New machine, which means less knowledge about the possible failures 3
System Unknown failure mode 1
Customer High pressure of customer to solve as soon as possible 3
Customer Customer demand for an extra part 1
Customer Customer situation: Previous maintenance cost a lot of time or signing a
new contract with the customer 1
Customer Political situation: Management promised specific parts on stock 1 Contract Limited time to diagnose, because of DTWP 3 Contract Preparation for worst case scenario: certainty of repair at once 2 Engineer Low expertise of engineer: Less knowledge about errors and less knowledge
about diagnoses tools 2
Engineer Gut feeling of engineer that extra parts are needed 1 Other Often a DOA on that part: So more of the same SKUs ordered 1 Other Part was not delivered on time and the engineers forgot to cancel the part
when repair the failure 1
References:
- Analyst of the process (Analyst1, 2014);
- One employee of the operational planning team (HeadInterfaceTeam1, 2014); - Two service engineers, responsible of repair the ASML machines (Engineer2, 2014),
(Engineer1, 2014);
- One employee from the global support centre (ServiceLogistics1, 2014);
- One single point of contact to the local warehouse (OperationalPlanner1, 2014).
Table 2.3: Reasons for ordering without usage from interviews.
- System: When an engineer looks in the system for the problem, he finds a possible problem.
Subsequently, this possible problem is the input for getting the solution out of another system. The output of that system is a list of ten different solutions, which were mentioned by an engineer at least once. Based on that information the decision of what part to order is made (CompetencyEngineer1, 2014).
- Customer: The machines of ASML are the bottleneck machines in the production process at the
customer, because these are the most expensive machines and thereby the bottlenecks (ToolPlanning1, 2014). So when a machine is down, the whole flow is down. This results in high costs, which could lead to more than $500.000,- per hour for the newest machine of ASML (InventoryControl1, 2014). This situation at the customer results in high pressure of the customer and high dependency on each other.
- Contract: In the contract with the customer the down time has to be limited. Thereby there is
limited time to diagnose and the repair has to be all at once to avoid losing time.
- Engineer: Because of the difficulties in the system, the engineer has to make decisions based on
his experience and knowledge. Thereby it depends on the engineer, how much parts he will order.
The next sections present: Current forecast method, current determination of safety stocks at the local warehouse and current determination of reorder points at the central warehouse.
2.3.
Current forecast method
This section answers the sub-question: “How does the current forecast method of the used parts perform?”. This question is used to understand the current forecast method, which can be used later in determining the new forecast method. First the forecast method of the failure rates at local warehouses is described. Then the translation of this forecast is made to the central forecast.
2.3.1.
Local forecast method
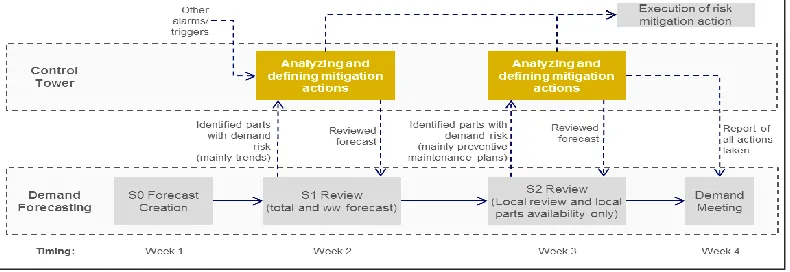
The current forecast of the failure rates is determined monthly. In the local warehouse all SKUs are stocked according safety stock levels, with as input the expected failure rates.
[image:30.612.74.469.550.686.2]In Figure 2.4 the process of forecasting and reviewing of the failure rates is given. The process is divided in the demand forecasting and the control tower. In the demand forecasting the forecast is executed and reviewed. In the control tower the changes in the forecast, discussed in the demand forecasting, are decided. Per stage the process is explained in the next paragraphs.
Figure 2.4: Monthly forecasting of failure rates.
In S0 the forecast is created. The input is as follows: 1. Usage per SKU per machine per quarter; 2. The number of SKUs per machine;
3. The number of machines per local warehouse.
The failure rate per quarter t is calculated by formula (2.1), as specified by ASML. is the install
base life. This is the number of installed machines times the number of parts of that SKU in that machine in quarter t. is the average usage per day of SKU i in quarter t. The usage contains the
preventive and corrective replacement of parts (Analyst3, 2014).
The forecast is determined at ASML by formula (2.2). Hereby is the weight percentage. The weight percentage is measured by formula (2.3).The forecast is the average usage per day of SKU i during the last three years.
∑
∑
is the decrease of exponentially weight and is 1.4 at ASML. is determined by checking different weights and thereby 1.4 became a good mix of stiffness and flexibility (Analyst3, 2014). From my own calculations there is no difference in forecast with different weights. Changing this is out of scope of this research.
The time taken in the creation of the expected failure rate is three years and every time step is one quarter of a year. Thereby there are twelve periods. ASML choose for twelve periods because in the simulation study this amount of time resulted in the best performance of the forecast in terms of forecast errors (Analyst3, 2014). A t of 12 is the most recent period of the data sample.
The forecasts are reviewed on central and local level for specific SKUs. The criteria are stated in Appendix A.1. The results of S0 are the forecast of the failure rates per SKU and a list of SKUs to be discussed. The selected SKUs are discussed in S1 and S2.
In S1 the worldwide forecast of failure rates of the selected SKUs is discussed by the Inventory Control team and tactical planners per SKU. In this meeting the adjustments can be made per SKU per machine. In S2 the regional review will take place with the SPOCs: contact persons to the local warehouse. Here the focus is on regional trends. Adjustments are made per local warehouse.
In the demand meeting (week 4 in Figure 2.4) the decision is made what changes are necessary to make. The forecast is the input for the determination of the reorder points as explained in section 2.4.
(2.1)
(2.2)
2.3.2.
Central forecast method
In the central warehouse, SKUs are forecasted if they have a usage of more than six parts in half a year. A usage less than six parts in six months results in having a reorder point. The reason for this is that the forecast is reviewed monthly and thereby it is more cost efficient to only forecast SKUs which are used at least once per month.
The central planners check every month the forecast and they order per month the forecasted amount. There is no safety stock level or reorder point for the forecasted parts. The forecast is monthly reviewed. In calculating the ROP the forecast, which is based on the formula (2.4), is needed (InventoryControl2, 2014). Hereby is the forecast worldwide per day for SKU i. is the forecast per day of local
warehouse j for SKU i. J is the number of local warehouses. ∑
2.4.
Current determination of reorder points at the local warehouse
This section answers the sub-question: “How does the current determination of reorder points perform at the local warehouse?”. In the half-yearly forecast of the local reorder points Spartan is used to determine the reorder points with a greedy algorithm (Kranenburg, 2006). A greedy algorithm is an algorithm that goes through all stages in a problem solving heuristic, whereby at each stage the local optimum is chosen. It is possible to find the global optimum, but the result could also be a local optimum (Hazewinkel, 2011).
The inputs for Spartan are as follows (TacticalPlanning2, 2014) (Kranenburg, 2006):
Failure rates occurring following a Poisson process with constant rate ; whereby is the SKU
and is a machine. These failures are determined following section 2.3.1;
Number of machines of type per customer linked to local warehouse j;
Average time for an emergency transportation from the central warehouse to the local warehouse per SKU ;
Average cost for an emergency transportation from the central warehouse to the local warehouse
;
Average time for a lateral shipment from another local warehouse to the local warehouse per SKU ;
Average cost for a lateral shipment from another local warehouse to the local warehouse per SKU
;
Holding costs per time unit per SKU .
The objective in Spartan is to minimize the total costs by determining the base stock level of SKU i at local warehouse j .
The constraints are defined as follows (Kranenburg, 2006):
Maximum average waiting time per local warehouse ̂ : DTWP as specified in section 1.2;
Lead time to deliver the parts with a routine transportation to the local warehouse (from the central warehouse) is fixed on 14 days.
In this method inventory pooling is applicable, which implies using the same inventory at one local warehouse of a SKU for several machines. Next to that, pooling is applicable to the lateral transhipment between local warehouses. In this case when a part is needed, the part also can be ordered from another local warehouse (and central warehouse). In this case all local warehouses can have lateral transhipments and thereby this method is full pooling. The greedy method contains three steps (Kranenburg, 2006).
Step 1: In step one the parameters are initiated, which includes setting zero stock levels: .
Step 2: In step two the base stock levels increase as long as the costs do not increase. Thereby
, the cost difference of SKU i at local warehouse j, is measured to determine if the cost difference is equal or positive.
Step 3: In step three the stock level increases of the SKU that provides the largest decrease in
waiting time ( ) per unit costs increase , as long as the current solution is not feasible. The current solution is feasible when the constraints as set above are achieved.
The written out formulas and procedure in detail can be found in Appendix A.2. Some SKUs need an extra review following the list in Appendix A.3. The review of the output of Spartan is also described in Appendix A.3.
When the failure rates are changed a lot in a month, the reorder points are changed based on the approach in section 2.3.1. The safety stock is one month of usage on top of the forecast. For SKUs with a high fluctuation, this amount can be higher. This amount is based on gut feeling (InventoryControl1, 2014).
2.5.
Current determination of ROPs at the central warehouse
This section answers the sub-question: “How does the current determination of reorder points perform at the central warehouse?” When the usage is less than six in the last six months, the SKU has a reorder point and is ordered based on the reorder point. The reorder points are monthly reviewed and are reviewed when an SKU is ordered at the supplier (InventoryControl2, 2014).
The expected usage during lead time (DDLT) is calculated by including the expected demand (as in formula (2.4)) during lead time, including the scrapped parts of the returns in the demand and including the parts to repair (of the failed parts) of the returns. Please notice that the returns in formula (2.5) are the result of the usage. So because of a usage the failed parts in the machine are sent back. This is another flow than the orders without usage. The demand during lead time for SKU i is as follows formula (2.5) (InventoryControl2, 2014).
( )
The ROP is calculated to fulfil the CSD, Customer Satisfaction Degree. The assumption is made that the demand during lead time is Poisson distributed. This is measured in August by checking the data with the distributions (InventoryControl1, 2014). In a Macro in Excel the calculation is made that the ROP will increase as long as the service level is not yet fulfilled, as in the cumulative function in formula (2.6) (InventoryControl2, 2014). In formula (2.6) the ROP has to be high enough to fulfil the change of not going out-of-stock ( ), which has to be higher than the CSD.
When the demand is zero during lead time or when the demand is one in the last two months, the reorder point is two.
These SKUs have a safety stock. The safety stock is the difference between the ROP and the demand during lead time. So when the ROP is 3 and the demand during lead time is 0.71, then the SSL is 2 (3-0.71 rounded). For SKUs with a high fluctuation, this amount can be higher. This amount is based on gut feeling (InventoryControl1, 2014).
2.6.
Conclusion
This chapter answers the question “What is the current way of working in the order and return process and how does ASML forecast and determine the base stock levels?”. The conclusions are as follows:
A new part only will be ordered when a part is needed and not on stock or when the inventory level is lower than the safety stock, which is a result of a usage of a part. The inventory level only changes when a part is used and not when a part is sent to the customer. Then the part is allocated.
When returning a part, it can be used (67%), serviceable (21%) or labelled as requalified (7%) and repacked (3%). This means 33% of the orders from the local warehouse to the customer is not taken into account in the forecast. The orders without usage are handled different per order type. The serviceable parts and parts to repack are added to the inventory of the local warehouse. The parts to requalify are sent to the supplier and added to the inventory of the hub warehouse.
The forecasted failure rate per local warehouse depends on the usage of a SKU per quarter, the installed base of machines for that SKU per quarter and the weight factor. The forecast of the usage per month for the central warehouse is dependent on the usage, the amount to repair and the lead times from the supplier. Thereby, in the local and central warehouse forecast the orders without usage are not taken into account.
The reorder points at the local warehouse are constrained by the replenishment lead time and the constraints in the contract with the customer: the down time waiting for parts and the fill rate of a SKU. The reorder point at the central warehouse is impacted by the lead time of receiving new parts and repair parts from the supplier.
3.
C
URRENT PERFORMANCE ON ORDERS WITHOUT USAGE
This chapter answers the research question that is formulated in section 1.3: “What is the impact of not including orders without usage in the determination of base stock levels?” First the segments, with a high number of orders without usage, are determined. Then the effect of the orders without usage on the emergency transportation costs and replenishment cycle time is made clear. At the end it is made clear what the demand impact is on the availability in the supply chain.
3.1.
The segments with high number of orders without usage
This section answers the sub-question: “In which segments of ASML is the number of orders without usage the highest?”. Per segment the analysis on orders without usage is executed and the causes for the outcomes are made clear. The characterization of the orders without usage can be found in the conclusion of this chapter.
The data used for the orders at the customer are the data as mentioned in section 2.2. The data of the shipments are gathered at January 23, 2014 and contains all order lines of goods received between January 23, 2013 and January 22, 2014. The data are gathered by InventoryControl3 in SAP. For verification the data of the emergency and priority orders and returns of January 1, 2013 to December 31, 2013 are gathered at October 8, 2014 by Researcher1 in SAP.
3.1.1.
Overall results
As given in section 2.2 orders without usage as percentage of all orders at the customer to the local warehouse is 33%. Orders without usage shipped as percentage of all parts shipped from other local warehouses and central warehouse to the local warehouses is 44%. A reason for a higher percentage when shipped, is that ASML does not plan on orders without usage and thereby the availability of orders without usage could be lower at a local warehouse. The total parts shipped include replenishment and rush orders. This means that also the replenishment of the stocks at the local warehouse is included. The parts in the orders based on safety stock are a result of usage, whereby the manual ordered parts still have to be used. Thereby the percentage of 44% is only an indication of orders without usage shipped. The price per SKU does not differ between the mean of used orders and orders without usage. This is applicable for orders to the customer and shipments to the local warehouse.
3.1.2.
A select number of SKUs causes most orders without usage
The Pareto principle states that a high number of events are caused by a small number of causes. The Pareto rule is known as the 80-20 rule, which means for the case of orders without usage, that 80% of the orders without usage is resulted by 20% of the SKUs (Chen, Chong, & Tong, 1991). As you can see in Figures 3.1 and 3.2 this is the case for ASML. In Figure 3.1 you can see that 17% of all SKUs ordered by the customer at the local warehouse results in 80% of orders without usage. In Figure 3.2 you can see that 28% of all SKUs shipped to a local warehouse results in 80% of orders without usage shipments. These shipments could come from the central warehouse, but also from other local warehouses or hub warehouses. Further in the research the method could be scoped by using only these high-impact SKUs.
3.1.3.
Increase of orders without usage
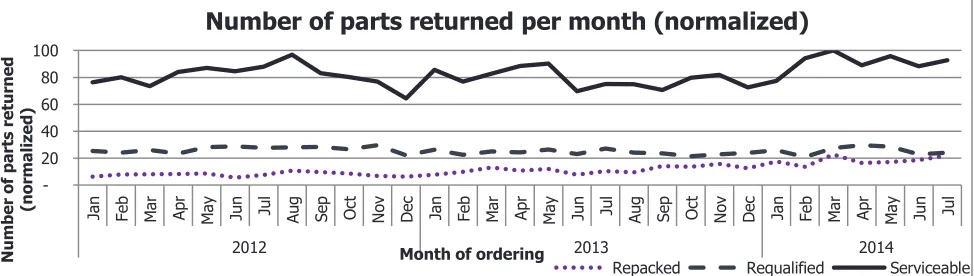
[image:37.612.72.464.216.398.2]In Figure 3.3 the number of parts returned per month can be found. This is the only data set in this chapter which is gathered for two-and-a-half years. As you can see the number of parts to requalify is equal over time. The number of serviceable returned parts is also increased in the last five months. The number of parts to be repacked is increased in the last year. An explanation for this is that the number of the machines is increasing. The overall demand is increasing and thereby the number of orders without usage is increasing. Consequently, planning on the orders without usage will have even bigger impact in the future.
Figure 3.3: Number of parts returned per month. 20 40 60 80 100
Jan Feb Mar Apr May Jun Ju
l
Au
g
Sep Oct Nov Dec Jan Feb Mar Apr May Jun Ju
l
Au
g
Sep Oct Nov Dec Jan Feb Mar Apr May Jun Ju
l
2012 2013 2014
N um b er o f pa rts ret urne d (no rmal iz ed)
Month of ordering
Number of parts returned per month (normalized)
Repacked Requalified Serviceable 17%
80%
28%
80%
SKUs shipped to local
All SKUs % of orders without usage shipped All SKUs % of orders without usage
SKUs ordered at customer
Figure 3.1: A select number of SKUs causes most shipments without usage to the local warehouse
[image:37.612.75.562.555.693.2]3.1.4.
Newest machines have the highest number of orders without usage
[image:38.612.77.543.223.333.2]In Figure 3.4 the percentage orders without usage per machine type can be found. As you can see in Figure 3.4, Machine 1, Machine 3 and Machine 8 has the highest percentage of orders without usage. Machine 1, Machine 3 and Machine 8 are the newest machines of ASML. The reason for the high percentage of orders without usage for new machines could be the missing experience and knowledge of the engineers with the machines. Also the increase of complexity of machines could be a reason for having a higher percentage orders without usage for the newest machines. The outlier in this figure is Machine 4. This machine is the oldest machine of ASML and thereby has the lowest percentage of orders without usage. There is no correlation between the newest machines and the continents or countries with a high percentage of orders without usage.
Figure 3.4: Orders without usage per machine type.
3.1.5.
Higher percentage emergency transportations for orders without usage
In Figure 3.5 the transportation type per usage bucket can be found. The SKUs in full usage are the SKUs with no orders without usage. The SKUs in the bucket partly used have some orders which are used and some orders which are not used. The bucket no usage contains SKUs with all orders not used. As you can see an SKU with no usage has more emergency transportations than a SKU with full usage. When you go in detail with this the data, the percentage of emergency transportations for SKUs with no usage is higher for shipments between continents than within continents. This can be explained by the fact that most parts that were ordered were ordered in Continent1 and Continent3 and that the central warehouse is stated in Continent2, which delivers most parts. This information is useful for the explanation of the emergency transportation costs in section 3.2.1.
Figure 3.5: Transportation type per usage bucket.
0% 10% 20% 30% 40% 50%
Machine 1 Machine 2 Machine 3 Machine 4 Machine 5 Machine 6 Machine 7 Machine 8
% o f t ot al o rde re d Machine types
Orders without usage per machine type
%serviceable % requalified %repack
91% 87% 83%
5% 5%
6%
4% 8% 11%
0% 10% 20% 30% 40% 50% 60% 70% 80% 90% 100%
Full usage Partly used No usage
P e rce nt age of t ransp ortat ion ty pe
Transportation type per usage
3.2.
Impact of orders without usage
This section answers the sub-question: “What is the impact of orders without usage on the emergency transportation costs and replenishment cycle time?”. The impact of orders without usage on the holding costs is not possible to measure before calculating the safety stocks with the new forecast method. The DTWP is not directly possible to link to usage, because ASML does not measure the down time linked to the exact orders.
3.2.1.
Emergency transportation costs
As explained in section 2.4 the holding and transportation costs of SKUs are minimized in the determination of the safety stocks. The transportation costs in the determination of the safety stocks are the emergency and lateral transportation costs. In this section these costs are combined to emergency transportation costs.
As was already shown in Figure 3.5 in section 3.1.5 the number of emergency transportations is higher for partly used and not used SKUs. The transportation costs are calculated by measuring the number of emergency orders from a supplying local warehouse to a receiving local warehouse. Per transportation between a supplying and receiving local warehouse, transportation costs are looked up in the input parameters of Spartan and checked with the Infrastructure & Transportation department of ASML (Analyst2, 2014) (TransportController1, 2014). The costs per transportation and the number of transportations per supplying and receiving warehouse are multiplied and all costs are summed.
Based on the data of 2013, the emergency transportation costs of the shipments without usage are in total €?? million. This is 55% of all emergency transportation costs. €?? million is related to lateral shipments.
Emergency transportation costs per type of planning In Figure 3.6 the emergency transportation costs are explained per type of planning: “Having reorder point/safety stock level, but no stock available” and “Having no reorder point/safety stock level”.
[image:39.612.343.583.429.638.2]As you can see in Figure 3.6, 44% of the emergency transportation costs are made when a SKU has a reorder point or safety stock at a local warehouse, but when there is no stock. Two reasons are possible to clarify this: supply chain issues and orders without usage. Supply chain issues could be made quantified by measuring the number of critical parts. In the buckets of “ROP/SS, but no stock” is the improvement expected, because here the unused parts have effect on the planned safety stock level (HeadLogistics1, 2014). Used Unused N o R OP /SS R OP /SS , but no sto ck 30% 25% 26% 19%