The Bologna Process and its influence on the participation in the
Erasmus program
Bachelor Thesis by Lena Jörgens
European Public Administration
Faculty of Behavioral, Management and Social Sciences
Abstract
List of Abbreviations:
EHEA: European Higher Education Area
ERASMUS: European Region Action Scheme for the Mobility of University Students BFUG: Bologna Follow-up group
Table of contents
Chapter 1: Introduction ... 1
1.1Harmonizing European Higher Education systems ... 1
1.2 The Bologna Process ... 2
1.3 Bologna and student mobility ... 5
1.4The research problem ... 5
1.5 Research question ... 6
1.5 Societal and scientific relevance ... 7
1.6 Outline of the thesis ... 7
Chapter 2: Theoretical framework ... 8
2.1 Introduction ... 8
2.2 Implementation theory ... 8
2.3 The Bologna Process from the view of the implementation theory ... 10
2.4 Push and pull factors ... 11
2.4 Theoretical model ... 13
Chapter 3: Methodology ... 15
3.1 Introduction ... 15
3.2 Research design ... 15
3.3 Case selection ... 15
3.3 Data collection ... 17
3.4 Operationalization ... 17
3.4 Data analysis ... 19
3.5 Strengths and weaknesses of research design ... 20
Chapter 4: Data Analysis ... 21
4.1 Introduction ... 21
4.3 Mobility rates ... 21
4.4 The Tools ... 24
Chapter 5: Conclusion and Discussion ... 28
5.1 Conclusion ... 28
5.2 Discussion ... 30
5.3 Recommendation for future research ... 31
References: ... 32
1
Chapter 1: Introduction
This chapter describes how higher education in Europe has changed in the past years and how the focus has been laid on internationalization. In particular, the chapter will describe what the Bologna process as one of the main reforms in higher education is, how it is related to student mobility and what the European Region Action Scheme for the Mobility of University Students (ERASMUS program) is. Thereafter the research problem and research question will be presented, followed by scientific and societal relevance of the study and its outline.
1.1
Harmonizing European Higher Education systems
In the past years, higher education in Europe has changed remarkably. Even though higher education is not a competence of the European Union but a competence of the countries, the European Union has involved itself enormously through the Commission by participating in the Bologna Process. The Bologna Process was initiated by the higher education ministers of 29 European countries through signing the Bologna Declaration in 1999. As of the moment of July 2017, 48 countries are participating in the Bologna Process. With the Bologna Declaration, a huge process of reform implementation throughout Europe started. Some of the most important objectives were establishing the three-cycle-system of Bachelor, Master and Doctorate, introducing a system of easily readable and comparable degrees and introducing tools of quality assurance.1 By adjusting the content and the length of higher education studies, European students were to be enabled and motivated to spend some time of their studies in a different European country. Likewise, tools for quality assurance were initiated to make European Higher Education more compatible and more attractive for foreign students. The idea was to create one European Higher Education Area (EHEA), to enhance European cooperation and exchange and provide students and staff with intercultural experience, language skills and personal growth which would also increase their employability (Bologna Declaration, 1999). Especially increasing the mobility was an important goal of the Bologna process. While this study only focuses on student mobility, also staff mobility was to be increased. The goal to increase the student mobility rates, meaning the number of students that study in a different country other than their home country, was aimed at broadening the student’s horizons and to prepare them for an international labor market.2 Furthermore, the study abroad would allow the students to learn from one another, to give them new opportunities and promote innovation.3 Through the cooperation between the participating countries also a broader focus on internationalization was to be laid. Not only was the cooperation and communication
1 See http://ec.europa.eu/education/policy/higher-education/bologna-process_de (accessed on August 1, 2017) 2 See http://europa.eu/rapid/press-release_IP-17-82_en.htm (accessed on August, 2, 2017)
2 between European countries to be enhanced, also European higher education was to be made more attractive for students outside of the European Union.
Even though universities have attracted foreign students and scholars, since the founding of the first universities, the international dimension has increasingly gained importance in the past 25 years, with more mobile students and more international mobile scholars (De Wit, et al., 2015). Since internationalization is closely linked to cultural and economic development of countries, internationalization also gained importance in the field policy implementation (Altbach, 1998). In the present days, internationalization in higher education, especially the mobility of students, has become increasingly important. For higher education institutions, the number of mobile students and the level of internationalization even has become an indication of prestige (Kolster, 2014). In recent years, countries and universities continuously attempted to attract more international students. The emergence of internationalization of higher education – and the attention given to this objective in the Bologna process – can be linked to the overall importance given to education in modern societies. In fact, the higher education ministers of the participating countries acknowledged the importance of higher education for “development and strengthening of stable, peaceful and democratic societies” (Bologna Declaration 1999, p.1).
Having outlined the importance of internationalization of higher education for the further economic and cultural development of Europe, it can be argued that mobility rates of countries could serve as an indication of progress. Looking at the Erasmus rates in all participating countries it can be seen that there is a continuous growth in the student mobility rates in all of the participating countries. Nevertheless, it can also be seen that the growth in the participating countries is not consistent and that there is a great gap between the country with the highest and the country with the lowest student mobility rates. Moreover, a substantial gap between the numbers of incoming and outgoing students in some countries can be observed. This study was motivated by a statistic of the Dutch Institution for Internationalisation in higher education showing the most active participants in the Erasmus program in terms of incoming and outgoing student mobility in 2013 to 2014.4 In the following the Bologna process and its linkage to mobility and the Erasmus program will be explained. Afterwards the research problem and question will be elaborated, its scientific relevance and the approach of answering the question.
1.2 The Bologna Process
The Bologna Process was started with the Bologna Declaration as an intergovernmental commitment between the higher education ministers of 29 participating countries. These countries were Austria,
3 Belgium, Bulgaria, the Czech Republic, Estonia, Denmark, France, Finland, Germany, Hungary, Greece, Ireland, Iceland, Latvia, Italy, Luxembourg, Lithuania, the Netherlands, Malta, Poland, Norway, Romania, Portugal, Slovenia, the Slovak Republic, Sweden, Spain, the United Kingdom and the Swiss Confederation. Even though the countries had forbidden the European commission in the past to challenge the variety of higher education systems in Europe, the ministers jointly promoted the process (Teichler 2011, p.8). In the year before the Bologna Declaration the ministers of France, Germany, Italy and the United Kingdom had already formulated the goal of the harmonization of a European higher education system. In the Sorbonne Declaration 1998 the ministers acknowledged the importance of a “Europe of knowledge” and the government’s role in “strengthening the building upon the intellectual, cultural, social and technical dimensions of our continent” (Sorbonne Declaration 1998, p.1). Given the path to a period of change in education and working conditions the authors saw the necessity of life-long learning and stated that they owe students and the society at large “a higher education system in which they are given the best opportunities to seek and find their own area of excellence” (Sorbonne Declaration 1998, p.1). The ministers formulated the wealth of positive perspectives that an open higher education area would carry. In the Declaration, they already mentioned some of the most important aspects of a common higher education area, such as a system of two main cycles for comparison and equivalence, the use of semesters and credits such as ECTS, the recognition of degrees and a common frame of reference. The especially stressed the importance of external and internal readability of their systems for international recognition and attractive potential. Furthermore, they also expressed the requirement of “continuous efforts to remove barriers and develop a framework of teaching a learning, which would enhance mobility and even closer cooperation” and call on the member states to join their objectives. (Sorbonne declaration 1998, p.1)
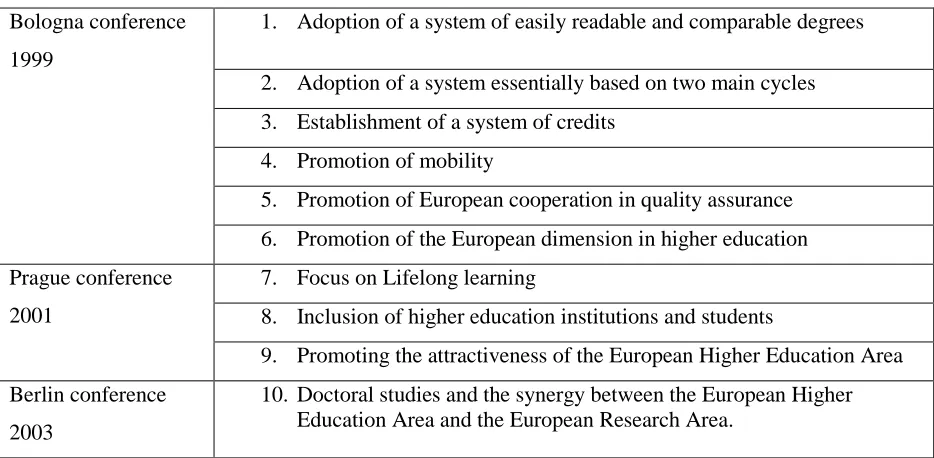
One year later, 23 other European countries joined their path with the Bologna Declaration. In the Bologna Declaration, the aspects of the Sorbonne Declaration were adopted and the aspect of European cooperation in quality assurance was added. In the years after, the ministers met every two years to discuss the progress, new aspects, and the applications for new membership to the EHEA. The figure below shows the ministerial Bologna meetings that took place from 1999 to 2015 in chronological order.
Figure 1. Ministerial meetings 1998-2015 Boloogna
Declaration 1999
Prague 2001
Berlin 2003
Bergen 2005
London 2007
Leuven 2009
Budapest 2010
Bucharest 2012
4 At each meeting a communiqué was adopted that outlines the decisions taken by the member states.5 The goals of the Bologna Process were to be reached through a decentralized implementation of the defined tools and agreements. While the member states are responsible for the implementation, the implementation process is closely supervised on European level. Consequently, the process is an ongoing arrangement of ministerial meetings and supervision (Keeling, 2006). In every meeting, new goals and objectives as well as achievements were discussed. The first declaration consisted of six main action lines. Throughout the years more action lines were added. The action lines are listed below.
Table 1: Action lines (Westerheijden, et al., 2008) Bologna conference
1999
1. Adoption of a system of easily readable and comparable degrees 2. Adoption of a system essentially based on two main cycles 3. Establishment of a system of credits
4. Promotion of mobility
5. Promotion of European cooperation in quality assurance 6. Promotion of the European dimension in higher education Prague conference
2001
7. Focus on Lifelong learning
8. Inclusion of higher education institutions and students
9. Promoting the attractiveness of the European Higher Education Area Berlin conference
2003
10. Doctoral studies and the synergy between the European Higher Education Area and the European Research Area.
Throughout the process, different types of supervision were used. On the one side, there are the biennial ministerial meetings, conferences, communiqués, policy declarations and reports. One the other side, much effort has been put in monitoring the progress of the reform implementation. To monitor the implementation of each of the decisions made in the ministerial meetings, the Bologna follow-up group (BFUG) was introduced following the Berlin meeting in 2003. It is an executive support structure consisting of a BFUG Board and Secretariat and working groups and seminars to oversee the Bologna Process, to prepare the Ministerial conferences and policy forums, and to take forward matters that do not need to be decided by the Ministers or that have been delegated by the Ministers.6 For each Bologna Follow-up Group and Board
5 meeting, which usually takes place at least every six months, minutes or outcomes of proceedings are available.7 The BFUG also sets up working groups and seminars to deal with specific topics.8
In this study, the stocktaking reports published by the BFUG will be used to evaluate the progress in six specific countries which will be explained later.
1.3 Bologna and student mobility
The importance of student mobility to the integration of Europe was recognized even before the start of the Bologna process. The importance was already underlined with the introduction of the European Region Action Scheme for the Mobility of University Students, short ERASMUS, in 1987. The idea of the program was to support students financially to enable them to study in a foreign European country. The study abroad was to broaden young people’s horizons and provide students with valuable experiences.9 The Erasmus program started with eleven participating countries and developed throughout the years to the largest student mobility program hitherto and one of the most successful programs of the European Union. (Bracht, et al., 2006). The Bologna Process did not play an unimportant role in this success. With the degree structures converging in Europe through the Bologna Process, student mobility facilitated through the Erasmus program was made even easier. Also, the number of participating countries grew. Currently, thirty-three countries participate, including all European countries, Turkey, Macedonia, Norway, Iceland and Liechtenstein. Moreover, the European Credit Transfer system (ECTS) was introduced in all participating countries, which was already established with the Erasmus program to simplify the conversion of grades. In addition to the easier recognition of courses also the quality of courses was to be assimilated through the instruction of quality assurance tools. But the Erasmus program changed over time. It is now part of Erasmus+ and not only facilitates studies at foreign universities, but also internships abroad. Currently the Erasmus program supports almost 300,000 higher education students every year.10
1.4
The research problem
The problem that occurred in the past years, is that the mobility rates were not growing equally in the participating countries. The mobility rates significantly differ across the countries. Also, the balance of incoming and outgoing students varies significantly across the countries. As already mentioned, the study by the Dutch organization for internationalization in higher education of 2013-2014 showed that there is a big imbalance in some countries between their percentage of incoming compared with their percentage of
7 See https://www.ehea.info/pid35089/bfug-and-board-meetings.html (Accessed on July 9, 2017) 8 See https://www.ehea.info/cid101754/bfug.html (Accessed on July 9, 2017)
6 outgoing students of all students in one country. The statistic showed that the most participating country in 2013-204 was Ireland with total of 4,81% mobile students of all students in the country. At the same time, the country is also the most imbalanced country looking at the numbers of incoming outgoing students. While 3,32% of all students were incoming Erasmus students, only 1,49% of the Irish students left the country to study elsewhere. One other highly participating country is Latvia (on rank 8) which has as total of 3,61% mobile students, but only 1,30% of incoming students compared to 2,31% outgoing students which makes it the second most imbalanced country which a reciprocity of 1.01. The only quite balanced countries shown in the statistic are the Netherlands with a reciprocity of 0.01%, followed by Austria with -0.09%.
For higher education systems, this imbalance is not sustainable in the long run. Especially for countries with more incoming than outgoing students there is a considerable financial disadvantage. It implies that such a country is paying the education for students that are coming in to the country for only a limited amount of time (3 to 12 months) without getting real profits (as the students will leave again). In other words, you invest in persons from which you will not benefit (as a country). As this study will further lay out, there are certain “push” and “pull” factors that motivate students to go abroad and to choose a specific country. With the Bologna Process, tools were implemented to enhance these push and pull factors. If some of the push and pull factors are not promoted equally in some countries the result could be imbalanced mobility rates. This study assumes that the reason for the imbalance lays in the implementation of the mobility promoting tools of the Bologna Process. The difficulty with the Bologna Process is that there is not a real legal framework. The participation in the Bologna Process is voluntarily and the countries can decide to a large extent for themselves on how to implement the reform. There is not a uniform implementation plan imposed on all countries. In this study we are interested to see if this variation in implementation has consequences for the (imbalance of) student mobility. Another important factor is the time frame as in the Bologna Declaration only a general goal of a European Higher Education Area till 2010 has been set, the countries implemented aspects such as the two-cycle system in different years throughout the implementation process from 1999 to 2010. This study is to see whether the time frame and the intensity of implementation can explain differences in the student mobility rates.
1.5 Research question
To study this problem, the following research question will be used:
7 To answer this question, countries participating in the Erasmus program and the Bologna process will be compared in terms of their mobility rates, specifically their ratio between incoming and outgoing students, and regarding the speed and intensity of the reform implementation. In particular, six countries will be compared, two with balanced mobility rates, two with more incoming than outgoing students and two with more outgoing than incoming students. The study will only use the participation rates in the Erasmus program and not the whole mobility rates in the countries as there is not sufficient data available. Since the Erasmus program is one of the most successful programs of the European Union and one of the main instruments to enhance mobility, with sufficient data available on the mobility rates, this study will measure mobility only by the means of Erasmus statistics. The implementation of the tools introduced with the Bologna Process will be analyzed by use of the stocktaking reports that have been published by the Bologna Follow-up group (BFUG) in 2005, 2007, 2009, 2012 and 2015. The reports indicate for all participating countries the intensity of implementation of each of the aspects. Each of the aspects is indicated with a number from 1 to 5, 1 indicating poor implementation, 5 indicating full implementation.
1.5 Societal and scientific relevance
This study is a policy analysis on implementation at national level. The analysis will show whether the Bologna process indeed influenced the mobility rates and whether the goal of increasing mobility has been achieved. If it can be found that implementation indeed affects the mobility rates, recommendations to improve mobility can be made, namely by improving the implementation. If it can be found whether the tools affect both push and pull factors or only one of them, recommendations for balancing the mobility rates can be made. If no effect can be found, the usefulness of the Bologna process could be questioned. The analysis of the reform can gain knowledge to a better understanding of how reforms work and add knowledge to an already vast literature on implementation. The analysis of the varying implementation processes will also show whether the points in time of the implementation could be an explanation for the varying results and whether time plays a role for successful implementation.
1.6 Outline of the thesis
8
Chapter 2: Theoretical framework
This chapter discusses the theoretical framework for the analysis of the implementation of the Bologna process and its consequences on student mobility rates. This framework builds on implementation theory and push and pull theory. Based on this theoretical framework, expectations will be formulated on the relationship between the reform of the implementation (the Bologna process) and student mobility rates (both growth in mobility and imbalance of student mobility). It gives the basis for the further analysis. First, the different aspects of successful implementation, derived from the implementation theory, will be linked to the case of the Bologna Process. Next, the push and pull factors will be linked to some of the aspects of the Bologna process. It will be checked to what extent the Bologna Process aimed at enhancing the factors described in the push and pull method. The theoretical framework will help to understand to what extent the implementation of the tools aimed at enhancing the mobility. Through the following analysis, it will be then possible to say to what extent the implementation varied between the countries and whether there could be a relationship between the implementation of the Bologna Process and the mobility rates.
2.1 Introduction
In order to examine the relationship between the reform implementation and student mobility rates, first of all it needs to be clarified what implementation is and which factors influence the successfulness of a reform implementation. Since implementation is a complex process, the different aspects of it need to be exemplified. Afterwards the push and pull method will allow to establish the connection between the implementation and the expected outcome. It needs to be seen how the implementation of the instruments relate to the aspired goals. While the implementation theory describes how implementation works and which factors affect its successfulness, the push and pull theory describes factors that influence mobility. In particular, the push and pull factors are on the one side motives for students to leave their home country and on the other side motives to choose a particular country. Pull factors are therefore features that a make a country attractive to foreign students while push factors are causes to leave one’s home country. For each of the implemented instruments it will be checked whether they aimed at one or more push or pull factors. By relating the implemented tools to the push and pull factors the propositions will be derived on how the implementation possibly influenced the mobility rates.
2.2 Implementation theory
9 trouble in practical application of policies, they developed by observation general applicable assumptions on why policies fail. By analyzing the implementation process of the Economic Development Administration Program in Oakland in 1965, they found that the implementation process was much more difficult than initially expected. The goal of the program was to provide permanent new jobs to minorities through economic development. Many factors however provoked that “years later, construction has only been partially completed, business loans have died entirely, and the results in terms of minority employment are meagre and disappointing” (Pressman and Wildavsky 1984, p. xx). Through observing this example and analyzing the causative factors they formulated general assumptions about policy implementation. What is special about their research is that they concentrate on usual factors that impede policy implementation instead of looking for unusual circumstances and dramatic events. In their study, they deliberately chose “case material in which dramatic elements that are essentially self-explanatory are ruled out” (Pressman and Wildavsky 1984, p. xx). This is important, in their opinion, to appreciate how difficult it is to make the ordinary happen. They argue that people too often expect implementation to be straightforward and linear process, where everything works ‘according to plan’, but this is not the case. The authors formulated general questions that are crucial for successful implementation.
These are:
• Who had to act to begin implementation? • Whose consent was required to continue it? • How many participants were involved? • How long did it take to act?
10 understanding that apparently simple sequences of events depend on complex chains of reciprocal interaction. […] The separation of policy design from implementation is fatal. […] Though we can isolate policy and implementation for separate discussion, the purpose of our analysis is to bring them into closer correspondence with one another” (Pressman and Wildavsky 1984, p. xxv). What can be applied from their theory to this study are different factors that they state as crucial for successful implementation. These are the available resources, the continuity of the same participants being involved, the number of participants and institutions being involved, the political support, the media coverage and the time frame.
In a summary, Nangpuhan II (2011), summarized five theoretical assumptions retrieved from Pressman and Wildavsky’s analysis.
1. “Implementation should not be divorced from policy […] implementation must not be conceived as a process that takes place after, and independent of, the design of policy” (Pressman and Wildavsky 1984, p. 143)
2. “appreciation of the length of the length and unpredictability of necessary decision sequences in implementation should lead the designers of policy to consider more direct means for accomplishing their desired ends” (Pressman and Wildavsky 1984, p. 143)
3. “Consider carefully the theory that underlines your actions”11 (Nangpuhan II, 2011) ”Behind the seemingly endless number of roadblocks in the path of the EDA employment program in Oakland, lay deficiencies in concept. The economic theory was faulty because it aimed at the wrong target” (Pressman and Wildavsky 1984, p. 147).
4. “Continuity of leadership is important to successful implementation”12 (Nangpuhan II, 2011). When a program depends on so many actors, there are numerous possibilities for disagreement and delay” (Pressman and Wildavsky 1984, p. 100).
5. “Simplicity is much to be desired. The fewer the steps involved in carrying out the program, the fewer the opportunities for a disaster to overtake it” (Pressman and Wildavsky 1984, p. 147).
2.3 The Bologna Process from the view of the implementation theory
When applying these theoretical assumptions to the case of the Bologna process, it can be seen that from a theoretical point of view the preconditions of successful implementation were not given. In the case of the Bologna Process the policies and tools were made as guidelines for various different countries with different higher education systems. The theoretical assumption of formulating direct means of achieving the goals
11 could therefore not been given as all preconditions of all countries would have been taken into account. Consequently, two of the theoretical assumptions, the one saying that implementation should not be separated from policy and the other saying that the policy should consider direct means of achieving the goals, are not given. Furthermore, the continuity of leadership is not necessarily given in each of the countries as the implementation process was a process over 11 years from 1999 to 2010 and leadership in the participatory countries, and therefore possibly in the responsible positions as well, cannot be guaranteed and is even likely to have changed. Whether the theory that underlined the policy was well considered, can be checked by looking at the tools and the goals. The overall goal of the Bologna Process was to make European higher education more comparable, to simplify cooperation and mobility and to make European higher education more attractive for students outside of the EHEA. If the tools indeed influenced the mobility rates, will be checked through the analysis. The fifth theoretical assumption, to make policies and implementation as easy, and with the fewest number of steps involved, as possible was also not given in the formulation of the policy. Since the overall goal of the Bologna process was to create one higher education area which would require changes of the whole educational system in most of the countries it can be argued that the Bologna Process was not aimed at simplicity. Another requirement mentioned in the theoretical framework for successful implementation stated by Pressman and Wildavsky, was a low number of stakeholders involved. Due to the large amount of stakeholder involved in every country, according to Pressman and Wildavsky, many opportunities for blockage and delay were already given with the formulation of the policy. Additionally, the many different perspectives from stakeholders involved, involved the great risk of participants pursuing different interests and tools, making a successful and similar implementation very unlikely.
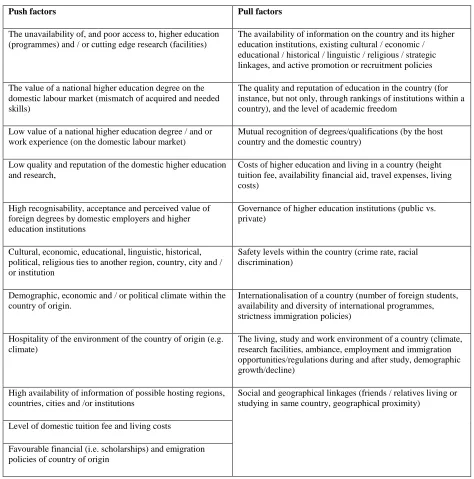
2.4 Push and pull factors
12
Table 2: Push and pull factors
Push factors Pull factors
The unavailability of, and poor access to, higher education (programmes) and / or cutting edge research (facilities)
The availability of information on the country and its higher education institutions, existing cultural / economic / educational / historical / linguistic / religious / strategic linkages, and active promotion or recruitment policies The value of a national higher education degree on the
domestic labour market (mismatch of acquired and needed skills)
The quality and reputation of education in the country (for instance, but not only, through rankings of institutions within a country), and the level of academic freedom
Low value of a national higher education degree / and or work experience (on the domestic labour market)
Mutual recognition of degrees/qualifications (by the host country and the domestic country)
Low quality and reputation of the domestic higher education and research,
Costs of higher education and living in a country (height tuition fee, availability financial aid, travel expenses, living costs)
High recognisability, acceptance and perceived value of foreign degrees by domestic employers and higher education institutions
Governance of higher education institutions (public vs. private)
Cultural, economic, educational, linguistic, historical, political, religious ties to another region, country, city and / or institution
Safety levels within the country (crime rate, racial discrimination)
Demographic, economic and / or political climate within the country of origin.
Internationalisation of a country (number of foreign students, availability and diversity of international programmes, strictness immigration policies)
Hospitality of the environment of the country of origin (e.g. climate)
The living, study and work environment of a country (climate, research facilities, ambiance, employment and immigration opportunities/regulations during and after study, demographic growth/decline)
High availability of information of possible hosting regions, countries, cities and /or institutions
Social and geographical linkages (friends / relatives living or studying in same country, geographical proximity)
Level of domestic tuition fee and living costs
Favourable financial (i.e. scholarships) and emigration policies of country of origin
13 education institutions, making studying abroad more likely to take place in one of the final semesters of study programs. Consequently, the degree cycle facilities mobility. It can be seen as a both a push and a pull factor. The implementation of the recognition of degrees and periods of study through the Diploma supplement, the European Credit Transfer System (ECTS) and the guidelines of the Lisbon Recognition Convention (1997) all effect the pull factors “availability of information” and “mutual recognition’. Especially the Diploma supplement provides information on the degree which could enhance the decision for a destination as a pull factor and on the other side provide information about the benefits about studying abroad as a push factor. The implementation of the quality assurance tools and measures simply effect the pull factor “quality and reputation of education” which can also be seen as an incentive to choose a destination country with a good reputation and implemented measures of quality assurance. Consequently, it can be said that the push and pull factors regarding the information, quality and reputation and recognition can be found in the aspects of Quality assurance, two-cycle-system and the aspects of recognition in terms of the diploma supplement and the ECTS. The following theoretical model shows the Bologna tools influenced by the push and pull factors.
2.4 Theoretical model
Push and Pull factors
•Information
•Quality and reputation •Recogntion of degrees
Bologna aspects
•Diploma supplement •Quality assurance
•European Credit Transfer System (ECTS) •Two-Cycle system
Implementation
•Level of implementation
Mobility
14 As explicated previously, it is expected that four Bologna tools (diploma supplement, quality assurance, ECTS, two-cycle system) are based on three push and pull factors (information, quality and reputation, recognition of degrees). Meaning, it is expected that their introduction gives incentives to students to study abroad or to choose a specific country, consequently providing push and pull factors for students. Only those Bologna tools are included in the analysis, which can (according to the push and pull theory) be seen as influencing the motivations for students to leave their country (push factor) or to choose a specific country (pull factor). Only including these tools, it is expected that the diploma supplement, quality assurance, ECTS, and the two-cycle system can (if successfully implemented) influence the numbers of incoming and outgoing students. The successfulness of the implementation will be measured by the means of levels indicating the percentages of implementation of the tools in one country.
15
Chapter 3: Methodology
This chapter will introduce the research design, the research method, the case selection, and the data collection and analysis. The study will be conducted in a comparative case study design. In the following, it will be illustrated which countries were chosen, why they were chosen and how they will be compared. The data collection part will give the basis for the operationalization as the indicators measured in the collected data will be used to compare the countries. The available data will not only give the basis for the aspects that will be compared but also for the time frame. After the data collection and operationalization parts the chapter will finish with a description of the data analysis and the strength and weaknesses of the research design.
3.1 Introduction
Based on the theoretical background of Implementation theory and push and pull method, the study will combine an analysis of the mobility rates and the implementation processes in the selected countries. The study will be conducted by analyzing qualitative data on the implementation processes in six countries, two countries with balanced mobility rates, two countries with more incoming than outgoing students and two countries with more outgoing than ingoing students. By looking at the state of implementation in the years of the stocktaking reports in relation to the mobility rates in the same years, the countries can be compared in terms of the implementation process and the mobility rates.
3.2 Research design
The study will be conducted in a comparative casa study design. The six chosen countries will be compared on the basis of their mobility rates and their status of implementation of the different tools of the Bologna process in the years from 2005 to 2015. How the tools were chosen will be elaborated in the Data collection section. In the following the case selection will be explained, followed by an elaboration on the data collection. The data collection part will give the basis for the operationalization.
3.3 Case selection
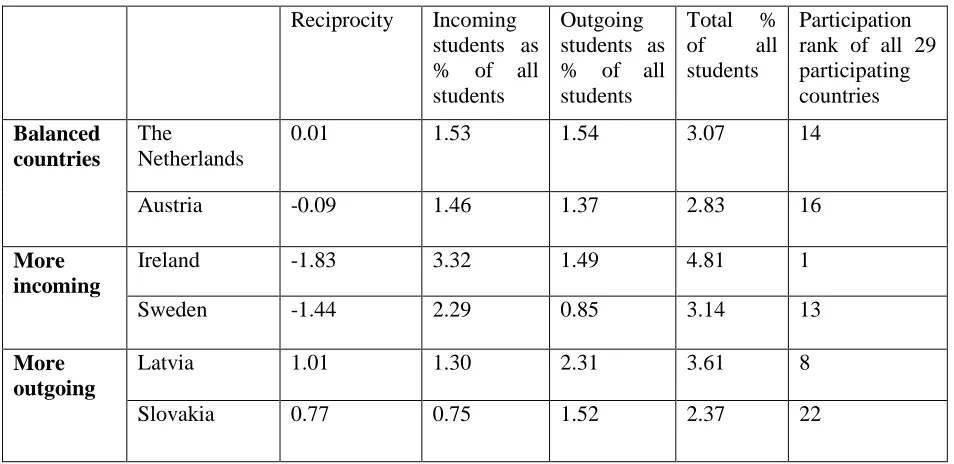
16 study was motivated by a statistic of the Dutch Organisation for Internationalisation in Higher Education from 2014. The statistic, included in Appendix 1, shows the number of mobile students, so the number of incoming and outgoing students as percentages of all students in each of the participatory countries in the Erasmus program for the years 2013/2014. Furthermore, the statistic shows for the same time frame a ranking of the participatory countries regarding their overall percentage of mobile students. The statistic shows that the two countries with the most balanced mobility rates in 2013-2014 were the Netherlands with a reciprocity of 0.01% and Austria with a reciprocity of 0.09%. The Netherlands had an incoming mobility rate of 1.53% and an outgoing mobility rate of 1.54%, Austria had an incoming rate of 1.46% and an outgoing rate of 1.37% of all students in the country. Both countries are in the middle field of the participation ranking, with the Netherlands on rank 14 and Austria on rank 16 of 29. The most participating country in the examined time frame is Ireland with 4.81% mobile students. At the same time, Ireland is also shown as the most imbalanced country with 3.32% students coming in to the country with the Erasmus program, but only 1.49% is going out. This makes a reciprocity of 1.83%. More incoming that outgoing students is next to Ireland, also the case in Sweden with only 0.85% of the students going out and 2.29% of students coming in, resulting in a reciprocity of -1.44%. The countries with more outgoing than incoming students are Latvia with 1.30% incoming but 2.31% outgoing students, and Slovakia with 0,75% incoming and 1.52% outgoing students. Sweden is also in the middle field of participation, on rank 13, while Latvia and Slovakia with a similar imbalance are quite diverse in their participation. Latvia is on rank 8 one of the most participating countries while Slovakia on rank 22 is one of the least participating countries. The table below shows an overview of the participation rates in the countries.
Table 3: Participation Erasmus 2013-2014
Reciprocity Incoming students as % of all students
Outgoing students as % of all students
Total % of all students
Participation rank of all 29 participating countries Balanced countries The Netherlands
0.01 1.53 1.54 3.07 14
Austria -0.09 1.46 1.37 2.83 16
More incoming
Ireland -1.83 3.32 1.49 4.81 1
Sweden -1.44 2.29 0.85 3.14 13
More outgoing
Latvia 1.01 1.30 2.31 3.61 8
Slovakia 0.77 0.75 1.52 2.37 22
17
3.3 Data collection
The data that will be used for the comparison is retrieved from various sources mostly provided by the European commission. To compare the mobility rates data from different statistics have been brought together. The total numbers of incoming and outgoing Erasmus students in the years from 2005 to 2012 have been retrieved from the Erasmus+ website containing the “Statistics of the Erasmus Sub-programme Country Statistics 2000 – 2012” published by the European Commission.13 The percentages of incoming and outgoing students of the whole student population in the six countries is retrieved from the statistic of the Dutch Organization for internationalization in education (Nuffic).14 The incoming and outgoing rates for 2013/2014 are also retrieved from Nuffic.15 The data needed for the comparison of the implementation processes is retrieved from the stocktaking reports published by the Bologna Follow-up group in 2005, 2007, 2009, 2012 and 2015. The stocktaking reports present scorecards on the different aspects of the Bologna aspects for each of the countries. They provide an overview of three action lines, quality-assurance, two-cycle system, recognition of degrees and periods of studies. The reports were made through evaluating questionnaires that have been answered by all participating countries. A working group on the stocktaking reports had been established at a meeting of the Bologna Follow-up group in Dublin on 9 March, 2004 (BFUG, 2005). The “stocktaking exercise should be conducted, to measure the progress made in implementing certain reform with the European Higher Education Area” and offers “the possibility to take corrective measures, if appropriate” (BFUG 2005, p. 9). In its first two meetings, the working group determined the indicators to be used in the stocktaking reports. (BFUG 2005, p. 11). To determine the progress made by the countries the working group reviewed each of the three action lines and elaborated key criteria for each one. “Each criterion was further expanded on the basis of five benchmarks, which would serve to measure the extent of progress” (BFUG 2005, p. 15)
3.4 Operationalization
The key criteria used in the stocktaking reports also give the basis for the independent variables presented in the causal diagram in 2.4. As already mentioned in the theoretical framework not all tools of the Bologna process can be directly linked to the push and pull factors. In these study, only the aspects that could be related to the push and pull factors are considered. In the stocktaking reports, each of the three action lines, quality assurance, two-cycle system and recognition are divided in sub aspects. Because for quality assurance, these sub aspects change throughout the years, only the aspects that have been checked in all
13 See https://ec.europa.eu/programmes/erasmus-plus/about_en#tab-1-5 (accessed on August 7, 2017)
14 See https://www.nuffic.nl/en/internationalisation/mobility-statistics/cred-mobility/erasmus-plus-performance (accessed on August 7, 2017)
19
3.4 Data analysis
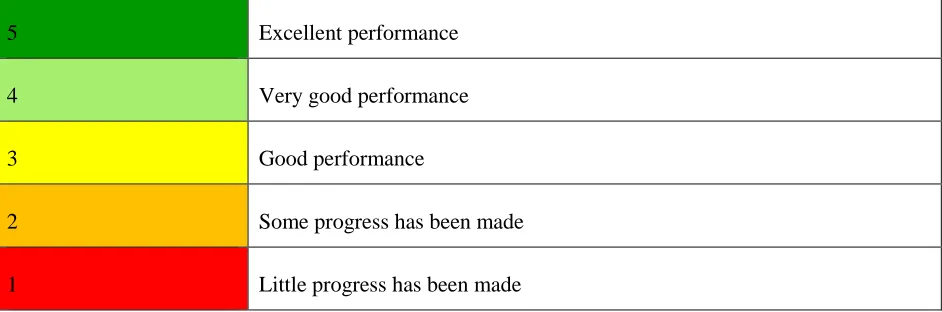
[image:23.612.74.543.316.477.2]The level of implementation of these tools will be retrieved from the stocktaking reports. In the stocktaking reports the levels of implementation are color-coded as already shown in 3.3 and are given numbers from 1. ‘little progress has been made to 5. ‘excellent performance’. The color codes and numbers will be copied from the stocktaking reports into tables that will be used for the analysis. For the tool of quality assurance, the three sub aspects will be summarized in one color code by adding the three numbers indicating the codes and dividing them through three. For the other three tools the numbers and corresponding color-codes will only be copied. The color-color-codes will then be displayed in the following tables. For each of the six countries, first of all the mobility rates, so the number of incoming and outgoing students will be displayed for the time of analysis from 2005 to 2014. Also, the ratios between the number of incoming and outgoing students will be displayed.
Table 4: Mobility rates
2005/2006 2007/2008 2009/2010 2011/2012 2013/2014 Incoming
students
% of all students Total number Outgoing
students
% of all students Total number Total
Ratio:
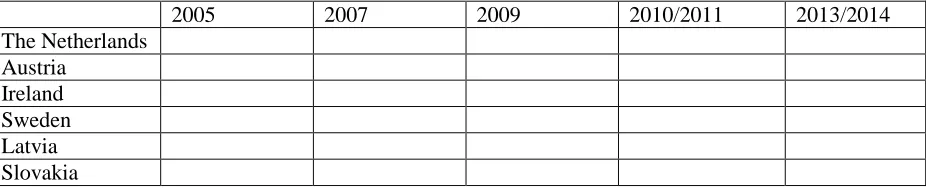
Afterwards the implementation processes for each of the tools will be displayed in the following table.
Table 5: Implementation of the tools
2005 2007 2009 2010/2011 2013/2014
The Netherlands Austria
Ireland Sweden Latvia Slovakia
[image:23.612.77.540.533.628.2]20
Table 6: Color-codes
5 Excellent performance
4 Very good performance
3 Good performance
2 Some progress has been made
1 Little progress has been made
3.5 Strengths and weaknesses of research design
21
Chapter 4: Data Analysis
4.1 Introduction
In the previous chapters, background information about the bologna process, the theoretical framework of this study and its methodology have been given. After laying out what kind of data was gathered, this data will now be analyzed. In chapter two, it has already been discussed that from a theoretical point of view, based on the theoretical assumptions, retrieved from Pressman and Wildavsky (1984), the Bologna reform did not meet the preconditions for successful implementation. In the following, will be analyzed if by looking at empirical data, the reform can be seen as having an positive influence on the mobility rates, hence, as being successful in terms of increasing mobility.
First, the mobility rates of the six chosen countries the Netherlands, Austria, Ireland, Sweden, Slovakia and Latvia will be compared. Next, the tables of each of the implemented tools, quality assurance, two-cycle system, diploma supplement and ECTS will show the different levels of implementation in the six chosen countries in the time frame of the stocktaking reports. These tables will then be analyzed, to see whether relations between high levels of implementation and high mobility rates can be found.
4.3 Mobility rates
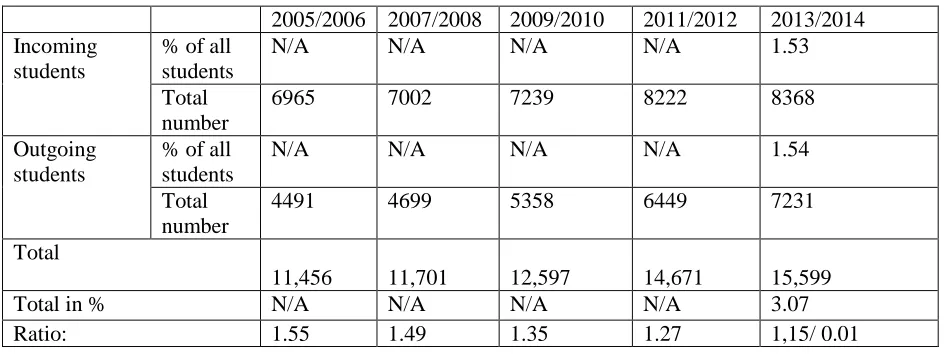
[image:25.612.71.544.462.639.2]The following tables show the mobility rates in the six chosen countries from 2005/2006 to 2013/2014.
Table 7: The Netherlands
2005/2006 2007/2008 2009/2010 2011/2012 2013/2014 Incoming
students
% of all students
N/A N/A N/A N/A 1.53
Total number
6965 7002 7239 8222 8368
Outgoing students
% of all students
N/A N/A N/A N/A 1.54
Total number
4491 4699 5358 6449 7231
Total
11,456 11,701 12,597 14,671 15,599
Total in % N/A N/A N/A N/A 3.07
22
Table 8: Austria
2005/2006 2007/2008 2009/2010 2011/2012 2013/2014 Incoming
students
% of all students
N/A N/A N/A N/A 1.46
Total number
3735 3983 4206 4827 4934
Outgoing students
% of all students
N/A 1.62 1.46 N/A 1.37
Total number
3971 4133 4234 4549 4556
Total 7,706 8,116 8,440 9,376 9,490
Total in % N/A N/A N/A N/A 2.83
Ratio 0,94 0,96 0,99 1,06 1,08/ -0.09
Table 9: Ireland
2005/2006 2007/2008 2009/2010 2011/2012 2013/2014 Incoming
students
% of all students
N/A N/A N/A N/A 3.32
Total number
3870 3877 3958 4375 4821
Outgoing students
% of all students
N/A N/A N/A N/A 1.49
Total number
1567 1514 1600 1963 2121
Total 5437 5391 5558 6338 6942
Total in % N/A N/A N/A N/A 4.81
[image:26.612.72.540.484.648.2]Ratio 2.47 2.56 2.47 2.23 2.27/ -1.83
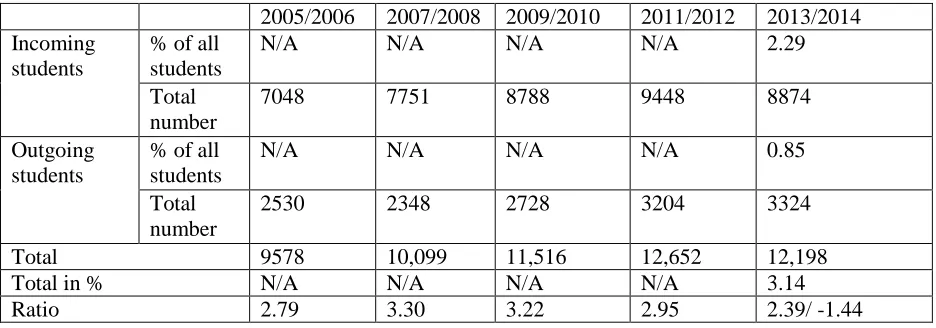
Table 10: Sweden
2005/2006 2007/2008 2009/2010 2011/2012 2013/2014 Incoming
students
% of all students
N/A N/A N/A N/A 2.29
Total number
7048 7751 8788 9448 8874
Outgoing students
% of all students
N/A N/A N/A N/A 0.85
Total number
2530 2348 2728 3204 3324
Total 9578 10,099 11,516 12,652 12,198
Total in % N/A N/A N/A N/A 3.14
23
Table 11: Latvia
2005/2006 2007/2008 2009/2010 2011/2012 2013/2014 Incoming
students
% of all students
N/A N/A N/A N/A 1.30
Total number
258 354 418 727 976
Outgoing students
% of all students
N/A N/A N/A N/A 2.31
Total number
681 968 1269 1446 1367
Total 939 1322 1687 2173 2,343
Total in % N/A N/A N/A N/A 3.61
[image:27.612.69.541.290.450.2]Ratio 0.38 0.37 0.33 0.50 0.71/ 1.01
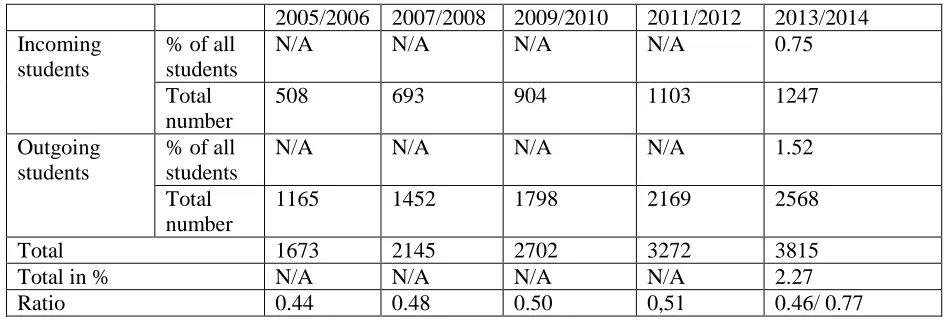
Table 12: Slovakia
2005/2006 2007/2008 2009/2010 2011/2012 2013/2014 Incoming
students
% of all students
N/A N/A N/A N/A 0.75
Total number
508 693 904 1103 1247
Outgoing students
% of all students
N/A N/A N/A N/A 1.52
Total number
1165 1452 1798 2169 2568
Total 1673 2145 2702 3272 3815
Total in % N/A N/A N/A N/A 2.27
Ratio 0.44 0.48 0.50 0,51 0.46/ 0.77
24 same countries, albeit in a changing order. Ireland as the most imbalanced country, had throughout all the investigated years more than twice as much incoming students than outgoing students. At the same time, Ireland had a comparable high number of mobile students and is even the country with the highest participation rates in the Erasmus program in 2013/2014. While Sweden had in the same years almost twice as much incoming students as Ireland, the overall participation of all students is somewhat smaller than in Ireland, with 3.14% of all students being mobile compared to 4.81% of all students being mobile in Ireland. The overall number of Erasmus students in Sweden, however, is much higher than in Ireland with 12,198 Erasmus students in Sweden and 6,942 Erasmus students in Ireland in 2013/2014. In Sweden in some years, almost three times more students were coming in to the country than students were going out. Latvia and Slovakia on the other side are countries with quite low numbers of Erasmus students but quite high numbers of outgoing students compared to their number of incoming students. Latvia’s number of mobile students in 2013/2014 does not even reach Sweden’s number of outgoing students in the same year. While Sweden had only 3,324 outgoing students compared to 8,874 incoming students, the overall number of mobile students in Latvia at the same time, is only 2,343. It needs to be kept in mind however, that there are huge differences in the numbers of all students and in the numbers of inhabitants between the countries. While Sweden had a population of about 9.8 million inhabitants in 2015, Latvia’s population came only up to 1.98 million inhabitants.16 Consequently, the number of students varies drastically with 246,400 students in Sweden and 50,600 students in Latvia in 2015.17 However, looking at the percentages it can be seen that the percentage of students of the whole population is in both countries roughly 2.5% in 2015. The participation rates in 2013/2014 show that the number of Erasmus students as percentage of the whole student population is even a bit higher in Latvia with 3.61 percent as compared to Sweden with 3.14 percent. The overall participation rates in all countries are in general quite similar, varying between 2.27% in Slovakia and 4.81% in Ireland. Also, the mobility rates are shown to have increased in all countries, albeit in some countries more than in others, they show similar participation rates in 2013/2014.
4.4 The Tools
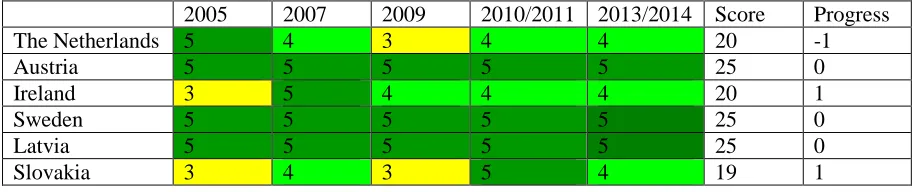
In the following the levels of the status of implementation of the four tools, diploma supplement, quality assurance, ECTS and two-cycle system in the years from 2005 to 2013/2014 in all six countries are displayed. To indicate the levels, the color-codes presented in chapter 3 will be used. In the column ‘score’, the levels for each tool, of each country, for all years are added up to one sum, to simplify comparison. The
16 See http://data.worldbank.org/country/sweden?view=chart and
http://data.worldbank.org/country/latvia?view=chart (accessed on August 11, 2017) 17 See
25 progress is calculated by adding up the differences between the two-year gaps. In other words, subtracting the level of 2005 from 2007, the level of 2007 from 2009, the level of 2009 from 2010/2011 and the level of 2010/2011 from 2013/2014 and adding up the results. Looking at the implementation of the diploma supplement and calculating the score for the Netherlands, it looks like this: (4-5) + (3-4) + (4-3) + (4-4) = -1. Minus one thereby indicates negative progress, zero indicates no progress and one indicates little progress.
Table 13: Diploma supplement
2005 2007 2009 2010/2011 2013/2014 Score Progress
The Netherlands 5 4 3 4 4 20 -1
Austria 5 5 5 5 5 25 0
Ireland 3 5 4 4 4 20 1
Sweden 5 5 5 5 5 25 0
Latvia 5 5 5 5 5 25 0
Slovakia 3 4 3 5 4 19 1
Table 14: Quality assurance
2005 2007 2009 2010/2011 2013/2014 Score Progress
The Netherlands 5 5 5 5 4 24 -1
Austria 4 5 5 4 4 22 0
Ireland 5 5 5 5 5 25 0
Sweden 5 5 5 4 3 22 -2
Latvia 5 5 4 4 3 21 -2
Slovakia 4 5 2 2 2 15 -2
Table 15: European Credit Transfer System
2005 2007 2009 2010/2011 2013/2014 Score Progress
The Netherlands 5 5 4 5 5 24 -1
Austria 5 5 4 2 4 20 -1
Ireland 4 5 5 5 5 24 1
Sweden 4 5 5 5 4 23 0
Latvia 3 4 4 4 4 19 1
[image:29.612.71.534.613.706.2]Slovakia 5 5 3 2 4 19 -3
Table 16: Two-cycle-system
2005 2007 2009 2010/2011 2013/2014 Score Progress
The Netherlands 5 5 5 5 4 24 -1
Austria 4 3 3 2 5 17 1
Ireland 5 5 5 5 5 25 0
Sweden 3 2 5 5 5 20 2
Latvia 5 5 5 5 5 25 0
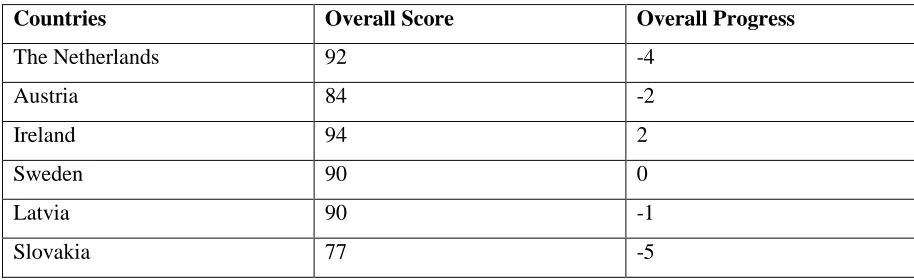
26 The following table indicates the added-up values of all levels, and the overall progress for each country.
Table 17: Country comparison
4.4.1 Progress
When looking at the progress, the results are quite surprising. In some countries, the levels of implementation are shown has having decreased instead of the hypothetically expected increase. This is especially striking for quality assurance. In all countries but Ireland, the level of implementation of quality assurance in 2013/2014 is lower than it had already been in previous years. A reason for that could be different criteria used in the stocktaking reports to evaluate the level. Even though the criteria included to measure quality assurance vary throughout the report, in this study only those criteria are included that are measured in each of the reports, so a change of the criteria measured cannot be an explanation for the decrease. However, the percentages determined to indicate the different levels of implementation are only presented in the first stocktaking report. Therefore, it cannot be ensured that the percentage have not changed, even though it could be assumed that a change would have been mentioned in the reports. Nevertheless, the percentages could vary throughout the reports, as it is not indicated in each report which percentages determine the equivalent level of implementation.
Adding up the values indicating the progress, the best progress was made by Ireland. Nevertheless, Ireland made only progress in the ECTS, starting out with scoring a four in 2005 but followed by a five in the years after. In quality assurance and the two-cycle system Ireland shows no progress as they already scored a five in 2005 and did not show a decrease. Only in the implementation of the diploma supplement, Ireland scored a three in 2005 but scored a five and three times a four in the following years. The next best progress can be observed by looking at Latvia and Sweden. Latvia also scores a five in the two-cycle system and the diploma supplement throughout the whole timeframe. Only in quality assurance Latvia shows a decrease from 2011/2012 to 2013/2014 from a four to a three. This decrease in quality assurance, however, as already stated, can be noted for all countries but Ireland.
Countries Overall Score Overall Progress
The Netherlands 92 -4
Austria 84 -2
Ireland 94 2
Sweden 90 0
Latvia 90 -1
27 What needs to be considered when looking at the progress, is that all selected countries joined the Bologna Process in the same year, in 1999. A later admission can therefore not be an explanation for poor implementation. For the two-cycle system, however, it needs to be noted that some countries already had the two-cycle-system before the beginning of the Bologna process. The two countries scoring a five in the implementation of the two-cycle system throughout the whole timeframe, are Ireland and Sweden. It needs to be noted that the Irish educational system has been traditionally divided into Bachelor and Masters degrees and Latvia had already started to implement the two-cycle system in the beginning of the 1990’s.18 Also the European credit transfer system had already been introduced with the Erasmus program in 1987. Still, in 2013/2014, only two countries, namely Ireland and the Netherlands, have implemented the grading system with ¨excellent performance¨. Especially Slovakia, only scored a two in 2010/2011 which could be one explanation for their low rates of incoming Erasmus students. Also, regarding their quality assurance, Slovakia only scored a two from 2009 to 2013/2014. Only, in the implementation of the two-cycle system and the diploma supplement, Slovakia scored comparably high.
4.4.2 Scores
When adding up the scores, the highest scoring country is also Ireland, with an overall score of 94, closely followed by the Netherlands, scoring a 92. What is striking about the Netherlands, is that the Netherlands scored in all tools a five in the first years but lower in the years after. In the implementation of the two-cycle system and quality assurance, the Netherlands scored five from 2005 to 2010/2011 but only four in 2013/2014. An explanation could either be a change in the respondent who answered the questionnaire, to someone who estimates the situation differently, or again a change in the criteria that the working group set to measure the levels. It is rather unlikely that the Netherlands reversed the two-cycle-system. What is also surprising, is the that the Netherlands scored a three in Diploma supplements in 2009, when considering that the universities were at that time already obliged by law to give out diploma supplements (Westerheijden, et al. 2008, p.56). Looking at the overall scores, the Netherlands are closely followed by Sweden and Latvia, both scoring a 90. While Austria also scores comparably low with an 84, only Slovakia stands out, with an overall score of 77.
After analyzing the development of the mobility rates and the levels of implementation of the tools in the six countries, the next chapter will cover the conclusion of this study, will provide a discussion of these conclusions and gives some recommendations for further research.
28
Chapter 5: Conclusion and Discussion
The study started out with the research questions “To what extent can positive or negative Erasmus mobility
rates of participating European countries be explained through the implementation of the Bologna
process?”. To answer this research question, background information about the Bologna process and the Erasmus program has been discussed. To establish the research method a theoretical framework of implementation theory and push and pull factors was created. By comparing the mobility rates of the Erasmus program and the level of implementation of the mobility enhancing tools of the Bologna process, it was possible to analyze a potential correlation between them. It was expected that the higher the levels of implementation of each of the tools, the higher the participation in the Erasmus program. For quality assurance, it was expected that the lower the quality assurance in one country, the higher the outgoing mobility rates. Moreover, it was expected that the countries with balanced mobility implemented the tools more consistently than the imbalanced countries. In the following the results of the analysis will be presented and discussed. Subsequently the results will be placed in the societal context to deduce policy advice and recommendations for further research.
5.1 Conclusion
From the analysis of the theoretical aspects of the Bologna process can be seen that the preconditions
for successful implementation were not given in the case of the Bologna Process. When looking at the
theoretical assumptions for successful implementation by Pressman and Wildavsky it could be
assumed that a successful implementation was rather unlikely. Still, the mobility rates show a
continuous growth throughout the analyzed timeframe in all six countries. However, in the Bologna
declaration no precise goal was mentioned on how much the mobility rates were to be increased. Also,
the question remains whether the growth can be linked to the implementation of the tools that aimed
at increasing mobility. The favored countries for an Erasmus stay were Ireland and Sweden. When
looking at the implementation of the tools, it shows that Ireland was indeed the country that scored the
highest in the implementation of all tools, closely followed by Sweden. Hence this suggests a
correlation between successful implementation of the Bologna tools and high participation rates. The
highest participation rates as percentages of all students in one country were reached in 2013/2014 in
Ireland with 4.81% and in Latvia with 3.61%. Looking at the implementation, both countries
implemented the tools comparable good, both with a score of 90 when adding up all scores throughout
29 Netherlands with an overall score of 92. Looking at the Netherland’s implementation score, their
participation rate (3.07%), and their balance of incoming and outgoing students, it can be assumed that
good implementation can be related to high and balanced mobility rates. Looking at Austria and Ireland
this nevertheless does not apply. In the case of Ireland successful implementation is only related to
high incoming rates but not to the outgoing rates. An explanation could be that Irish students do not
see the necessity to go abroad as they are contented with their educational system, its possibilities and
quality. Especially in the field of quality assurance Ireland scored the highest level in each report.
Austria on the other hand, is quite balanced but the mobility rates did not increase very noticeable and
the rates have not been already high in the first year as it is the case for the Netherlands where the
increase was not very high but the mobility rates had been already quite high in the first years. Austria
also scored quite low in the implementation which could be an explanation for the low increase in the
mobility rates. Balanced mobility rates can therefore not be explained through high levels in
implementation of the Bologna process. Good implementation, however, seems to correlate with high
participation rates. The countries with the highest implementation scores, Ireland (94), the Netherlands
(92) and Latvia and Sweden (90) all show at the same time the highest participation rates in their
countries. In 2013/2014, Ireland as the most participating country with 4.81%, was followed by Latvia
with 3.61%, Sweden with 3.14% and the Netherlands with 3.07%. The countries with low rates of
outgoing students, Ireland and Sweden are at the same time countries with well-known, high-quality,
educational systems. Nevertheless, high-quality educational system cannot explain low outgoing
mobility rates, as the Netherlands have a high number of outgoing students despite a high-quality
educational system. Further research would need to investigate what kind of other reasons play a role
in the decision to study abroad, as for example cultural differences. The countries with a low rate of
incoming students, Latvia and Slovakia are relatively small countries with higher education system
that are likely less known amongst students as compared to the other four countries. Regarding their
implementation Latvia and Slovakia score high in the implementation of the two-cycle system but
relatively low in the implementation of quality assurance systems. Consequently, it is only been
simplified for domestic students to leave the country through the introduction of the two-cycle system,
but Latvia and Slovakia have not increased their attractiveness through the implementation of quality
assurance tools. Additionally, the overall slightly better implementation of the Bologna tools by Latvia,
in comparison to Slovakia, could explain the overall higher percentage of mobile students in Latvia
30 All things considered, it can be concluded that indeed a correlation appears to exist between high
participation rates and high levels of implementation of the four mobility promoting tools.
Nevertheless, no correlation between a good implementation process and balanced mobility rates could
be found. While from the theoretical aspects of the reform, a successful implementation did not seem
very probable, still a success can be seen regarding a continuous growth of the mobility rates in all
countries. Still it needs to be acknowledged that no goal was set on how much the mobility rates were
to be increased with the Bologna declaration, and high differences can be seen in the percentages of
increase between the countries. Still a successful implementation of the mobility promoting tools as
the Diploma supplement, quality assurance, the European Credit Transfer System and the two-cycle
system can be – based on this analysis - linked to higher mobility rates.
5.2 Discussion
31
5.3 Recommendation for future research
32
References:
Altbach, P. G. (1998). Comparative perspectives on higher education for the twenty-first century. Higher
Education Policy, 11(4), 347-356.
BOLOGNA DECLARATION (1999) Towards the European Higher European Area. Conference of Ministers responsible for Higher Education in 29 European
countries (June), Bologna, Italy.
Bologna Follow-up Group and board meetings. (n.d.). Retrieved from https://www.ehea.info/pid35089/bfug-and-board-meetings.html
Bologna Process Stocktaking. Report from a working group appointed by the Bologna Follow-up Group to the Conference of European Ministers Responsible for Higher Education. Bergen2005,(5), 19-20.
Bracht, O., Engel, C., Janson, K., Over, A., Schomburg, H., & Teichler, U. (2006). The professional value of ERASMUS mobility. Kassel, Germany: Final Report, International Centre for Higher Education
Research, INCHER.
De Wit, H., Hunter, F., Howard, L., & Egron-Polak, E. (2015). Internationalisation of higher education. Brussels: European Parliament.
Erasmus+ performance. (2017, February 17). Retrieved from
https://www.nuffic.nl/en/internationalisation/mobility-statistics/cred-mobility/erasmus-plus-performance
Erasmus+ student mobility. (2017, February 17). Retrieved from
https://www.nuffic.nl/en/internationalisation/mobility-statistics/cred-mobility/erasmus-plus-student-mobility
EU activities in the field of higher education. (2017, June 30). Retrieved from http://ec.europa.eu/education/policy/higher-education_en/
European Commission/EACEA/Eurydice, 2012. The European Higher Education Area in 2015: Bologna Process Implementation Report. . Luxembourg: Publications Office of the European Union.
European Commission/EACEA/Eurydice, 2015. The European Higher Education Area in 2015: Bologna Process Implementation Report. Luxembourg: Publications Office of the European Union. Keeling, R. (2006). The Bologna Process and the Lisbon Research Agenda: the European Commission’s expanding role in higher education discourse. European Journal of Education, 41(2), 203-223.
Kolster, R. (2014). Academic attractiveness of countries; a possible benchmark strategy applied to the Netherlands. European journal of higher education, 4(2), 118-134.
Latvia. (n. d.) Retrieved from http://data.worldbank.org/country/latvia?view=chart Ministerial declarations and communiqués. (n.d.). Retrieved from
https://www.ehea.info/pid34363/ministerial-declarations-and-communiques.html