Munich Personal RePEc Archive
Bayesian Process Networks: An
approach to systemic process risk
analysis by mapping process models onto
Bayesian networks
Oepping, Hardy
Jade Hochschule Wilhelmshaven, Department of Management,
Information, Technology
7 September 2016
Online at
https://mpra.ub.uni-muenchen.de/73611/
Bayesian Process Networks:
An Approach to Systemic Process Risk Analysis by Mapping Process
Models onto Bayesian Networks
Abstract: This paper presents an approach to mapping a process model onto a Bayesian network resulting in a Bayesian Process Network, which will be applied to process risk analysis. Exemplified by the model of Event-‐driven Process Chains, it is demonstrated how a process model can be mapped onto an isomorphic Bayesian network, thus creating a Bayesian Process Network. Process events, functions, objects, and operators are mapped onto random variables, and the causal mechanisms between these are represented by appropriate conditional probabilities. Since process risks can be regarded as deviations of the process from its reference state, all process risks can be mapped onto risk states of the random variables. By example, we show how process risks can be specified, evaluated, and analysed by means of a Bayesian Process Network. The results reveal that the approach presented herein is a simple technique for enabling systemic process risk analysis because the Bayesian Process Network can be designed solely on the basis of an existing process model.
Keywords: process models; process modelling; process chains; risk management; risk analysis; risk assessment; risk models; Bayesian networks; isomorphic mapping.
1. Introduction
With the work of Thomas Davenport in the early 90s, process management became a highly recognized discipline of business management. According to Davenport (1993, p. 19), a process is ‘a specific ordering of work activities across time and place, with a beginning, an end, and clearly identified inputs and outputs: a structure for action.’ The internationally recognized quality management standard ISO 9001 demands a process oriented management approach, which ‘involves the systematic definition and management of processes, and their interactions, so as to achieve the intended results in accordance with the quality policy and strategic direction of the organization’ (DIN 2015b, p. 11).
With the latest revision of this standard, a further focus was placed on risk management. ‘Management of the processes and the system as a whole can be achieved using the PDCA cycle…with an overall focus on risk-‐based thinking…aimed at taking advantage of opportunities and preventing undesirable results’ (DIN 2015b, p. 11). ‘Risk-‐based thinking enables an organization to determine the factors that could cause its processes and its quality management system to deviate from the planned results, to put in place preventive controls to minimize negative effects and to make maximum use of opportunities as they arise’ (DIN 2015b, p. 9). Possible measures to implement these requirements have to ‘ensure the necessary information is available to operate and improve the processes and to monitor, analyse and evaluate the performance of the overall system’ (DIN 2015a, p. 18). While process risk management is strictly demanded, specifications as how to do this is, however, are not made. Organisations, therefore, can and must decide what methods and tools they implement to meet the requirements of a risk-‐based process control adequately.
As part of a project to develop standards for a unified process specification language the National Institute of Standards and Technology has rated the capability of describing the stochastic properties of a process to be useful but not essential for process modelling (Schlenoff et al. 1996, p. 13, pp. 26-‐27). Against the background of an increasing importance of risk management, various approaches by several authors to systematically integrating risk information into process models have been developed in the following years, some of which are outlined below.
Rosemann and Zur Muehlen (2005) stated that a suitable process risk model has to consider the individual risks as well as the cumulative risks, the impact of risks on process goals, and the relationship between risks in the form of cause-‐effect chains. To meet some of these requirements, they extended the model of Event-‐driven Process Chains (EPC) by introducing risk icons that are linked to the functions of the process model. Cope et al. (2010a) extended the BPMN process model by representing risks as events that directly affect the process resources, thereby indirectly affecting the performance and costs of the process. Moreover, their approach additionally offers the possibility of specifying the cause-‐effect relationships between risk events. The authors pointed out the potential of transforming their risk-‐extended process model into a Bayesian network, which could then be used for further quantitative risk analysis, but left this approach to future research (Cope et al. 2010b, p. 3).
the unavailability of some resource properties. The quantity and quality demands on the resources of a process are specified as enabling conditions for activities. If these conditions are violated by risk events, the activity in question won’t be executed, resulting in the unavailability of the outputs of that activity. If these outputs again represent inputs of other activities within the process model, those activities may not be executed which as a consequence renders the generated products or services unavailable. The authors demonstrated a clearly structured and simple approach to process risk modelling by means of existing modelling elements of a Petri net (resources, activation conditions).
Suriadi et al. (2014) conducted a literature review investigating the current research in the field of risk-‐based business process modelling. They noted that 20 of the 27 closely investigated papers worked on approaches to a model-‐based documentation of risk information, whereas 18 papers tried to extend process models by limited additional process risk analysis capabilities. As a conclusion of their literature review, they formulated future research needs in enhancing process modelling with risk modelling techniques, e.g. Bayesian Networks.
This paper adheres to their suggestion and presents an approach to mapping a process-‐ model onto a Bayesian network, which henceforth is denoted as a Bayesian Process Network (BPN). In the second section, it will be shown that the model of Event-‐driven Process Chains (EPC) can be considered a causal structure of a Bayesian network. In the third section, an approach to transforming the EPC process model into a homomorphous Bayesian network will be described. For this purpose, every element of the process model is mapped onto a random variable. Process risks are represented as random variables deviating from their reference states. It will be demonstrated how the causal mechanisms between the process elements can be mapped onto the Bayesian process network by appropriate specifications of conditional probabilities. The fourth section will show how the Bayesian process network can be applied to a systemic analysis of process risks.
2. Structure of EPC Models and Bayesian Networks
For the following explanations, it is assumed that a process model according to the method of Event-‐driven Process Chain (EPC) is given. Event-‐driven process chains are an integral part of the world's leading ERP system SAP. Along with the Business Process Modelling Notation (BPMN), it has found widespread use and acceptance within the process modelling community.
The concept of EPC focuses on the event-‐oriented control flow of processes. The control flow unfolds the flow logic of the process represented by the temporal and causal arrangement of events and functions within the process model. An event represents an instantiated property of one or more information objects on which the further process flow depends. An information object is a semantically descriptive and identifiable fact about the process environment. A function represents a task whose execution is triggered by events and which causes events again. If an event is caused by an individual function or a function is caused by an individual event, the flow elements are connected with each other by an arc directed from the cause to the effect (Keller et al. 1992).
If multiple events can be generated by a function, an AND, OR, or XOR operator indicates whether every event, at least one event or exactly one event is generated. The function is connected to the operator by an arrow pointing to the operator. The operator is connected to the consequence events by arrows pointing to the respective events. An event triggering each function of a set of subsequent functions can be modelled using the AND operator (Keller et al. 1992, pp. 13-‐15). On the other hand, if at least one or exactly one of the following functions is triggered by an event, an additional function has to be inserted into the process model, whose task is to decide which of the following functions will be triggered. In this case the decision function creates a start event for each of the following functions, which is directly connected to the corresponding subsequent function by an arrow pointing to the function. If the occurrence of an individual event is caused by the interaction of several functions, AND, OR, or XOR operators specify whether the event is generated by the interaction of all, at least one, or exactly one function, respectively. Likewise, this technique is used for modelling the interaction of events triggering one subsequent function. By interconnecting operators, complex effect hierarchies can be created (Scheer 1998, p. 126).
In addition to modelling the control flow, an extended concept of Event-‐driven Process Chains allows for a representation of the organisational units executing a function (organisational flow), the objectives to be achieved (target flow), the goods and services to be consumed and produced (product and service flow), the resources to be consumed (resources flow), and information objects to be evaluated and generated (information flow). All these process objects are represented by specific symbols and connected to the associated functions by arrows pointing to the generated objects or the resource consuming functions in order to clarify the causal relationships (Scheer 2002, pp. 18-‐ 31). After the notion ‘process’ has been explained on the basis of the EPC model, a corresponding definition of a process risk an be derived.
A process risk refers to a possible but undesirable deviation of a function, event, or object from its reference state represented in the process model. The possible deviations of functions, events, and objects from their reference states are denoted as functional risks, event risks, and object risks, respectively. A function risk is caused by the risk of events triggering the function or by the risks of objects to be consumed by the function. As a consequence a function risk can cause the risks of events or objects to be created by function.
process model represents the optimal process conditions and all deviations are unfavourable.
A Bayesian network is an acyclic directed graph. Every node of this graph corresponds to a random variable and the directed arcs represent statistical dependencies between random variables. In the further explanations, random variables are denoted by uppercase letters, whereas their states are denoted by lowercase letters. The state 𝑒
!
represents the reference state of a binary random variable E while the state 𝑒 !
represents its risk event. The distribution of each random variable E of the Bayesian network is specified by a probability distribution 𝑝 𝐸 𝑝𝑎 𝐸 , where 𝑝𝑎 𝐸 denotes the parents of E. If a random variable has no parents, its probability distribution is specified for 𝑝𝑎 𝐸 = . The Bayesian network represents the joint probability distribution of all random variables E, which can be computed by multiplying all given probabilities
𝑝 𝐸 𝑝𝑎 𝐸 (Pearl 2009, pp. 13-‐15).
A causal Bayesian network is a Bayesian network in which the directed arcs represent direct causal relations between the directly connected random variables. Thus, two random variables C and E are connected directly by an arc directed from C to E if and only if C is a direct cause of E. A Bayesian network, which is solely based on causal relations, represents the joint probability distribution of the random variables by a minimum set of arcs and thus by a minimum number of conditional probabilities to be specified. In addition, an estimation of the probabilities is more convenient for the domain experts than for non-‐causal relationships because of their interpretation as probabilities of risk effects. Moreover, the dependency relationships, provided they are of causal nature, can be exploited to assess the effects of risk mitigation measures (Kjærulff and Madsen 2013, pp. 24-‐25, p. 31; Nadkarni and Shenoy 2001 p. 486; Nadkarni and Shenoy 2004 p. 260; Pearl 2009, p. 21-‐25).
3. Mapping the Process Model onto a Bayesian network
3.1 Mapping the Process Elements onto Random Variables
The events, functions, and objects of a process model are represented by random variables E. Their first state 𝑒
! =𝑦𝑒𝑠 indicates that the variable is in its reference state,
the second state 𝑒
! =𝑛𝑜 represents all undesirable deviations from the reference state.
If an event, a function, or an object can be in k different states, which are not equally desirable, this situation is represented by k reference states 𝑒
!,…,𝑒!. Likewise, risks can
be represented by l different states 𝑒!!
!,…,𝑒!!!, should it be necessary for risk analysis
purposes to differentiate the possible deviations by type or size. To keep further explanations simple, it is assumed, that each event, function, and object can be represented by two states only, one reference state and one risk state. In order to achieve an isomorphic Bayesian Process Network, operators are also mapped onto random variables.
Those operators that merge the control flow are mapped onto binary random variables
E with reference state 𝑒
! = 𝑦𝑒𝑠 indicating that the operator has successfully merged the
control flows together, and risk state 𝑒
! =𝑛𝑜 indicating that merging the control flows
responsibilities into the Bayesian Process Network. The transformation of operators that distribute the control flow requires a differentiated approach. The only reference state of an AND operator E indicates a distribution of the control flow to all subsequent events or functions. Therefore AND operators are mapped onto binary random variables with the state 𝑒
! = 𝑦𝑒𝑠 representing the reference state and and the risk state 𝑒! = 𝑛𝑜
representing that the distribution of the control flow failed. Distributing XOR and OR variables have n and 2!−1 possible distributions of the control flow on n subsequent events, respectively. These distributions are represented by the states 𝑒
!,…,𝑒! and the
states 𝑒
!,…,𝑒!!!!, respectively. In case the preceding process element is in its risk state,
it is assumed that the designated distribution can fail. In order to integrate these kinds of operator risks, risk states 𝑒!!
! and 𝑒!! are added to the XOR and OR variables,
respectively.
It follows from the transformation of operators that a conditional probability of each event that succeeds a distributing XOR or OR variable has to be specified for each of the
𝑒! and 𝑒
!! reference states, respectively. Thus, the probability of an event must also be
specified under the condition that the preceding XOR or OR variable has established a distribution of the control flow not having considered this event. Under this condition, neither the reference nor the risk state of the event is to occur, which means that all probabilities have to be 0. As an axiom of probability theory requires the sum of the probabilities of all occurrences of a random variable to equal 1, this would cause a problem. In order to get around this problem, it is suggested to adhere to an approach to modelling impossible paths within Bayesian networks presented by Fenton and Neil (2013, pp. 190-‐192). If an artificial state NA is added to the event variable, which gets assigned a probability of 1 under the condition of the previous XOR or OR variable distributing the control flow to other events, a probability of 0 to both the reference state and the risk state can be assigned without violating the above-‐mentioned axiom of probability theory. As a consequence of this solution, a state NA has to be attached to all variables that are successors of the XOR and OR variable and which assigned a probability of 1 if one of its parents is in state NA.
3.2 Mapping Causal Mechanisms to Conditional Probabilities
Because of the above-‐mentioned desirable properties of a causal Bayesian network, the Bayesian Process Network has to be constructed on the basis of causal relations between random variables. According to Pearl (2009, p. 43), a causal structure of variables V is ‘a directed acyclic graph (DAG) in which each node corresponds to a distinct element of V, and each link represents a direct functional relationship between the corresponding variables’. The graphical process model of event-‐driven process chains will provide the causal structure for the Bayesian Process Network if the following requirements are met.
As a Bayesian network has no cycles, feedback loops within the process flow cannot be mapped to a properly structured Bayesian network. Possible solutions are provided by mapping the process loops onto sequential sub-‐processes or by aggregating the loops into a single process function (Nadkarni and Shenoy 2001, p. 488).
avoided. The random variables which are representing the properties of an object consumed is linked by an arc directed to the function while a random variable representing the properties of a object generated is connected to the function by an arc directed to the object variable. An example can be found in Scheer (2002, p. 31) for the object ‘environmental data’, which is modified by the function and thus consumed as well as generated. In case objects of the process model (such as the responsible organisational units or resources consumed) are connected by undirected edges, these have to be replaced by arcs directed to the function variable. After applying these adjustments, the graphic structure of the process model can be regarded as the causal structure of the Bayesian Process Network. The causal mechanism between a random variable E and its direct causes 𝑝𝑎 𝐸 = 𝐶!,…,𝐶! can be specified by the conditional
probabilities 𝑝 𝐸 𝐶!,…,𝐶!
as explained below.
A random variable E, representing a function, a generated event, or a produced object, is assumed to be in the reference state 𝑒
! if and only if any of its causes 𝐶 !
is in the reference state. If at least one cause is in its risk state and all other causes are assuming their reference states, then E also assumes its risk state. This corresponds to the assumption that functions represent production functions with factors as perfect complements. Substitutional relationships can be easily specified by probabilities
𝑝 𝐸 =𝑒
! 𝐶!,…,𝐶 !
>0 if one or more 𝐶! are assuming their risk states and all other 𝐶!
(𝑗 ≠𝑖) are in their reference states. Provided at least one of the causes is in the state NA,
E also assumes the state NA. An event following a distributing OR or XOR variable will assume its reference state only if the OR or the XOR variable assigns the control flow to the respective event. In cases that the distributing OR or XOR variable interrupts the control flow, which means being itself in its risk state, every subsequent event assumes its risk state as well. If the distributing variable interrupts the control flow or is in state NA, the subsequent functions or events assume state NA, likewise.
Random variables E representing distributing operators have a single cause C, whose state determines whether the control flow is directed to the following random variables or interrupted. Forwarding will take place if C is in the reference state while an interruption occurs if C is in its risk state. For a distributing XOR and OR variable there are n and 2!
−1 options to distribute the control flow to the subsequent process elements, respectively. The probabilities assigned to the options of a XOR or OR variable have to meet the conditions 𝑝 𝐸 = 𝑒
! 𝐶= 𝑐! +,…,+ 𝑝 𝐸 = 𝑒! 𝐶= 𝑐! =1 or
𝑝 𝐸 =𝑒
! 𝐶= 𝑐! +,…,+ 𝑝 𝐸 = 𝑒!!!! 𝐶 =𝑐! = 1, respectively. An interruption of the
control flow is distributed to the subsequent process elements likewise. The n and
2!−1 options to distributing an interruption of the control flow to the following process elements are represented by the states 𝑒!!
!, ..., 𝑒!! and 𝑒!!, ..., 𝑒!⋅(!!!!),
respectively. Since the subsequent process elements are affected by an interruption of the control flow to the extent the control flow would have been otherwise distributed to them, the same probabilities will be applied to the mechanism of distributing control flow interruptions. For the concerning probabilities it holds 𝐸 =𝑒!!
! 𝐶 =𝑐! =
𝑝 𝐸 =𝑒
! 𝐶= 𝑐! ,…,𝑝 𝐸= 𝑒!! 𝐶= 𝑐! = 𝑝 𝐸 = 𝑒! 𝐶= 𝑐! and 𝑝 𝐸 =𝑒!! 𝐶 =𝑐! = 𝑝 𝐸 =𝑒
! 𝐶= 𝑐! ,…,𝑝 𝐸 = 𝑒!⋅(!!!!) 𝐶 =𝑐! = 𝑝 𝐸= 𝑒!!!! 𝐶 =𝑐! , respectively.
Since for a distributing AND variable E there is only one option to distribute the control flow to the subsequent process elements, its mechanism of action, assuming 𝑐
! is
representing the reference state and 𝑐
! is representing the risk state of C, can be
specified by 𝑝 𝐸 =𝑒
! 𝐶 =𝑐! = 1, 𝑝 𝐸 =𝑒! 𝐶 =𝑐! =0, 𝑝 𝐸 =𝑒! 𝐶 =𝑐! = 0 and 𝑝 𝐸 =𝑒
in state NA. The idea of specifying probabilities of XOR distributions within the EPC process model was already indicated by Scheer (1995, pp. 52-‐53).
For a merging operator variable, the conditional probabilities depend on the type of operator. For a random variable E representing a merging XOR operator, we have
𝑝 𝐸 =𝑒
! 𝐶!,…,𝐶 !
=1 if there is exactly one 𝐶! in its reference state and all other 𝐶! 𝑗 ≠ 𝑖 are in state NA. The XOR variable will assume its risk state 𝐸 =𝑒
! if 𝐶
!
=𝑐
! !
holds
for at least one cause 𝐶!. The condition NA, i.e. the state 𝑒!, will be assumed if all causes
are in the state NA or more than one cause is in the reference state. For a random variable E representing a merging OR-‐Operator, we have 𝑝 𝐸 = 𝑒
! 𝐶!,…,𝐶
!
= 1 if at least one and less than n causes assume their reference state and all other causes are in the state NA. It assumes its risk state 𝐸 = 𝑒
! if at least one of the causes 𝐶
!
is in the risk state 𝐶! =𝑐
! !
and all other causes are either in the reference state or in the NA state. The state 𝑒!= NA will be assumed if all the causes are in state NA or in the reference state. A
merging AND variable E will assume its reference state if all its direct causes 𝐶!,…,𝐶!
assume their reference states as well, i.e. for binary variables E we have 𝑝 𝐸= 𝑒
! 𝐶!,…,𝐶
!
=1 for 𝐶! =𝑐
!!,…,𝐶
! =𝑐
! !
and 𝑝 𝐸= 𝑒
! 𝐶!,…,𝐶 !
=0 otherwise. For E
being in the risk state 𝑒
! it holds 𝑝 𝐸 = 𝑒! 𝐶!,…,𝐶 !
=1, if at least one of the causes 𝐶!
are in the risk state 𝑐 !
!
and all other 𝐶! (𝑗 ≠𝑖 ) are in the reference state 𝑐
!
!
. Provided at least one of the causes is in state NA, the AND-‐Variable will assume the state NA as well.
After the structure of the Bayesian process network has been established and discussed, it will be demonstrated how the model can be used for a systemic analysis of process risks.
4. Process Risk Analysis by Means of a Bayesian Process Network
4.1 Integration of Process Risks
According to the risk definition suggested in section 2, a process risk is a possible but undesirable deviation of events, functions, or objects from their reference states. In a BPN the reference state as well as possible deviations are represented by states of random variables. If all the elements of the process model and the relations amongst them are mapped onto the Bayesian Process Network according to the procedure explained above, all process risks must be caused by unavailability of objects or events generated outside the process (exogenous objects and events). An object or an event is assumed to be unavailable if at least one of its necessary properties is not present (see similar Betz et al. 2011, p. 352).
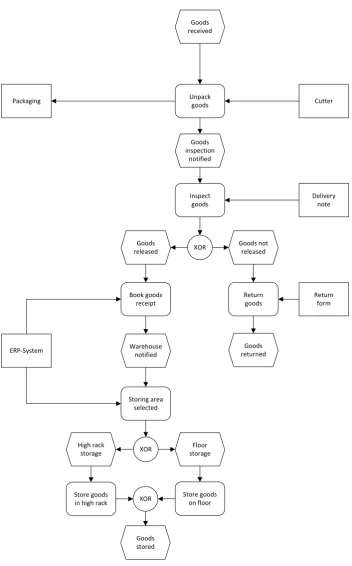
Figure 1 depicts an event-‐driven process chain of a goods inwards process, which has been mapped onto a Bayesian Process Network. It serves as an example to our following discussions.
Figure 1 EPC model of a goods receiving process
If the occurrence of the start event ‘Goods received’ and the availability of the exogenous objects ‘Cutter’, ‘Delivery note’, ‘Return form’ and ‘ERP system’ can be deemed certain, the BPN represents a risk-‐free process. Assuming a rate of 90% for incoming goods released after inspection and a rate of 60% for high rack storing, the probabilities of all
Goods received
Goods inspection
notified Unpack goods
Inspect goods
XOR Goods
released
Goods not released
Book goods receipt
Return goods
Warehouse notified
Goods returned
Storing area selected
Cutter
XOR High rack
storage
Floor storage
Store goods in high rack
Store goods on floor XOR
Goods stored
Delivery note
Return form
[image:10.595.71.424.119.686.2]random variables of the BPN can be computed. The probability values of reference states (𝑒
!), risk states (𝑒!), and NA states (𝑒!) of all events, objects, and functions are
presented in the column denoted by ‘Risk-‐free Process’ of Table 1. With the given assumptions about the causal mechanisms, it is obvious that the probabilities of the risk states of each process element must equal zero.
In the second step, the probabilities of non-‐occurrence of the start event ‘Goods received’ (𝐸!) as well as probabilities of unavailability of the objects Cutter (𝐸!), Delivery note (𝐸!), Return form (𝐸!), and ERP system (𝐸!") are estimated. In case an immediate estimate of probabilities by domain experts is deemed impossible or inconvenient, the BPN can be extended by additional random variables representing possible causes for non-‐occurrence of the start event or causes for non-‐availability of the resources. As such, these random variables can be perceived as risk factors for the respective risks. It is assumed that it might be easier for domain experts to assess the probabilities of risk states under specific conditions of the risk factors than to give an immediate estimate of an unconditional probability, which can actually be regarded as a weighted average of the conditional probabilities. Table 1 shows the assumed probability estimates for the risk states (𝑒
!) of random variables 1, 2, 6, 9, and 13 in the
column denoted by ‘Process with risks’.
Table 1 Probabilities of process element states with/without process risks
No. Random variable Risk-‐free process Process with risks 𝑒
! 𝑒! 𝑒! 𝑒! 𝑒! 𝑒!
1 Goods received 1,000 0,000 0,998 0,002 2 Cutter 1,000 0,000 0,970 0,030 3 Unpack goods 1,000 0,000 0,968 0,032 4 Packaging 1,000 0,000 0,968 0,032 5 Goods inspection notified 1,000 0,000 0,968 0,032 6 Delivery note 1,000 0,000 0.980 0,020 7 Inspect goods 1,000 0,000 0,949 0,051 8 Goods are not released 0,100 0,000 0,900 0,095 0,005 0,900 9 Return form 1,000 0,000 0,970 0,030 10 Return goods 0,100 0,000 0,092 0,008 0,900 11 Goods are returned 0,100 0,000 0,900 0,092 0,008 0,900 12 Goods are released 0,900 0,000 0,100 0,854 0,046 0,100 13 ERP system 1,000 0,000 0,980 0,020 14 Book goods receipt 0,900 0,000 0,100 0,837 0,063 0,100 15 Warehouse notified 0,900 0,000 0,100 0,837 0,063 0,100 16 Storing area selected 0,900 0,000 0,100 0,837 0,063 0,100 17 High rack storage 0,540 0,000 0,460 0,502 0,038 0,460 18 Store goods in high rack 0,540 0,000 0,460 0,502 0,038 0,460 20 Floor storage 0,360 0,000 0,640 0,335 0,025 0,640 19 Store goods on floor 0,360 0,000 0,640 0,335 0,025 0,640 21 Goods are stored 0,900 0,000 0,100 0,837 0,063 0,100
The direct and indirect risk impacts on the process are reflected by the calculated probabilities for risk conditions (𝑒
!) of the other process elements, which are reported
likewise in the column ‘Process with Risks’. Thus, risk probabilities of process events, functions, or objects can be obtained on the rationale of the Bayesian Process Network, which otherwise needing to be elicited from domain experts as non-‐transparent and potentially inconsistent estimates. It is hard to believe that without a process risk model, an expert could immediately estimate the failure of the ‘Inspect Goods’ function (state 𝑒
!
of random variable 7) or the probability of the risk that ordered goods are unavailable (state 𝑒
! of random variable 21).
4.2 Systemic Analysis of Process Risks
In order to fully capitalise on process risk analysis, a suitable process risk model has to answer the questions ‘What are the effects of a set of process risk causes?’ and ‘What are the causes of a set of process risk effects?’. As a Bayesian process network represents the joint probability of all random variables enclosed, these pertinent questions of process risk analysis can easily be answered by computing suitable a posteriori probabilities.
An initial cause and effect analysis was already conducted within the phase of constructing the Bayesian Process Network in order to determine the direct cause-‐effect mechanisms between the random variables. If one were to ask about the impact of a set of states of potential causes 𝐶!,…,𝐶! on a risk effect variable 𝐸!, the indirect cause and
effect mechanisms can be revealed by computing a posteriori probabilities
𝑝 𝐸! 𝐶!,…, 𝐶! . Getting these kinds of questions answered is particularly pertinent in
order to assess the presumed effect of risk mitigation measures that aim at changing the states of the 𝐶!,…,𝐶!
. Likewise, the a posteriori probabilities 𝑝 𝐶! 𝐸!,…,𝐸!
can elucidate the most likely causes 𝐶! of unfavourable process situations given by the
evidence of some process elements 𝐸!,…,𝐸!. In what follows, both approaches to analysing process risks by means of the BPN will be discussed using the ‘Receiving Goods’ process as an example.
It is assumed that process management is asking the question of how an entirely mitigated risk of failing deliveries affected the ordered goods availability in the warehouse. The risk state 𝐶! = 𝑐
!
! of the random variable ‘Goods received’ and the
reference state 𝐸!" =𝑒
!!" of the random variable ‘Goods are stored’ will be used as
suitable indicators to compare the failure of delivery and the availability of ordered goods in the warehouse before and after applying the risk mitigation measure. The effect of an entirely mitigated risk of failing deliveries on the availability of ordered goods in the warehouse is given by the a posteriori probability of 𝑝 𝐸!" =𝑒
!! 𝐶! = 𝑐!! = 0.838
compared to the a priori probability before risk mitigation of 𝑝 𝐸!"= 𝑒
!!" = 0.837 (see
Table 1). At the request of process management, mitigation actions that ensure a 100% availability of the ERP system are supposed to be assessed as alternative risk mitigation measures. By computing an a posteriori probability of 𝑝 𝐸!"= 𝑒
!! 𝐶 !"
= 𝑐
!! = 0.854 it
turns out that the measure is superior in terms of effectiveness.
question can be answered by calculating the a posteriori probabilities of a set of potential causes 𝐶! being in their risk states under the condition of ordered goods not
being stored in the warehouse. This condition is equal to saying that the storage should be executed but failed 𝐸!"= 𝑒
!!" or that the goods had to be returned, meaning the
random variable 𝐸!" assumes the state NA 𝐸!" =𝑒!!" . Possible exogenous causes of
this risk are represented by the random variables 1, 2, 6 and 13 of the BPN, for which the probabilities of causing the unavailability of ordered goods are
𝑝 𝐶! = 𝑐 !
! 𝐸!" =𝑒
!!" ∨ 𝐸!" =𝑒!!" = 1,2% 𝑝 𝐶! =𝑐
!! 𝐸!"= 𝑒!!" ∨ 𝐸!"= 𝑒!!" = 18,4%
𝑝 𝐶! =𝑐
! !
𝐸!"= 𝑒
!!" ∨ 𝐸!"= 𝑒!!" = 12,3% 𝑝 𝐶!"
=𝑐 ! !"
𝐸!" =𝑒
!!" ∨ 𝐸!"= 𝑒!!" = 12,3%
Thus, it turns out that the unavailability of the resource ‘Cutter’ must be regarded as the most likely cause of this risk.
5. Conclusions and Future Research
In this paper an approach is presented to mapping a process model of the event-‐driven process chain onto an isomorphic Bayesian network, which was denoted as Bayesian Process Network. A process risk was defined as a possible deviation of a process event, function, object, or operator from their reference states. It was suggested to map process events, functions, objects, and operators onto random variables that represent their reference as well as their possible risk states. As the links of the process model could be considered to be causal relations, the structure of the process model could be mapped onto an isomorphic structure of the Bayesian Process Network. Assumptions for the probabilities of the conditioned random variables were made in order to specify the direct cause and effect mechanisms. Using a process example, the capability of the Bayesian Process Network to support systemic process risk analysis was demonstrated.
Further research opportunities can be considered in applying the approach to more complex process structures. The application of more sophisticated causal relationships than those assumed in this paper and the integration of financial or non-‐financial process performance and risk indicators into the model could be other promising domains for a further development of the Bayesian Process Network.
References
DIN Deutsches Institut für Normung e. V. (2015a) Quality management systems – Fundamentals and vocabulary (ISO 9000:2015); German and English version EN ISO 9000:2015, Berlin: Beuth.
DIN Deutsches Institut für Normung e. V. (2015b) Quality management systems – Requirements (ISO 9001:2015); German and English version EN ISO 9001:2015, Berlin: Beuth.
Betz, S., Hickl, S. and Oberweis, A. (2011) ‘Risk-‐Aware Business Process Modeling and Simulation Using XML Nets’, in: 2011 IEEE 13th Conference on Commerce and Enterprise Computing (CEC), Luxembourg-‐Kirchberg, Luxembourg, pp. 349–356.
Cope, E. W., Kuster, J. M., Etzweiler, D., Deleris, L. A. and Ray, B. (2010a) ‘Incorporating risk into business process models’, in: IBM Journal of Research & Development Vol. 54, No 3, 4:1-‐4:13.
Cope, E. W., Deleris, L., Etzweiler, D., Koehler, J. and Kuester, J. M.; Ray, B. K. (2010b)
System and method for creating and expressing risk-‐extended business process models. US Patent No US2010/0179847A1.
Fenton, N. E. and Neil, M. D. (2013) Risk assessment and decision analysis with Bayesian networks, Boca Raton, Fla.: CRC Press/Chapman & Hall.
Keller, G., Nüttgens, M. and Scheer, A. -‐W. (1992) ‘Semantische Prozessmodellierung auf der Grundlage ereignisgesteuerter Prozessketten (EPK)’, in: Veröffentlichungen des Instituts für Wirtschaftsinformatik (IWi). Institut für Wirtschaftsinformatik im Institut für Empirische Wirtschaftsforschung an der Universität des Saarlandes.
Kjærulff, U. B. and Madsen, A. L. (2013) Bayesian Networks and Influence Diagrams: A Guide to Construction and Analysis, 2nd ed., New York: Springer.
Nadkarni, S. and Shenoy, P. P. (2001) ‘A Bayesian network approach to making inferences in causal maps’, European Journal of Operational Research, Vol. 12, No. 3, pp. 479–498.
Nadkarni, S. and Shenoy, P. P. (2004) ‘A causal mapping approach to constructing Bayesian networks’, Decision Support Systems, Vol. 38, No. 2, pp. 259–281.
Pearl, Judea (2009) Causality: Models, reasoning, and inference, 9th ed., Cambridge: Univ.
Press.
Rosemann, M. and Zur Muehlen, M. (2005) ‘Integrating Risks in Business Process Models’, in: Proceedings of the 16th Australasian Conference on Information Systems (ACIS 2005), Sydney.
Scheer, A.-‐W. (1995) Wirtschaftsinformatik. Referenzmodelle für industrielle Geschäftsprozesse, 6th ed., Berlin, Heidelberg: Springer Berlin Heidelberg.
Scheer, A.-‐W. (1998) ARIS -‐ Modellierungsmethoden, Metamodelle, Anwendungen, 3rd ed.,
Berlin, Heidelberg: Springer Berlin Heidelberg.
Scheer, A.-‐W. (2002) ARIS -‐ vom Geschäftsprozess zum Anwendungssystem, 4th ed., Berlin:
Springer.
Schlenoff, C., Knutilla, A. and Ray, St. (1996) Unified process specification language: Requirements for modeling process, US Interagency Report 5910.
Suriadi, S., Weiss, B., Winkelmann, A., ter Hofstede, A.H.M., Adams, M., Conforti, R. et al. (2014) ‘Current research in risk-‐aware business process management: overview, comparison, and gap analysis’, Communications of the Association for Information Systems Vol. 34, No. 1, S. 933–984.