Munich Personal RePEc Archive
Culture, Diffusion, and Economic
Development: The Problem of
Observational Equivalence
Harutyunyan, Ani and Özak, Ömer
July 2016
Online at
https://mpra.ub.uni-muenchen.de/80228/
Culture, Diffusion, and Economic Development:
The Problem of Observational Equivalence
Ani Harutyunyan∗and ¨Omer ¨Ozak†
July 1, 2017
Abstract
This research explores the direct and barrier effects of culture on economic development. It shows both theoretically and empirically that whenever the technological frontier is at the top or bottom of the world distribution of a cultural value, there exists an observational equivalence between absolute cultural distances and cultural distances relative to the frontier, preventing the identification of its direct and barrier effects. Since the technological frontier usually has the “right” cultural values for development, it tends to be in the extremes of the distribution of cultural traits, generating observational equivalence and confounding the analysis. These results highlight the difficulty of disentangling the direct and barrier effects of culture. The empirical analysis finds suggestive evidence for direct effects of individualism and conformity with hierarchy, and barrier effects of hedonism.
Keywords: Comparative economic development, cultural differences, barriers to technological diffu-sion, individualism, power distance, vertical hierarchy, hedonism, linguistic distance
JEL Classification: O10, O20, O33, O40, O57, Z10
∗LICOS - Centre for Institutions and Economic Performance at KU Leuven, Belgium. E-mail:
†Corresponding author. Department of Economics, Southern Methodist University, Box 0496, Dallas TX 75275-0496.
1
Introduction
Economists have been studying the effects of culture on economic development at least since Weber (1930) proposed his famous “protestant ethic” thesis, which posited that protestantism was conducive to capitalist development due to its emphasis on thrift, hard work, and human capital accumulation (Andersen et al., 2013; Becker and Woessmann, 2009). Additional cultural determinants of com-parative development have been suggested in the literature, including differences in levels of trust, cooperation, family ties, individualism, obedience, and attitudes towards work and other individuals (Alesina and Giuliano, 2010, 2014; Giuliano, 2007; Gorodnichenko and Roland, 2016; Guiso et al., 2006, 2009; Knack and Keefer, 1997; Zak and Knack, 2001).
This literature has focused mainly on thedirect effects of culture on development, i.e. how having a certainabsolute level of a cultural trait affects economic development. Thus, for example, analyzing whether being more or less patient affects development through its impact on human and physical capital accumulation (Dohmen et al., 2015; Galor and ¨Ozak, 2016). On the other hand, a more recent strand of the literature has emphasized a potential barrier effect of culture on development, i.e. how
relative levels of a cultural trait affect economic development (Basso and Cuberes, 2016; Guiso et al., 2009; Spolaore and Wacziarg, 2009). In particular, cultural differences relative to the technological frontier, like not sharing its religion or language, might act as cultural barriers to technological diffusion and thus lower economic development (Spolaore and Wacziarg, 2012, 2013).
These two types of effects of culture have been identified largely by exploring the differential effects of absolute and relative cultural distances in pairwise country regressions. In particular, if absolute differences in a cultural trait between countries are significantly associated with absolute differences in development then, it is argued, culture has a direct effect. On the other hand, if differences between countries in a cultural trait relative to the technological frontier are significantly associated with absolute differences in development then, it is argued, culture has a barrier effect. The literature has focused on addressing potential threats to identification like reverse causality and omitted variable bias, but it has failed to recognize the problem of observational equivalence between absolute and relative cultural distances, i.e., conditions when these cultural distances are indistinguishable from each other.
This paper identifies the necessary and sufficient conditions for observational equivalence in a cultural trait to hold. In particular, it establishes that observational equivalence holds in a cultural trait if, and only if, the technological frontier is at the top or at the bottom of the global distribution of this cultural trait. Thus, the problem of observational equivalence is created by the location of the technological frontier in the global distribution of cultural values. Importantly, since the technological frontier usually has the “right” cultural values for development, it tends to be in the extremes of the distribution of cultural traits, hence generating observational equivalence and confounding the analysis. While the perfect multicollinearity behind observational equivalence may not hold perfectly, large correlations between absolute and relative cultural distances may still prevent the correct identification of these effects.
role in the identification, understanding and implications of the direct and barrier effects of culture. In particular, since these effects might generate completely different policy recommendations it seems important to further understand and disentangle these cultural mechanisms. Interestingly, this ob-servational equivalence and the issues it raises have not been previously identified in the literature. Partly, this omission may be due to the use of genetic distances to proxy for cultural differences. For example, Spolaore and Wacziarg (2009) have shown that differences in contemporary income per capita are associated with relative genetic distances to the United States, thus suggesting a barrier effect of culture. A major drawback of this approach is that it does not identify the cultural values behind these associations and, as will be apparent below, it may be confounding the true channel through which culture affects development.
This research advances the understanding of the relation between differences in contemporary in-come per capita levels and cultural differences between countries and their cultural differences relative to the contemporary technological frontier, i.e. the United States. It establishes that absolute differ-ences in levels of individualism and vertical hierarchy across countries are statistically and economically significantly associated with differences in contemporary income per capita.1 On the other hand, lin-guistic distances and differences in hedonism are the only cultural differences relative to the United States that are statistically and economically significantly associated with differences in contemporary income. Moreover, once these cultural traits are accounted for, genetic distances relative to the US cease to be robustly associated with development. In particular, genetic distances are not significant when differences in individualism are accounted for. Thus, suggesting that the use of genetic distances as proxies for cultural differences may hide the observational equivalence problem and misrepresent the true effects of culture.
The rest of the paper is structured as follows. Section 2 studies the problem of observational equivalence in a general theoretical setting and identifies the necessary and sufficient conditions for its presence. Section 3 explores the problem of observational equivalence empirically. Specifically, it introduces the data and presents the main empirical results. Section 4 concludes.
2
Observational Equivalence in Theory
This section shows the problem of observational equivalence in the study of the relation between cultural differences and economic development. In particular, it establishes the necessary and sufficient conditions for observational equivalence to hold.2 Moreover, it shows that whenever observational
equivalence holds, an empirical researcher may draw wrong conclusions about the effect of culture. Assume income per capita in country iin a balanced growth path depends monotonically on two cultural traits, θi ∈ [θ,θ] and¯ σi ∈[σ,σ]. Specifically, assume that income per capita in country¯ i is
1
Individualism has also been linked to the timing of the fertility transition (Basso and Cuberes, 2016).
2
given by
yi =h(θi,|σi−σf|), (1)
where σf is the level of σ in the technological frontier f. Without loss of generality assume that h
is strictly increasing in the first component and strictly decreasing in the second component. These assumptions capture the idea thatθhas only a direct effect on development, whileσonly has a barrier effect on development.
Given a cultural valueθ, letθij denote the absolute cultural distance inθbetween countries iand
j and θR
ij denote their relative cultural distance to the frontier inθ. Thus,
θij =|θi−θj|, θijR=|θif −θjf|. (2)
Similarly, let σij denote the absolute cultural distance inσ between countriesiand j and σijR denote
their relative cultural distance in σ. Thus, one can rewrite income per capita asyi=h(θi, σif), which
highlights the different effects these two cultural traits have. Let N = {1, . . . , Nc} denote the set of
countries.
Definition 2.1. Given a cultural trait c, observational equivalence in cultural traitc holds whenever
cij =cRij for all i, j∈N.3
Theorem 2.2. Observational equivalence in cultural trait c holds if, and only if, the technological
frontier f is at the top or bottom of the distribution of c, i.e., if cf ≤ci for all i∈N or cf ≥ci for all i∈N.
Proof. First, let’s prove that ifcf ≥cifor alli∈N, then observational equivalence holds. In particular,
by definition
cR
ij =|cif −cjf|,
but by assumption
cif =|ci−cf|=−(ci−cf).
Thus,
cRij =|−(ci−cf)−[−(cj−cf)]|=|cj−ci|=cij.
The proof for the case when cf ≤ ci for all i∈N is similar. Thus, if the technological frontier is at
the top or bottom of the distribution of c, then observational equivalence inc holds.
To prove the converse, assume observational equivalence holds and for some pair of countries i, j, ci < cf < cj. Then,
cij =|ci−cj|=−(ci−cj) =cj −ci, cif =|ci−cf|=cf −ci, cjf =|cj−cf|=cj−cf,
3
so that
cRij =||ci−cf| − |cj−cf||=|2cf −(ci+cj)|.
Since observational equivalence holds, it must be that
cij =cj−ci=|2cf −(ci+cj)|.
This implies that if 2cf −(ci+cj)>0, then
cj−ci = 2cf −(ci+cj) ⇐⇒ cj =cf,
which is a contradiction. Similarly, if 2cf −(ci+cj)<0, then
cj −ci = (ci+cj)−2cf ⇐⇒ ci =cf,
which again is a contradiction. Thus, if observational equivalence holds, either cf ≥ci for all i∈ N
orcf ≤ci for all i∈N.
To see the problems caused by observational equivalence, consider first the case when income per capita is only a function of θ, and thus culture only has direct effects on development. In this case, yi =h(θi), so that the income per capita difference between countriesiand j is
yij =|yi−yj|=
h
′(˜θ)
|θi−θj|+ηij = h
′(˜θ)
θij +ηij (3)
for some ˜θ ∈ [θ,θ], where¯ ηij is the residual in the expansion. This suggests that the structural
equation for this case should be of the form
yij =α+βθθij +ǫij. (4)
But, if observational equivalence in θ holds, then θij =θRij and a researcher who does not know the
true model of the economy may erroneously estimate the following model
yij =α+βθRθijR+ǫij. (5)
While in this case the estimate of βR
θ would be a good estimate of the true structural parameter βθ,
its interpretation, and any policy recommendation based on it, would be wrong, since they would be based on the assumption of a barrier effect of culture. Moreover, notice that the researcher cannot identify the true effect by estimating
yij =α+βθθij+βθRθRij+ǫij, (6)
since θij and θRij are perfectly correlated. Thus, only βθ+βθR is identified, but the individual values
thenyi =h(σif) and
|yi−yj|=
h′(˜σ)
σRij +ηijR (7)
for some ˜σ∈[σ,σ], where¯ ηijRis the residual in the expansion. This would suggest a structural equation of the form
yij =α+βσRσijR+ǫij. (8)
Again, if observational equivalence inσ holds, thenσR
ij =σij and a researcher who does not know the
true model of the economy may erroneously estimate the following model
yij =α+βσσij+ǫij. (9)
As before, the estimate of βσ would be a good estimate of the true structural parameter βσR, but
its interpretation, and any policy recommendation based on it, would be wrong, since they would be based on the assumption of a direct effect of culture. Moreover, as before, the true effect cannot be identified by estimating
yij =α+βσσij +βσRσijR+ǫij, (10)
since σij and σijR are perfectly correlated. Thus, only βσ +βσR is identified, but the individual values
are not. Clearly, in the general case, when culture has both direct and barrier effects the structural equation would be of the form
yij =α+βθθij+βσRσijR+ǫij. (11)
If observational equivalence in both θ andσ hold, then a researcher may erroneously estimate any of the following equations
yij =α+βθθij +βσσij +ǫij, yij =α+βθRθRij+βσσij+ǫij, yij =α+βθRθijR+βσRσijR+ǫij. (12)
As before, the estimated coefficients would provide correct estimates of the underlying parameters, but their interpretation would be wrong. Moreover, including both the absolute and relative distances cannot help identify the individual parameters.
Note that given a set of Nc countries, where a share λc ∈ [0,1] has a value of the cultural trait
ci ≥cf, then observational equivalence in cholds for a share
ωc=
h
λ2
c+ (1−λc)2
i
Nc−1
Nc−1
(13)
of the sample of all country pairs. Clearly,ωc≥(Nc−2)(2Nc−2)≈0.5 for largeNc, which suggests
observational equivalence may be affecting the estimation and interpretation of results even in cases where observational equivalence does not hold for the full sample. Moreover, the closer λc is to 0
multicollinearity in the analysis.
3
Observational Equivalence in Praxis
This section explores empirically the relation between absolute and relative cultural distances and identifies the cases of observational equivalence, when the direct and barrier effect of culture are indistinguishable. Whenever there is no observational equivalence, it attempts to disentangle the direct effect and barrier effects of culture on development.
The research analyzes the effect of culture using six Cultural Dimensions from Hofstede et al. (2010): (i) Power Distance (PDI), which measures the extent to which the less powerful members of society accept and expect power to be unequally distributed; (ii) Individualism vs. Collectivism (IDV), which measures the degree to which individuals are expected to fend for themselves; (iii) Competition vs. Cooperation (CVC), which refers to levels of cooperation and competition among members of society; (iv) Uncertainty Avoidance (UAI), which measures the extent to which members of a culture feel threatened by ambiguous and unknown situations; (v) Long-Term Orientation (LTO), which measures the extent to which a culture fosters virtues oriented towards future rewards, in particular perseverance and thrift; (vi) Indulgence vs. Restraint (IVR), which measures the extent to which a culture allows enjoying life and having fun through free gratification of human drives or suppresses them through strict social norms.4
For each cultural dimension two distance measures are constructed for each country pair. In particular, given a cultural traitθ, theabsolute pairwise distancebetween countriesiandj,θij, is given
byθij =|θi−θj|, and therelative pairwise distanceto the contemporary technological frontier between
countries i and j, θR
ij, is given by θRij = |θiU S−θjU S|, where it is assumed that the contemporary
technological frontier is the US, and θiU S is the absolute distance between country iand the US.
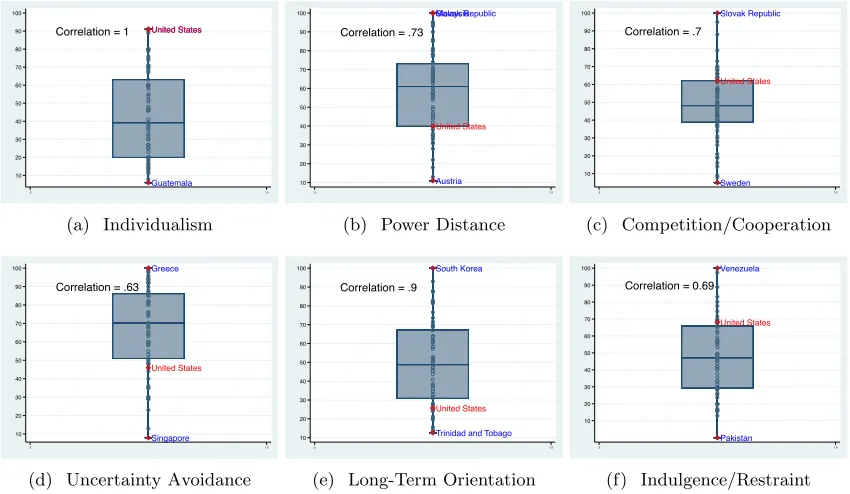
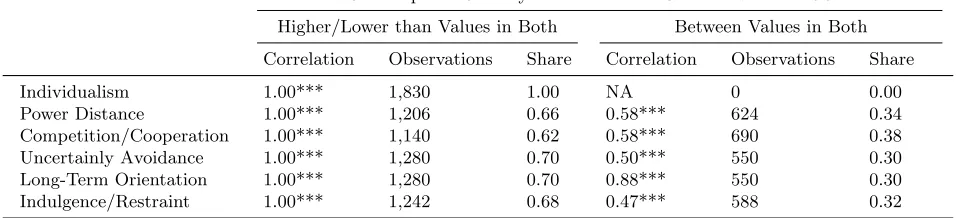
Figure 1 depicts the distribution of the six cultural measures. In particular, each panel shows the distribution of a cultural measure, the location of the US in the distribution, the identity of the countries with the highest and lowest levels of the cultural value, as well as the location of the median and the interquartile range. Additionally, for each cultural value it shows the correlation between the absolute and relative cultural distances between countries in the full sample of country pairs. As shown in section 2, if the technological frontier is at the top or bottom of the distribution, the correlation between absolute and relative cultural distances is 1, as in the case of Individualism. While the case of Individualism is extreme, notice that the US is always outside the interquartile range and the correlation between absolute and relative cultural distances is larger than 0.58, which should be expected since the technological frontier is bound to have “good” cultural values. Thus, as established in Table 1, observational equivalence is present in over 62% of the sample of country pairs. Interestingly, even if the subsample where observational equivalence is present is removed, the correlation between absolute and relative cultural distances remains above 0.47.
The analysis explores the direct and barrier effects of culture on development using a generalization
4
United States
Guatemala United States Correlation = 1
10 20 30 40 50 60 70 80 90 100 .5 1.5 (a) Individualism Malaysia Slovak Republic Austria United States Correlation = .73
10 20 30 40 50 60 70 80 90 100 .5 1.5
(b) Power Distance
Slovak Republic
Sweden United States Correlation = .7
10 20 30 40 50 60 70 80 90 100 .5 1.5 (c) Competition/Cooperation Greece Singapore United States Correlation = .63
10 20 30 40 50 60 70 80 90 100 .5 1.5
(d) Uncertainty Avoidance
South Korea
Trinidad and Tobago United States
Correlation = .9
10 20 30 40 50 60 70 80 90 100 .5 1.5
(e) Long-Term Orientation
Venezuela
Pakistan
United States Correlation = 0.69
[image:9.612.94.519.69.316.2]10 20 30 40 50 60 70 80 90 100 .5 1.5 (f) Indulgence/Restraint
Figure 1: Location of U.S. in the Distribution of Hofstede Dimensions
of the empirical specification in Spolaore and Wacziarg (2009), which includes absolute and relative cultural differences, namely
yij =α+βθθij +βθRθijR+βGGDij +βRGGDijR+βLLDij +βRLLDijR+βRRDij +βRRRDRij (14)
+X
k
γkXijk +ci+cj+ǫij,
where the dependent variable, yij, is the absolute value of the pairwise difference in log income per
capita in 1995 between country i and j,θij and θRij are their absolute and relative differences in one
of the cultural values defined above, GDij is their genetic distance, GDRij is their relative genetic
distance to the US, LDij is their linguistic distance, LDijR is their relative linguistic distance, RDij
is their religious distance, RDR
ij is their relative religious distance,
n
Xk ij
o
k is a large set of additional
pairwise controls, including geographic distances and differences in geographic factors (absolute lati-tude, landlocked, island, close to coast or river, terrain ruggedness, agricultural and caloric suitability, climatic zones, etc.), common history (ever same country, ever in colonial relationship, have common colonizer), a complete set of continental fixed effects (whether one, both or none of the countries in the pair belong to a specific continent), ci and cj are country fixed effects, and ǫij is an error term.5
Given that the construction of differences can potentially generate correlation across observations for each country i, the analysis clusters standard errors at two levels, one for each country in the pair (Cameron et al., 2011; Spolaore and Wacziarg, 2009).
5
Table 1: Observational Equivalence in Subsamples
Subsample of Country Pairs for which Cultural Value in US is Higher/Lower than Values in Both Between Values in Both Correlation Observations Share Correlation Observations Share Individualism 1.00*** 1,830 1.00 NA 0 0.00 Power Distance 1.00*** 1,206 0.66 0.58*** 624 0.34 Competition/Cooperation 1.00*** 1,140 0.62 0.58*** 690 0.38 Uncertainly Avoidance 1.00*** 1,280 0.70 0.50*** 550 0.30 Long-Term Orientation 1.00*** 1,280 0.70 0.88*** 550 0.30 Indulgence/Restraint 1.00*** 1,242 0.68 0.47*** 588 0.32
Notes: This table explores the strength of observational equivalence for various cultural traits. It shows the correlation between absolute and relative cultural distances for the subsamples of country pairs for which the cultural value in the US is either higher or lower than the values in both countries in the pair or the value in the US is between the values of the country pair. Observational equivalence holds in the first subsample (by definition), so its share provides a measure of the problem. *** denotes statistical significance at the 1% level, ** at the 5% level, and * at the 10% level, all for two-sided hypothesis tests.
Table 2 explores the partial correlation between differences in economic development, relative genetic distances and cultural distances. Column 1 shows that genetic distance relative to frontier is significantly associated with income differences for the subset of countries for which the cultural values are available. Columns 2-7 account for absolute cultural distances, while columns 9-14 account for relative distances to the US for these cultural values. The results suggest that Individualism and Power Distance have direct effects on economic development, while Individualism and Indulgence vs Restraint have barrier effects on development. Columns 8 and 15 respectively account for all absolute and relative cultural distances jointly with similar results.
The results of columns 2 and 9 establish that once one accounts for differences in Individualism, the genetic distance relative to the US ceases to be associated with differences in economic development. This suggests that genetic distances relative to the US might be capturing the effect of differences in Individualism. This view is supported by Harutyunyan and ¨Ozak (2016), which established the strong association between genetic distances and differences in Individualism. Furthermore, they also show that relative distances in Individualism are the only relative cultural trait that is economically and statistically significantly correlated with relative genetic distances.
While these results suggest that relative genetic distances might be capturing the barrier effect of Individualism, this interpretation is subject to the problem of observational equivalence. In par-ticular, given that the US has the highest value of Individualism (see Figure 1(a)), the absolute and relative distances are observationally equivalent. Indeed, the estimated effect of absolute and relative differences in Individualism is identical in columns 2 and 9. So, although column 9 would suggest a barrier effect of individualism, this might just be capturing its direct effect that has been obscured by observational equivalence. Moreover, in light of this observational equivalence and the findings of Harutyunyan and ¨Ozak (2016), it is possible that relative genetic distances do not capture the barrier effect, but instead the direct effects of culture.
Table 2: Hofstede Cultural Dimensions
Differences in log per capita income (1995)
Direct Effect of Culture Barrier Effect of Culture
(1) (2) (3) (4) (5) (6) (7) (8) (9) (10) (11) (12) (13) (14) (15)
Genetic Distance 0.15** 0.10 0.14** 0.15** 0.14** 0.15** 0.15** 0.11** 0.10 0.14** 0.15** 0.15** 0.15** 0.15** 0.11*
relative to US (0.07) (0.06) (0.06) (0.07) (0.07) (0.07) (0.07) (0.06) (0.06) (0.07) (0.07) (0.07) (0.07) (0.07) (0.06)
Individualism 0.21*** 0.15**
(0.07) (0.07)
Power Distance 0.20*** 0.15**
(0.06) (0.06)
Compet/Cooper -0.07** -0.11***
(0.03) (0.03)
Uncertainty Avoid 0.06 0.04
(0.05) (0.05)
Long-Term Orient -0.06 -0.06
(0.04) (0.05)
Indulgence/Restraint 0.11 0.10
(0.07) (0.06)
Individualism, 0.21*** 0.16**
relative to US (0.07) (0.07)
Power Distance, 0.15** 0.09
relative to US (0.07) (0.07)
Compet/Cooper, -0.03 -0.06**
relative to US (0.03) (0.03)
Uncertainty Avoid, -0.00 -0.02
relative to US (0.03) (0.03)
Long-Term Orient, -0.06* -0.07*
relative to US (0.03) (0.04)
Indulg/Restraint, 0.22*** 0.20***
relative to US (0.07) (0.06)
Adjusted-R2 0.02 0.06 0.06 0.03 0.03 0.03 0.03 0.11 0.06 0.04 0.02 0.02 0.03 0.07 0.12
Observations 1830 1830 1830 1830 1830 1830 1830 1830 1830 1830 1830 1830 1830 1830 1830
Notes: This table shows correlation between absolute log-differences in income per capita in 1995 and absolute and relative cultural distances based on Hofstede et al. (2010) cultural values. Coefficients are standardized betas. Two-way clustered standard errors in parentheses. *** denotes statistical significance at the 1% level, ** at the 5% level, and * at the 10% level, all for two-sided hypothesis tests.
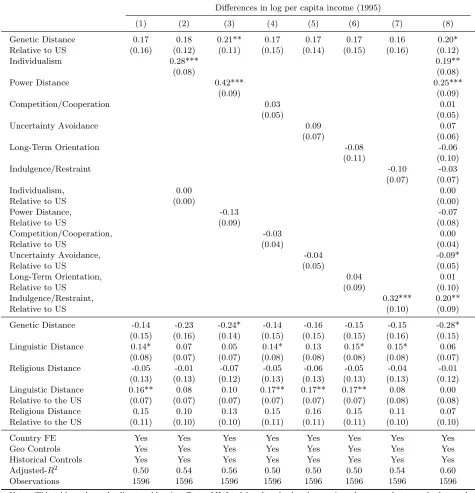
distances. Given the potential bias due to omitted variables, it additionally accounts for geographical differences, pairwise continental fixed effects, other measures of common ancestry, as well as relative linguistic and religious distances, and country fixed effects. Column 2 shows that differences in Indi-vidualism remain strongly associated with differences in economic development. However, since the absolute and relative distances in Individualism are perfectly correlated, the empirical specification does not allow to disentangle the direct and barrier effect of individualism. Indeed, the coefficient on the relative distance in Individualism is 0. Columns 3 and 7 show that the absolute distance in Power Distance and the relative distance in Indulgence vs Restraint are positive economically statistically significantly associated with differences in economic development. These results suggest that Power Distance has a direct effect on economic development, while Indulgence vs Restraint has a barrier effect on development. Finally, Column 8 establishes that similar results hold if the analysis accounts jointly for all cultural differences.
These results suggest that (i) genetic distances relative to the US might be capturing the (direct or barrier) effects of Individualism, (ii) Individualism may have either direct or barrier effects, (iii) Power Distance has significant direct effects, and (iv) Indulgence vs Restraint has significant barrier effects on economic development. While these results suggest the presence of various direct effects, the existence of observational equivalence between absolute and relative distances calls for caution in the interpretation. In particular, although observational equivalence holds only in the case of Individualism, the correlation between absolute and relative distances is high for both Power Distance and Indulgence vs Restraint, increasing the potential for a misidentification of the effects of culture. One potential strategy to address the problem raised by observational equivalence is to analyze the effect of culture only in the subsample where observational equivalence is not present, i.e., by excluding all country pairs for which the cultural value in the US is higher or lower than in both countries in the pair. While this strategy may address the problem of observational equivalence, it may generate other biases due to (non-random) sampling, the exclusion of information, and the reduction in the sample size. Moreover, as Table 1 shows, while this strategy implies the loss of about 2/3 of the sample, it does not eliminate the correlation between absolute and relative cultural distances. In non-reported results, following this strategy the analysis finds further suggestive evidence in favor of a barrier effect of Indulgence vs. Restraint, but finds no significant direct nor barrier effects for any of the other cultural values, suggesting that there may exist significant biases in this subsample.
4
Conclusion
Table 3: Hofstede Cultural Dimensions and Income (All Controls)
Differences in log per capita income (1995)
(1) (2) (3) (4) (5) (6) (7) (8)
Genetic Distance 0.17 0.18 0.21** 0.17 0.17 0.17 0.16 0.20*
Relative to US (0.16) (0.12) (0.11) (0.15) (0.14) (0.15) (0.16) (0.12)
Individualism 0.28*** 0.19**
(0.08) (0.08)
Power Distance 0.42*** 0.25***
(0.09) (0.09)
Competition/Cooperation 0.03 0.01
(0.05) (0.05)
Uncertainty Avoidance 0.09 0.07
(0.07) (0.06)
Long-Term Orientation -0.08 -0.06
(0.11) (0.10)
Indulgence/Restraint -0.10 -0.03
(0.07) (0.07)
Individualism, 0.00 0.00
Relative to US (0.00) (0.00)
Power Distance, -0.13 -0.07
Relative to US (0.09) (0.08)
Competition/Cooperation, -0.03 0.00
Relative to US (0.04) (0.04)
Uncertainty Avoidance, -0.04 -0.09*
Relative to US (0.05) (0.05)
Long-Term Orientation, 0.04 0.01
Relative to US (0.09) (0.10)
Indulgence/Restraint, 0.32*** 0.20**
Relative to US (0.10) (0.09)
Genetic Distance -0.14 -0.23 -0.24* -0.14 -0.16 -0.15 -0.15 -0.28*
(0.15) (0.16) (0.14) (0.15) (0.15) (0.15) (0.16) (0.15)
Linguistic Distance 0.14* 0.07 0.05 0.14* 0.13 0.15* 0.15* 0.06
(0.08) (0.07) (0.07) (0.08) (0.08) (0.08) (0.08) (0.07)
Religious Distance -0.05 -0.01 -0.07 -0.05 -0.06 -0.05 -0.04 -0.01
(0.13) (0.13) (0.12) (0.13) (0.13) (0.13) (0.13) (0.12)
Linguistic Distance 0.16** 0.08 0.10 0.17** 0.17** 0.17** 0.08 0.00
Relative to the US (0.07) (0.07) (0.07) (0.07) (0.07) (0.07) (0.08) (0.08)
Religious Distance 0.15 0.10 0.13 0.15 0.16 0.15 0.11 0.07
Relative to the US (0.11) (0.10) (0.10) (0.11) (0.11) (0.11) (0.10) (0.10)
Country FE Yes Yes Yes Yes Yes Yes Yes Yes
Geo Controls Yes Yes Yes Yes Yes Yes Yes Yes
Historical Controls Yes Yes Yes Yes Yes Yes Yes Yes
Adjusted-R2 0.50 0.54 0.56 0.50 0.50 0.50 0.54 0.60
Observations 1596 1596 1596 1596 1596 1596 1596 1596
Notes: This table explores the direct and barrier effects of Hofstede’s cultural values by running a horse race between absolute and relative cultural distances, including linguistic and religious distances. Coefficients are standardized betas of an Ordinary Least Squares (OLS) regression after accounting for country fixed effects, geographical differences, pairwise continental fixed effects. Two-way clustered standard errors in parentheses. *** denotes statistical significance at the 1% level, ** at the 5% level, and * at the 10% level, all for two-sided hypothesis tests.
for development, it will tend to be in the extremes of the distribution of cultural traits and generate observational equivalence. Thus, these results highlight the difficulty of disentangling the direct and barrier effects of culture.
suggests these effects may be misidentified. In particular, given that the United States is the most individualistic country in the sample, differences in individualism and differences in individualism relative to the US are perfectly correlated. Thus, it is not possible to disentangle the direct and barrier effects in this case as they are observationally equivalent. Moreover, while the case of Individualism is extreme, the correlation between absolute and relative cultural distances is generally high. Also, even when observational equivalence does not hold empirically for the full sample, it does hold for a large subsample of the data.
Since the barrier effect has been studied using relative genetic distances as a proxy for relative cultural distances, the observational equivalence of absolute and relative cultural distances has not been previously identified in the literature. Specifically, since absolute and relative genetic distances are strongly associated with absolute and relative cultural differences (Harutyunyan and ¨Ozak, 2016), the observational equivalence of these cultural channels has remained obscured. Importantly, this observational equivalence plays an essential role in the identification and understanding of the direct and barrier effects of culture. Moreover, since these effects may generate completely different policy recommendations it seems important to further understand and disentangle the cultural mechanisms behind each.
Acknowledgement: We wish to thank an anonymous referee, the editor, Klaus Desmet, Oded Ga-lor, Stelios Michalopoulos, Dan Millimet, Gerard Roland, Assaf Sarid, and David Weil, as well as participants at the 2017 Annual and 2016 European Conferences of the Association for the Study of Religion, Economics, and Culture (ASREC), 15th European Development Network (EUDN) Ph.D. workshop, 3rd PODER/CEPR Summer School and seminar participants at Southern Methodist Uni-versity and KU Leuven. This research did not receive any specific grant from funding agencies in the public, commercial, or not-for-profit sectors.
References
Alesina, A. and Giuliano, P. (2010). The power of the family, Journal of Economic growth15(2): 93–
125.
Alesina, A. and Giuliano, P. (2014). Family ties, Handbook of Economic Growth, Vol. 2, Elsevier, pp. 177–215.
Andersen, T. B., Bentzen, J., Dalgaard, C.-J. and Sharp, P. (2013). Pre-reformation roots of the protestant ethic,Technical report, Competitive Advantage in the Global Economy (CAGE). Basso, A. and Cuberes, D. (2016). Deep-rooted determinants of the fertility transition across countries.,
Macroeconomic Dynamics.
Becker, S. O. and Woessmann, L. (2009). Was weber wrong? a human capital theory of protestant economic history,The Quarterly Journal of Economics124(2): 531–596.
Cameron, A. C., Gelbach, J. B. and Miller, D. L. (2011). Robust inference with multiway clustering,
Journal of Business & Economic Statistics29(2).
Dohmen, T., Enke, B., Falk, A., Huffman, D. and Sunde, U. (2015). Patience and the wealth of nations.
Galor, O. and ¨Ozak, ¨O. (2016). The agricultural origins of time preference, American Economic Review106(10).
Gorodnichenko, Y. and Roland, G. (2016). Culture, institutions and the wealth of nations,Review of Economics and Statistics.
Guiso, L., Sapienza, P. and Zingales, L. (2006). Does culture affect economic outcomes?, Journal of Economic Perspectives20(2): 23–48.
Guiso, L., Sapienza, P. and Zingales, L. (2009). Cultural biases in economic exchange?,The Quarterly Journal of Economics124(3): 1095–1131.
Harutyunyan, A. and ¨Ozak, ¨O. (2016). Culture, diffusion, and economic development, SMU Working Paper.
Hofstede, G. H., Hofstede, G. J. and Minkov, M. (2010). Cultures and organizations: software of the mind : intercultural cooperation and its importance for survival, 3rd ed edn, McGraw-Hill, New York.
Knack, S. and Keefer, P. (1997). Does social capital have an economic payoff? a cross-country investigation,The Quarterly journal of economicspp. 1251–1288.
Spolaore, E. and Wacziarg, R. (2009). The diffusion of development, The Quarterly Journal of Eco-nomics124(2): 469–529.
Spolaore, E. and Wacziarg, R. (2012). Long-term barriers to the international diffusion of innovations,
NBER International Seminar on Macroeconomics, Vol. 8, JSTOR, pp. 11–46.
Spolaore, E. and Wacziarg, R. (2013). How deep are the roots of economic development?, Journal of Economic Literature51(2): 325–369.