FUNCTIONAL GROUP ANALYSIS OF VARIOUS EXTRACTS OF Aerva lanata (L.,) BY FTIR SPECTRUM
P. Ragavendran, D.Sophia, C.Arul Raj, and V.K.Gopalakrishnan*
Department of Biochemistry, Karpagam University, Coimbatore- 641 021, INDIA
Summary
Infra red spectra of various extract (Aqueous, Ethanol and Aqueous ethanol) of medicinal plant Aerva lanata were recorded. The vibrational assignments, intensities and wave number (cm-1) of dominant peak were obtained from absorption spectra. Probable assignments of the bands were made with respect to the components present in various extracts. By these analysis, functional groups such as aminoacids, amides, amines, carboxylic acid, carbonyl compounds, organic hydrocarbons, halogens are present in all the three extracts. By this results indicate that the aqueous, ethanol and aqueous ethanol extract of this plant having high therapeutic value. In future, it is used to treat against various diseases.
Key words : Infra red spectra, Aerva lanata, functional groups, therapeutic value.
Address for Correspondence
Dr. V.K.Gopalakrishnan Professor in Biochemistry Karpagam University Coimbatore – 641 021 India Ph : 091-0422-2611146
Introduction
Plants have been used in traditional medicine for several thousand years. Medicinal plants as a group comprise approximately 8000species and account for about 50% of all the higher flowering plant species in india. The knowledge of medicinal plants has been accumulated in the course of many centuries based on different medicinal systems such as ayurveda, unani and siddha. In a large number of countries human population depends on medicinal plants for treating various illness as well as a source for livehood. The main advantage of using medicinal plants does not produce side effects when compare with synthetic drugs, because medicinal plants contain high content of antioxidant compounds are present high content in plants. It has shown protective effects against diseases without reducing their therapeutic efficacy. The objective of this study was to identify various chemical groups present in various extract of A.lanata. Aerva lanata one of the medicinal plant useful for curing diabetes. It has anthelimintic, demulcent and is helpful in Lithiasis, Cough, Sore throat and Wounds1. The plant has been reported to possess anti inflammatory2 and nephroprotective in rats3.
In this study, to evaluate the functional group analysis of Aerva lanata in different extracts.
Materials and methods Plant collection
Fresh plants parts were collected from Coimbatore, Tamil Nadu, India. The plant was authenticated by Dr. G.V.S Moorthy, Botanical survey of India, TNAU Campus, Coimbatore. The voucher No. BSI/SC/5/23/10-11/Tech/22.Fresh plant material was washed under running tap water, air dried, and then homogenized to fine powder and stored in airtight bottles.
Extraction
100g of dried plant powder was extracted in 500ml of Aqueous, Ethanol and Aqueous ethanol (1:1) for 24 hr in occasional shaker at room temperature. The supernatant was collected and evaporated to make the final volume one-fifth of the original volume. It was stored at 4oC in airtight bottles for further studies.
FTIR spectrum analysis
Aqueous,Ethanol and Aqueous ethanol extract of A.lanata were ground into fine powder by using agate mortar and the FT-IR spectrometer in the region 4000-400cm-1 by employing standard KBr pellet technique.
Results and Discussion
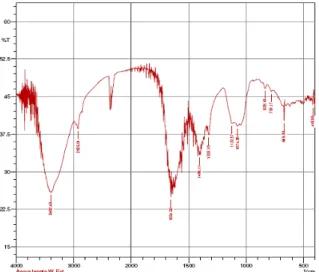
The FT-IR spectra of Aqueous, Ethanol and Aqueous ethanol extract of A.lanata are shown in figure 1,2 and 3.
Fig 1: Aqueous extract of A.lanata
The more intense bands occuring at 2918 cm-1, 2848 cm-1, 2853 cm-1, 1654 cm-1, 1421 cm-1, 1249 cm-1 corresponding to O-H/N-H/C-H,C=O and C-Cl/C-S stretching/bending vibrations respectively indicate the presence of amino acids, alkenes, nitrates, ethers, organic halogen compounds and carbohydrates in A.lanata (L). Brominate compound shows an infra red region 500-750 cm-1 9.
The very strong absorption band observed around 3373 – 3422 cm-1 may be due to the presence of bonded N-H/C-H/O-H stretching of amines and amides4. The very strong absorption at 3402.43 cm-1 in aqueous extract, 3379.29 cm-1 in ethanol extract and 3392.79 cm-1 in aqueous ethanol extract. The very strong absorption band observed in 1600 - 1660 cm-1 region indicate the presence of amino acids. The very strong absorption in 1654 cm-1 in aqueous extract, 1610cm-1 and 1654 cm-1 in ethanol extract, 1618 cm-1 in aqueous ethanol extract. This result give the evidence that all the three extract of A.lanata indicates the high content of protein5.
The observed very strong absorption band between 3200-3400 cm-1 indicates the presence polymeric hydroxyl derivatives. Vibration of NH3 shows the presence of primary amine6. The C-H asymmetrical stretching methylene group near 2926 cm-1. The bands observed at near 2848 cm-1 represent C-H symmetric stretching of methylene groups in aliphatic compounds6,7.
The band occurring 2848 cm-1 in ethanol extract indicates the presence of ether (C-H stretching). This bond does not appear in aqueous and aqueous ethanol extract.
In this presence investigation, all the three extracts containing carbonyl functional groups. In aqueous extract the band appear at 2926 cm-1 (C-H stretching), 1654 cm-1 (C=O stretching), 1325 cm-1 (C-CO-C stretching). In ethanol extract bands are appear at 2918 cm-1 (C-H stretching), 1654, 1718 cm-1 (C=O stretching), 1165, 1249 cm-1 (C-CO-C stretching). In aqueous ethanol extract 2933 cm-1 (C-H stretching), 1122 (C-CO-C stretching). Here there is no absorption band in C=O stretching.
Carboxylic acids are absorbed at the region 2500-3300 cm-1. All the three extracts, ethanol of A.lanata contains high absorbance at 2848 cm-1 , 2918 cm-1 (OH stretching) and 1718 cm-1 (C=O stretching). In aqueous extract, the bands are appearing at 2926 cm-1 and 3402 cm-1 (OH stretching). This is similar to that of Eclipta alba8.
There is no absorbance in between the region 2220-2260 cm-1 indicates that no cyanide groups in all three extracts. By this results exhibit all the three extract of A.lanata does not contain any toxic substances.
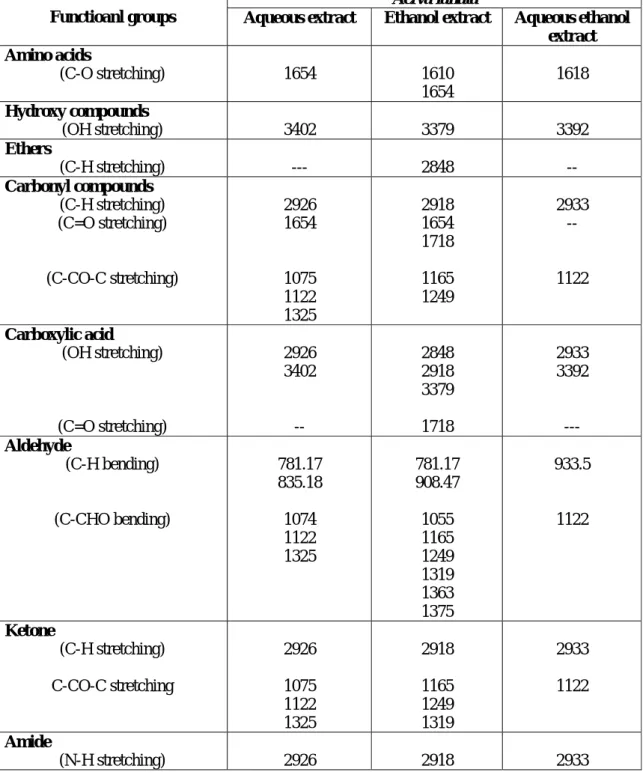
The absorption bands, the wave number (cm-1) of dominant peak obtained from absorption spectra are presented in table 1.
Table 1: Wave number (cm-1) of dominant peak obtained from absorption spectra
Aerva lanata
Functioanl groups Aqueous extract Ethanol extract Aqueous ethanol extract Amino acids (C-O stretching) 1654 1610 1654 1618 Hydroxy compounds (OH stretching) 3402 3379 3392 Ethers (C-H stretching) --- 2848 -- Carbonyl compounds (C-H stretching) (C=O stretching) (C-CO-C stretching) 2926 1654 1075 1122 1325 2918 1654 1718 1165 1249 2933 -- 1122 Carboxylic acid (OH stretching) (C=O stretching) 2926 3402 -- 2848 2918 3379 1718 2933 3392 --- Aldehyde (C-H bending) (C-CHO bending) 781.17 835.18 1074 1122 1325 781.17 908.47 1055 1165 1249 1319 1363 1375 933.5 1122 Ketone (C-H stretching) C-CO-C stretching 2926 1075 1122 2918 1165 1249 2933 1122
Functioanl groups Aqueous extract Ethanol extract Aqueous ethanol extract Halogen compounds Fluoride Chloride Bromide Iodide 1074 1122 1325 418 669 781 669 781 --- 1055 1165 1249 1319 1363 1375 518 669 719 781 518 669 719 781 518.85 1122 410 -- -- --
From table 1, it is seen that the main chemical constituent of Aerva lanata is carboxylic acid, which serve as a main pharmaceutical product in curing ulcers, jaundice, head ache, stomatitis, hemicarnia, fever, pain in liver, wounds in cattle, treatment of edema and rheumatic joint pains. Also all the three extracts are rich in amides and amino acids, the main group of protein synthesis and also it contain polysaccharides, organic halogens and nitrates play thus role of disinfectant.
Conclusion
The presence of characteristic functioanl groups Carboxylic acids, amines, amides, sulphur derivatives, polysaccharides, organic hydrocarbons, halogens are responsible for various medicinal properties of Aerva lanata. So it contain high therapeutic content
Acknowledgement
We, the authors are thankful to our Chancellor, Advisor, Vice Chancellor and Registrar of Karpagam University for providing facilities and encouragement.
References
1. Pullaiah T, Naidu CK. Antidiabetic Plants in India and Herbal Based Antidiabetic Research. Regency Publications, New-Delhi , 2003, 68-69.
2. Vetriselvan T and Jagadeesan M. Anti-diabetic activity of alcoholic extract of Aerva lanata (L.) Juss. ex Schultes in rats, J. Ethnopharmacol. 2002, 80, 103-107.
4. Mohan J, Organic spectroscopy – principle and applications, Nasrosa publishers, New Delhi, 2001.
5. Jones RN and Cleverly B, Chemical application of spectroscopy, Willey Inter Science, New york, 1956.
6. Silverstein RM and Webster FX, Spectrometric identification of organic compounds, John Wiley and sons, New York,1996.
7. Bellamy CNR, Chemical application at infra red spectroscopy, Academic press, New York, 1963.
8. Muruganantham S, Anbalagan G and Ramamoorthy N, FT-IR and SEM-EDS comparative analysis of medicinal plants, Eclipta alba and Eclipta Prostrata, Romanian J Biophysics, 2009, 19,285-294
9. Sandhya B, Thomas S, Isabel W and Shenbugarathai R, Ethnomedical plants used by the valaiyan community at Piranmalai Hills, Tamil nadu, India. A pilot study. Afr. J Trad Comp Alt Med, 2006.3,101-114