Automatically Predicting Sentence Translation Difficulty
Abhijit Mishra∗, Pushpak Bhattacharyya∗, Michael Carl† ∗ Department of Computer Science and Engineering, IIT Bombay, India{abhijitmishra,pb}@cse.iitb.ac.in
†CRITT, IBC, Copenhagen Business School, Denmark,
Abstract
In this paper we introduceTranslation Dif-ficulty Index (TDI), a measure of diffi-culty in text translation. We first de-fine and quantify translation difficulty in terms of TDI. We realize that any mea-sure of TDI based ondirectinput by trans-lators is fraught with subjectivity and ad-hocism. We, rather, rely oncognitive ev-idences from eye tracking. TDI is mea-sured as the sum of fixation (gaze) and saccade (rapid eye movement) times of the eye. We then establish that TDI is correlated with three properties of the in-put sentence, viz. length (L), degree of polysemy (DP)and structural complexity (SC). We train a Support Vector Regres-sion (SVR) system to predict TDIs for new sentences using these features as in-put. The prediction done by our frame-work is well correlated with the empiri-cal gold standard data, which is a repos-itory of< L, DP, SC > andT DI pairs for a set of sentences. The primary use of our work is a way of “binning” sentences (to be translated) in “easy”, “medium” and “hard” categories as per their predicted TDI. This can decide pricing of any trans-lation task, especially useful in a scenario where parallel corpora forMachine Trans-lationare built through translation crowd-sourcing/outsourcing. This can also pro-vide a way of monitoring progress of sec-ond language learners.
1 Introduction
Difficulty in translation stems from the fact that most words are polysemous and sentences can be long and have complex structure. Whilelength of sentence is commonly used as a translation diffi-culty indicator,lexicalandstructuralproperties of
a sentence also contribute to translation difficulty. Consider the following example sentences.
1. The camera-man shot the policeman with a gun. (length-8)
2. I was returning from my old office yesterday. (length-8)
Clearly, sentence 1 is more difficult to process and translate than sentence 2, since it has lexical ambiguity (“Shoot” as an act of firing a shot or taking a photograph?) and structural ambiguity (Shot with a gun or policeman with a gun?). To produce fluent and adequate translations, efforts have to be put to analyze both the lexical and syn-tactic properties of the sentences.
The most recent work on studying translation difficulty is by Campbell and Hale (1999) who identified several areas of difficulty in lexis and grammar. “Reading” researchers have focused on developing readability formulae, since 1970. The Flesch-Kincaid Readability test (Kincaid et al., 1975), the Fry Readability Formula (Fry, 1977) and theDale-Chall readability formula(Chall and Dale, 1999) are popular and influential. These for-mulae use factors such as vocabulary difficulty (or semantic factors) and sentence length (or syntac-tic factors). In a different setting, Malsburg et al. (2012) correlate eye fixations and scanpaths of readers with sentence processing. While these approaches are successful in quantifying readabil-ity, they may not be applicable to translation sce-narios. The reason is that, translation is not merely a reading activity. Translation requires co-ordination between source text comprehension and target text production (Dragsted, 2010). To the best of our knowledge, our work on predicting TDI is the first of its kind.
The motivation of the work is as follows. Cur-rently, for domain specific Machine Translation systems, parallel corpora are gathered through translation crowdsourcing/outsourcing. In such
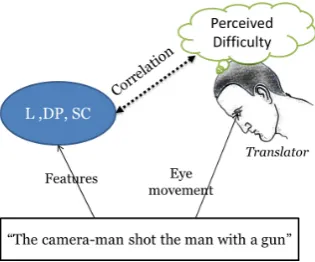
Figure 1: Inherent sentence complexity and per-ceived difficulty during translation
a scenario, translators are paid on the basis of sentence length, which ignores other factors con-tributing to translation difficulty, as stated above. Our proposed Translation Difficulty Index (TDI) quantifies the translation difficulty of a sentence considering both lexical and structural proper-ties. This measure can, in turn, be used to clus-ter sentences according to their difficulty levels (viz. easy, medium, hard). Different payment and schemes can be adopted for different such clusters. TDI can also be useful for training and evalu-ating second language learners. For example, ap-propriate examples at particular levels of difficulty can be chosen for giving assignments and monitor-ing progress.
The rest of the paper is organized in the fol-lowing way. Section 2 describes TDI as func-tion of translafunc-tion processing time. Secfunc-tion 3 is on measuring translation processing time through eye tracking. Section 4 gives the correlation of linguistic complexity with observed TDI. In sec-tion 5, we describe a technique for predicting TDIs and ranking unseen sentences usingSupport Vec-tor Machines. Section 6 concludes the paper with pointers to future work.
2 Quantifying Translation Difficulty
As a first approximation, TDI of a sentence can be thetime taken to translatethe sentence, which can be measured through simple translation exper-iments. This is based on the assumption that more difficult sentences will require more time to trans-late. However, “time taken to translate” may not be strongly related to the translation difficulty for two reasons. First, it is difficult to know what fraction of the total translation time is actually spent on the translation-related-thinking. For
ex-ample, translators may spend considerable amount of time typing/writing translations, which is ir-relevant to the translation difficulty. Second, the translation time is sensitive to distractions from the environment. So, instead of the “time taken to translate”, we are more interested in the “time for which translation related processing is carried out by the brain”. This can be termed as the Trans-lation Processing Time(Tp). Mathematically,
Tp =Tp comp+Tp gen (1)
WhereTp compandTp genare the processing times
for source text comprehension and target text gen-eration respectively. The empirical TDI, is com-puted by normalizingTpwith sentence length.
T DI = Tp
sentencelength (2)
MeasuringTp is a difficult task as translators
of-ten switch between thinking and writing activities. Here comes the role ofeye tracking.
3 MeasuringTp by eye-tracking
We measure Tp by analyzing the gaze behavior
of translators through eye-tracking. The rationale behind using eye-tracking is that, humans spend time on what they see, and this “time” is corre-lated with the complexity of the information being processed, as shown in Figure 1. Two fundamental components of eye behavior are (a)Gaze-fixation or simply, Fixationand (b)Saccade. The former is a long stay of the visual gaze on a single loca-tion. The latter is a very rapid movement of the eyes between positions of rest. An intuitive feel for these two concepts can be had by consider-ing the example of translatconsider-ing the sentence The camera-man shot the policeman with a gun men-tioned in the introduction. It is conceivable that the eye will linger long on the word “shot” which is ambiguous and will rapidly move across “shot”, “camera-man” and “gun” to ascertain the clue for disambiguation.
The termsTp compandTp genin (1) can now be
looked upon as the sum of fixation and saccadic durations for both source and target sentences re-spectively.
Modifying 1
Tp =
X
f∈Fs
dur(f) +X
s∈Ss
dur(s)
+ X
f∈Ft
dur(f) +X
s∈St
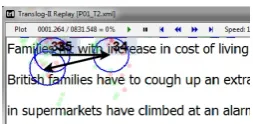
Figure 2: Screenshot of Translog. The circles rep-resent fixations and arrow reprep-resent saccades.
Here,FsandSscorrespond to sets of fixations and
saccades for source sentence andFtandSt
corre-spond to those for the target sentence respectively. duris a function returning the duration of fixations and saccades.
3.1 Computing TDI using eye-tracking database
We obtained TDIs for a set of sentences from the Translation Process Research Database (TPR 1.0)(Carl, 2012). The database contains trans-lation studies for which gaze data is recorded through the Translog software1(Carl, 2012).
Fig-ure 2 presents a screendump of Translog. Out of the 57 available sessions, we selected 40 transla-tion sessions comprising 80 sentence translatransla-tions2.
Each of these 80 sentences was translated from English to three different languages, viz. Span-ish, Danish and Hindi by at least 2 translators. The translators were young professional linguists or students pursuing PhD in linguistics.
The eye-tracking data is noisy and often ex-hibits systematic errors (Hornof and Halverson, 2002). To correct this, we applied automatic er-ror correction technique (Mishra et al., 2012) fol-lowed by manually correcting incorrect gaze-to-word mapping using Translog. Note that, gaze and saccadic durations may also depend on the transla-tor’s reading speed. We tried to rule out this effect by sampling out translations for which the vari-ance in participant’s reading speed is minimum. Variance in reading speed was calculated after tak-ing a samples of source text for each participant and measuring the time taken to read the text.
After preprocessing the data, TDI was com-puted for each sentence by using (2) and (3).The observed unnormalized TDI score3 ranges from
0.12 to 0.86. We normalize this to a [0,1] scale
1http://www.translog.dk
220% of the translation sessions were discarded as it was
difficult to rectify the gaze logs for these sessions.
3Anything beyond the upper bound is hard to translate and
[image:3.595.333.494.62.130.2]can be assigned with the maximum score.
Figure 3: Dependency graph used for computing SC
using MinMax normalization.
If the “time taken to translate” and Tp were
strongly correlated, we would have rather opted “time taken to translate” for the measurement of TDI. The reason is that “time taken to translate” is relatively easy to compute and does not require expensive setup for conducting “eye-tracking” ex-periments. But our experiments show that there is a weak correlation (coefficient = 0.12) between “time taken to translate” and Tp. This makes us
believe thatTpis still the best option for TDI
mea-surement.
4 Relating TDI to sentence features
Our claim is that translation difficulty is mainly caused by three features: Length,Degree of Poly-semyandStructural Complexity.
4.1 Length
It is the total number of words occurring in a sen-tence.
4.2 Degree of Polysemy (DP)
The degree of polysemy of a sentence is the sum of senses possessed by each word in the Wordnet nor-malized by the sentence length. Mathematically,
DPsentence=
P
w∈WSenses(w)
length(sentence) (4)
Here,Senses(w)retrieves the total number senses of a word P from the Wordnet. W is the set of words appearing in the sentence.
4.3 Structural Complexity (SC)
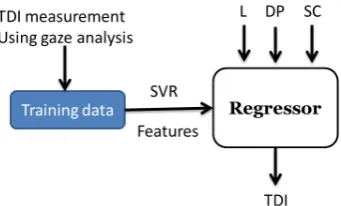
Figure 4: Prediction of TDI using linguistic prop-erties such as Length(L), Degree of Polysemy (DP) and Structural Complexity (SC)
Example:The man who the boy attacked escaped.
Figure 3 shows the dependency graph for the example sentence. The weights of the edges cor-respond how far the two connected words lie from each other in the sentence. Using Lin’s formula, the SC score for the example sentence turns out to be 15.
Lin’s way of computing SC is affected by sen-tence length since the number of dependency links for a sentence depends on its length. So we nor-malize SC by the length of the sentence. After normalization, the SC score for the example given becomes 15/7 = 2.14
4.4 How are TDI and linguistic features related
To validate that translation difficulty depends on the above mentioned linguistic features, we tried to find out the correlation coefficients between each feature and empirical TDI. We extracted three sets of sample sentences. For each sample, sentence selection was done with a view to vary-ing one feature, keepvary-ing the other two constant. The Correlation Coefficients between L, DP and SC and the empirical TDI turned out to be 0.72, 0.41and0.63respectively. These positive correla-tion coefficients indicate that all the features con-tribute to the translation difficulty.
5 Predicting TDI
Our system predicts TDI from the linguistic prop-erties of a sentence as shown in Figure 4.
The prediction happens in a supervised setting through regression. Training such a system re-quires a set sentences annotated with TDIs. In our case, direct annotation of TDI is a difficult and unintuitive task. So, we annotate TDI by
observ-Kernel(C=3.0) MSE (%) Correlation
Linear 20.64 0.69
Poly (Deg 2) 12.88 0.81
Poly (Deg 3) 13.35 0.78 Rbf (default) 13.32 0.73
Table 1: Relative MSE and Correlation with ob-served data for different kernels used for SVR.
ing translator’s behavior (using equations (1) and (2))instead of asking people to rate sentences with TDI.
We are now prepared to give the regression sce-nario for predicting TDI.
5.1 Preparing the dataset
Our dataset contains 80 sentences for which TDI have been measured (Section 3.1). We divided this data into 10 sets of training and testing datasets in order to carry out a 10-fold evaluation. DP and SC features were computed using Princeton Wordnet4
and Stanford Dependence Parser5.
5.2 Applying Support Vector Regression To predict TDI, Support Vector Regression (SVR) technique (Joachims et al., 1999) was preferred since it facilitates multiple kernel-based methods for regression. We tried using different kernels us-ing default parameters. Error analysis was done by means of Mean Squared Error estimate (MSE). We also measured the Pearson correlation coeffi-cient between the empirical and predicted TDI for our test-sets.
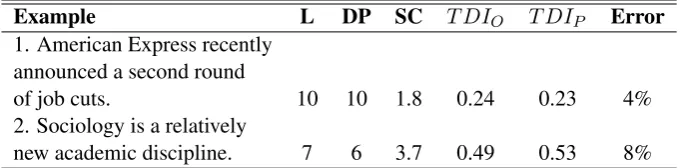
Table 1 indicates Mean Square Error percent-ages for different kernel methods used for SVR. MSE (%) indicates by what percentage the pre-dicted TDIs differ from the observed TDIs. In our setting, quadratic polynomial kernel with c=3.0 outperforms other kernels. The predicted TDIs are well correlated with the empirical TDIs. This tells us that even if the predicted scores are not as ac-curate as desired, the system is capable of ranking sentences in correct order. Table 2 presents exam-ples from the test dataset for which the observed TDI (T DIO) and the TDI predicted by polynomial
kernel based SVR (T DIP) are shown.
Our larger goal is to group unknown sentences into different categories by the level of
transla-4http://www.wordnet.princeton.edu 5http://www.nlp.stanford.edu/software/
[image:4.595.315.516.63.134.2]Example L DP SC T DIO T DIP Error
1. American Express recently announced a second round
of job cuts. 10 10 1.8 0.24 0.23 4%
2. Sociology is a relatively
[image:5.595.129.473.63.147.2]new academic discipline. 7 6 3.7 0.49 0.53 8%
Table 2: Example sentences from the test dataset.
tion difficulty. For that, we tried to manually as-sign three different class labels to sentences viz. easy, medium and hard based on the empirical TDI scores. The ranges of scores chosen for easy, medium and hard categories were [0-0.3], [0.3-0.75] and [0.75-1.0] respectively (by trial and er-ror). Then we trained a Support Vector Rank (Joachims, 2006) with default parameters using different kernel methods. The ranking framework achieves a maximum67.5%accuracy on the test data. The accuracy should increase by adding more data to the training dataset.
6 Conclusion
This paper introduces an approach to quantify-ing translation difficulty and automatically assign-ing difficulty levels to unseen sentences. It estab-lishes a relationship between the intrinsic senten-tial properties,viz.,length (L), degree of polysemy (DP)andstructural complexity (SC), on one hand and the Translation Difficulty Index (TDI), on the other. Future work includes deeper investigation into other linguistic factors such as presence of do-main specific terms, target language propertiesetc. and applying more sophisticated cognitive analy-sis techniques for more reliable TDI score. We would like to make use ofinter-annotator agree-ment to decide the boundaries for the translation difficulty categories. Extending the study to differ-ent language pairs and studying the applicability of this technique for Machine Translation Quality Estimation are also on the agenda.
Acknowledgments
We would like to thank the CRITT, CBS group for their help in manual correction of TPR data. In particular, thanks to Barto Mesa and Khristina for helping with Spanish and Danish dataset correc-tions.
References
Campbell, S., and Hale, S. 1999. What makes a text difficult to translate? Refereed Proceedings of the 23rd Annual ALAA Congress.
Carl, M. 2012. Translog-II: A Program for Record-ing User Activity Data for Empirical ReadRecord-ing and Writing Research In Proceedings of the Eight In-ternational Conference on Language Resources and Evaluation, European Language Resources Associ-ation(ELRA)
Carl, M. 2012 The CRITT TPR-DB 1.0: A Database for Empirical Human Translation Process Research. AMTA 2012Workshop on Post-Editing Technology and Practice(WPTP-2012).
Chall, J. S., and Dale, E. 1995. Readability revisited: the new Dale-Chall readability formula Cambridge, Mass.: Brookline Books.
Dragsted, B. 2010. Co-ordination of reading andwrit-ing processes in translation. Contribution to Trans-lation and Cognition, Shreve, G. and Angelone, E.(eds.)Cognitive Science Society.
Fry, E. 1977 Fry’s readability graph: Clarification, validity, and extension to level 17 Journal of Read-ing, 21(3), 242-252.
Hornof, A. J. and Halverson, T. 2002 Cleaning up sys-tematic error in eye-tracking data by using required fixation locations. Behavior Research Methods, In-struments, and Computers, 34, 592604.
Joachims, T., Schlkopf, B. ,Burges, C and A. Smola (ed.). 1999. Making large-Scale SVM Learning Practical. Advances in Kernel Methods - Support Vector Learning. MIT-Press, 1999,
Joachims, T. 2006 Training Linear SVMs in Lin-ear Time Proceedings of the ACM Conference on Knowledge Discovery and Data Mining (KDD).
Lin, D. 1996 On the structural complexity of natural language sentences. Proceeding of the 16th Inter-national Conference on Computational Linguistics
(COLING), pp. 729733.
Mishra, A., Carl, M, Bhattacharyya, P. 2012 A heuristic-based approach for systematic error cor-rection of gaze datafor reading. In MichaelCarl, P.B. and Choudhary, K.K., editors, Proceedings of the
First Workshop on Eye-tracking and Natural Lan-guage Processing, Mumbai, India. The COLING 2012 Organizing Committee
von der Malsburg, T., Vasishth, S., and Kliegl, R. 2012