Munich Personal RePEc Archive
Return, shock and volatility
co-movements between the bond markets
of Turkey and developed countries
Bayraci, Selcuk
Yeditepe University
23 July 2015
Online at
https://mpra.ub.uni-muenchen.de/65758/
Return, shock and volatility co-movements
between the bond markets of Turkey and
developed countries
July 23, 2015
Abstract
In this study, we present a VAR-BEKK model to investigate the
co-movements of long-term interest rates between Turkey and four developed
(Germany, Japan, USA and UK) markets . We use weekly rates on the
5-year maturity government bonds for the period of February 10, 2006 to
September 12, 2014 containing 448 observations. We empirically
docu-ment that, while Turkish bond market is only correlated with Japanese
and the US markets, there are strong ties between the returns and
volatil-ity of developed bond markets. Our findings indicate most of the
move-ments in international government bond markets is a product of global
risk factors rather than country specific factors.
JEL codes: C32; C51; G15
Keywords: Bond market co-movement; volatility spillover; BEKK-GARCH
1
Introduction
There has been growing interest on studying the interconnections in
interna-tional financial markets during last several years due to recent global financial
crises of US sub-prime mortgage crisis and European sovereign debt crisis.
Iden-tifying the linkages among the international interest rates is of pivotal
impor-tance for both financial economics and macroeconomics aspects. As proposed
by Yang (2005) studying co-movements of international interest rates may shed
a light on the cost of fiscal deficit, monetary policy-making, forecasting interest
rate movements and benefits of bond portfolio diversification.
Barassi et al. (2001) point out that bond rates can be treated as either
fi-nancial assets or macroeconomic policy instruments. Bond rates as fifi-nancial
assets may tend to move together with the increasing globalization and capital
flows across international financial markets. Conversely, if bond rates are seen
as a macroeconomic instruments, the co-movement of bond rates are perplexed
by the degree of national monetary and fiscal policy decisions. Therefore, it
might be worthwhile to empirically test the co-movement dynamics of the
in-ternational bond rates for a number of reasons. First of all, understanding
the interdependence in international bond markets is important to know how
economic and financial shocks are transmitted across the globe. Secondly,
in-terconnectedness of international bond markets is vital in terms of managing
monetary policies. Because, the domestic monetary policies are highly related to
the degree of co-movement between domestic and foreign interest rates.
There-fore, co-movements of bond rates across times and frequencies are crucial for
both public and private economic agents as well as for international inverstors
to build a well diversified portfolio.
co-movements by applying VAR(1)-BEKK(1,1) model which will enable us to assess
time-varying conditional correlations and spillover effects of return, shock and
volatility dynamics. The rest of this paper is organized as follows. Literature
review is given in 2. 3 presents the details of the methodological framework.
Empirical results are presented and analysed in 4 and 5 concludes.
2
Literature review
There are several studies in the literature that carried out on exploring the
linkages of international bond markets. There are mixed empirical results
de-pending on sample period and econometric methodology used. While, some of
them argue that bond yield and returns across different countries are positively
correlated and move together. There are some studies contradict this argument
as finding no significant evidence on the bond market integration.
Further-more, some researchers also assert that integration are more likely to increase
during the turmoil periods or after the certain events (for example;
introduc-tion of Euro, September 11, Lehman Brothers collapse). In this part, we will
summarize the results of some existing studies in the field.
Yang (2005) conducted a research to reconnoitre the government bond
mar-ket linkages among the six European (Germany, France, Italy, the UK, Belgium
and the Netherlands) with using co-integration, Granger causality and forecast
error variance decomposition methods. The study reports the weak existence
of a long-term relationship among the European bond markets. However,
ac-cording to the results from the forecast error decomposition analysis there are
generally co-movements among the markets without a distinctive leadership.
Kim et al. (2006) looked into integration dynamics of EU countries by
utiliz-ing Kalman filter and bivariate EGARCH models and found evidences of strong
relationship between the UK and German markets are weaker than those of the
UK and other EU members.
Ciner (2007) explored interactions among the government bond markets of
four major developed countries ( US, Germany, Japan and the UK) between
1988 and 2005. He detects no empirical evidence of co-integration among the
bond markets for the full period. However, he demonstrates that there are
strong causal associations between markets for the period of 1996-2005.
Skintzi and Refenes (2006) conducted a research to shed a light on the
in-tegration dynamics and volatility spillover effects of European and US bond
markets. They support the idea of spillover effect from the US to European
bond markets. They also remark that integration among European bond
mar-kets has multiplied after the introduction of Euro. The empirical results of
strong co-movements among European bond markets after the circulation of
single currency were also documented in the studies of Cappiello et al. (2006)
and Christiansen (2007).
Laopodis (2008) also studied the government bond market linkages among
the European countries by using Granger causality tests. He posits several
bi-directional linkages among the European bond markets. The results of the
analysis also suggest unidirectional causal effects from the US bond market
to the European markets. On the other hand, Abad et al. (2010) analysed
the impact of single currency Euro on European bond market integration by
utilizing CAPM based linear regression model and found EU and US sovereign
bond markets display a weak level of integration for the period of 1999-2008.
However, their result suggest that there is a strong link between the US and
German bond yields.
A recent study of Matei (2013) employs multivariate Granger causality
2003 and 2013. She argues that although, the bond market integration among
EU countries became stronger after the initiation of Euro, not all the bond
mar-kets have strong relationship in the long-run. The results from the study show
that ”‘core”’ countries (Germany, France, and Italy etc.) are more integrated
than the ”‘periphery”’ countries (Ireland, Greece and Portugal). Overall, she
found a weak degree of integration among the EU markets and direction of
causality changes during the turbulent periods which can be interpreted as a
contagion effect. Therefore, it is a difficult task for European Central Bank’s
monetary authorities to manage the long-term interest rates to maintain the
price stability.
Apart from studies examining the relationship between developed bond
mar-kets, there are few studies that investigating the emerging and frontier markets.
A study on the integration dynamics of emerging bond markets has been carried
out by Cifarelli and Paladino (2006). They applied principal component analysis
(PCA) and orthogonal GARCH (O-GARCH) methods to the daily spreads of
the sovereign emerging bonds. They claim that conditional covariances among
the emerging bond spreads tend to increase during the crisis times.
Thupayagale and Molalapata (2012) investigated the degree of
interdepen-dence among three emerging bond markets (Mexico, South Africa, and South
Korea) and the US with vector autoregressive (VAR) and DCC-GARCH
meth-ods. They indicate that emerging market bonds are not co-integrated in the
long-run. They also found no statistically significant short-run relationship
among the markets. Moreover, impacts of the US bond rates on these emerging
market bonds are limited.
Piljak (2013) assess the time-varying evolution of the correlations of the then
emerging and four frontier bond returns with the US bond returns between
that only Malaysian market returns show positive correlation with the US
re-turns during the whole period. China, Mexico, Poland and South Africa have
generally show positive correlation while Brazil, Russia, Turkey and Ecuador
have predominantly negative correlations with the US.
Integration of Asian bond markets with the US and Australian markets has
been studied by Vo (2009). Their empirical results do not show a high level
of integration between the Asian bond markets with the US and Australian
markets which can be accredited to home country bias in Asian markets.
3
Econometric Framework
In order to capture the joint process between international bond yield returns,
we consider the following econometric model.
Xt = ω+ Θ1Xt−1+ Θ2Xt−2+...+ ΘpXt−p+εt (1)
εt|Ωt−1 ≈ N(0, Ht)
withXtis an (nx1) vector of daily returns at time t and Θ is a (nxn) matrix
containing the coefficients related with the lagged returns. For the five variable
VAR(1) model, which we apply in this study, the Eq.1 can be represented as;
x1,t
x2,t
x3,t
x4,t
x5,t
= ω1 ω2 ω3 ω4 ω5 +
θ11 θ12 θ13 θ14 θ15
θ21 θ22 θ23 θ24 θ25
θ31 θ32 θ33 θ34 θ35
θ41 θ42 θ43 θ44 θ45
θ51 θ52 θ53 θ54 θ55
x1,t−1
x2,t−1
x3,t−1
x4,t−1
x5,t−1
+
ε1,t
ε2,t
ε3,t
ε4,t
ε5,t
In the above VAR(1) model,xi,t fori= 1,2,3,4,5 represents the returns of the
bond The diagonal elements θii in matrix Θ measure the effect of respective
bond’s lagged own returns, while the off-diagonal elements θi,j represent the
connections in terms of bond yield returns also known as return spillovers. The
random errorsεi,tare the innovations of each return at timetwith corresponding
(5x5) conditional variance-covariance matrix Ht. The vector of c represent
constant terms. Engle and Kroner (1995) showed that conditional variance
matrixHt can be modeled by a linear function of the past squared errors and
cross products of errors and past values of the elements of variance-covariance
matrixHt, thusHt can be represented as:
Ht=CTC+ATεTt−1εt−1A+B
TH
t−1B (3)
where C is a (5x5) lower triangular matrix (to induce the positive
semi-definiteness ofHt) containing the constant terms. A is a (5x5) matrix of the
coefficient corresponding to the lagged squared errors. The elements of matrix
Ameasure the impacts of ’innovations’ or shocks on the conditional variances.
The (5x5) matrixB signifies the effects of past values of conditional
variance-covariance matrix onto the current one. The matrices A and B capture the
ARCH and GARCH effects of the volatility process. The diagonal coefficients
αi,i(fori= 1,2,3,4,5) of matrixAshows the dependence of current conditional
variances hi,i on their lagged squared errors, whereas the effects of the past
conditional variances ofhi,iare indicated through significance of the parameters
βi,i. The effects of cross-shocks and cross-volatilities are measured with
off-diagonal elementsαi, jandβi,j of the matricesAandB.
the conditional log likelihood functionL(Φ) which has the following expression:
L(Φ) =−T log(2π)−0.5
N
X
t−1
log|Ht(Φ)| −0.5 N
X
t−1
εt(Φ)TH−
1
t εt(Φ) (4)
where,N is the number of observations and Φ denotes the parameter set to be
estimated.
4
Empirical Results
4.1
Initial data analysis and descriptive statistics
Bond yield data for Turkey and for the four developed economies, namely
Germany, Japan, United States and the United Kingdom are retrieved from
Bloomberg database. The sample period spans from February 10, 2006 to
September 12, 2014 containing 448 weekly observations of the yields on the
5-year maturity government bonds. The log-returns of the bond yields are
cal-culated as the growth rate of bond yields, Xt= ln(Rt)−ln(Rt−1), where Rt
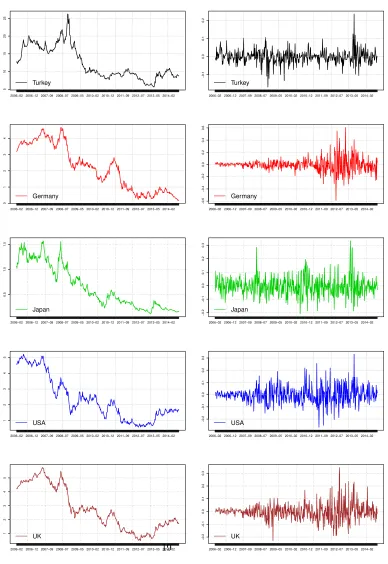
bond rate at timet. Figure 1 illustrates the time series plots of the yields (Rt)
and returns (Xt) of the Turkish and international 5-year government bonds.
From the figures, we can spot that yields of the German, US and UK
long-term government bonds have close relationship. Yields of the Japanese and
Turkish bonds deviate from this relationship but have some similar moving
ten-dency during several specific time periods (for example; sharp falls after the
Lehman Brothers collapse). Since, world financial markets are experiencing
harsh times due to recent global crises, investors tend to move from stock
mar-kets to bond marmar-kets. As a consequence, we witness a downward trend for the
bond yields resulted from bond price increases.
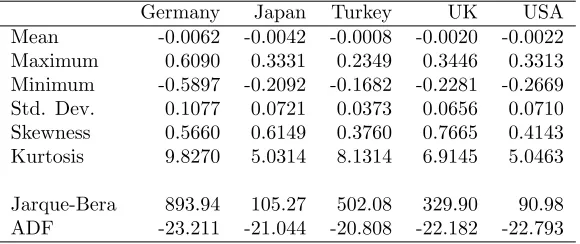
statistics, we notice that Turkish bond returns show lower unconditional risk as
measured by the standard deviation of daily bond yield returns than the
devel-oped markets. The kurtosis and skewness statistics indicate that non-normality
is a common phenomenon for bond market return distributions. Jarque-Bera
statistics also recommend that bond market returns do not obey the normal
law. We conclude that all return series are stationary as suggested by ADF test
statistics.
4.2
Unconditional correlation analysis
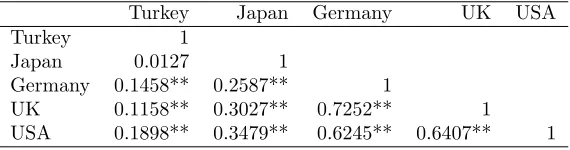
Table 2 reports the pairwise unconditional correlation coefficients between the
international bond markets. Overall, we observe high degree of co-movements
between the UK, the USA, and Germany with correlation values range from
0.62 to 0.72. Japan has weaker degree of relationships with other markets as
suggested by correlation coefficients lower than 0.5. Moreover, relationship
be-tween Turkish and Japanese markets is statistically insignificant. Overall, we
find that developed markets seem to be more integrated and correlations
be-tween the Turkish and developed bond market returns are positive and
statisti-cally significant (except with Japan), but they are weak with coefficients lower
than 0.5.
From the point of Turkish investors, low correlation coefficients enrich
po-tential portfolio diversification benefits by investing in international bond
mar-kets. Reversely, Turkish bond markets might be attractive for the international
investors in terms of diversifying their portfolio risks. However, as Graham
et al. (2012) point out using simple correlation coefficients for analysing the
co-movements between the financial markets and make portfolio allocation
de-cisions could be deceptive due to temporal instability of such correlation
integration dynamics of the international bond markets.
4.3
VAR-BEKK estimation results
In order to see the time-varying evolutions of conditional correlations between
Turkish and international bond returns and spot the direction of spillovers, we
applied a VAR(1)-BEKK(1,1). We present the estimated coefficients of the
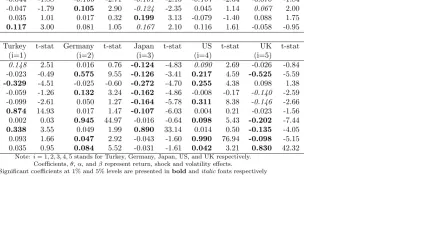
matrices Θ,AandB in Table 3.
In order to examine the relationship in terms of bond yield returns; we
inspect the elements of matrix Θ of the 2 captured by the coefficientsθi,j in
the panel A of Table 3. We notice that diagonal elementsθ1,1,θ4,4andθ5,5are
statistically insignificant meaning that bond yield returns of Turkey, USA and
the UK do not depend on their lagged values. On the other hand, German and
Japanese bond yields have dependence on their past returns as indicated with
significant parametersθ2,2andθ3,3.
When we look at the off-diagonal elements of the matrix Θ; we observe
fol-lowing patterns for the cross-market linkages among bond yield returns. First
of all, the significantθ1,5 = 0.117 parameter suggests that Turkish bond yield
returns respond positively to the changes in the UK bond returns. While we
observe a uni-directional return spillover from US market to Japanese market
with parameterθ3,4 = 0.199, Japanese bond market has bidirectional
relation-ship with German and the UK markets as exposed with statistically significant
coefficients of θ2,3 = 0.105, θ3,2 =−0.101,θ3,5 = 0.167 and θ5,3 = 0.067. The
estimation results of the mean equation reveal that Japanese bond market are
sensitive to changes originated from other developed markets.
To see the cross-market shock and volatility transmissions, we look into
es-timated parameters of BEKK model given as αi,j and βi,j in the panel B of
past shock or ARCH effects, while the diagonal elements of matrixB measure
own past volatility or GARCH effects. As presented in Table 3, the statistically
significant diagonal parametersα11,α22,α33andα55are implying the existence
of ARCH effect in the bond returns of Turkey, Germany, Japan and the UK.
Furthermore, the diagonal coefficientsβ11throughβ55are all statistically
signif-icant showing a strong presence of GARCH effects. Thus, conditional variances
of all bond returns are driven by a strong GARCH(1,1) process.
We inspect the off-diagonal elements of matrix A and B to understand
the cross-market linkages in terms of shock spillover and volatility spillover
among international bond markets. Firstly, we document a two-way negative
shock transmission between Turkey and Japan at 1% significance level. News on
Turkish bond market have also moderate impact on the conditional volatility of
the US bond returns at 5% level. There also exists a bidirectional shock spillover
between Japanese and US bond markets. While, the shocks on Japanese bond
returns have positive effect over the US bond returns, Japanese bond return
volatility respond negatively to the news from the US market.
Moreover, we found evidence of unidirectional negative shock transmission
from German and the UK markets to Japan. The significantα24,α42 andα25,
α52andα45,α54indicate strong bidirectional shock spillover between Germany
and US; between Germany and UK; and between US and UK at 1% significant
level. There are strong bidirectional volatility spillovers between Turkish and
Japanese market as shown with parameter β13 = 0.338 and β31 = −0.107.
The past volatility shocks in Japanese bond market have also negative effects
on the future volatility in the UK bond market. The bidirectional volatility
transmission mechanisms are also present between Germany and US; Germany
and UK; US and UK.
and shock spillover receiver, and future volatility of the UK bond market heavily
depend on past volatility shock from other markets, specifically UK is the main
volatility receiver. It is also interesting that there is a strong bidirectional shock
and volatility linkages between Turkish and Japanese bond markets which can
be attributed to the carry-trade phenomenon.
5
Conclusion
For this study, we implemented VAR-BEKK model, for empirical purposes, to
investigate the co-movements among the international bond markets at returns,
shock and volatility level. Our empirical results for this chapter have some
im-plications from the point of macroeconomic perspective. First, the higher degree
of co-movement indicate greater shock transmission exist in world bond market
with possible adverse consequences of the monetary policy stability. Central
banks of the developed markets have more difficult tasks of implementing and
controlling monetary policy (as their aim is to control interest rates and
main-tain price stability).
Moreover, higher degree of bond market integration has important
implica-tions for the fiscal policy maintenance. As suggested by Claeys et al. (2010),
with the increasing glabalization, capital mobility and trade flows among
coun-tries have profilarated in last decade driving both domestic and foreign agents
to seek out diversification benefits across borders. As a consequence, budget
deficits of one economy are not solely financed by domestic resources. Fiscal
policies of governments heavily depend on international capital markets.
Re-versely, fiscal decisions of one goverment has impact on all other capital markets
in an integrated economic environment.
In conclusion, the results documented in this chapter are in line with some
and Tanggaard, 2004, 2007) suggest that most of the movements in
interna-tional government bond markets is a product of global risk factors rather than
country specific factors. A further study will be needed to uncover the precise
reasons and risk factors behind the bond rate co-movements in the international
markets.
References
Abad, P., Chuli´a, H., and G´omez-Puig, M. (2010). EMU and European
govern-ment bond market integration. Journal of Banking & Finance, 34(12):2851–
2860.
Barassi, M. R., Caporale, G. M., and Hall, S. G. (2001). Irreducibility and
structural cointegration relations: an Application to the G-7 long-term
inter-est rates. International Journal of Finance & Economics, (6):127–138.
Barr, D. G. and Priestley, R. (2004). Expected returns, risk and the integration
of international bond markets. Journal of International money and finance,
23(1):71–97.
Cappiello, L., Engle, R. F., and Sheppard, K. (2006). Asymmetric dynamics
in the correlations of global equity and bond returns. Journal of Financial
econometrics, 4(4):537–572.
Christiansen, C. (2007). Volatility-spillover effects in European bond markets.
European Financial Management, 13(5):923–948.
Cifarelli, G. and Paladino, G. (2006). Volatility co-movements between emerging
sovereign bonds: Is there segmentation between geographical areas? Global
Ciner, C. (2007). Dynamic linkages between international bond markets.
Jour-nal of MultinatioJour-nal Financial Management, 17(4):290–303.
Claeys, P., Moreno, R., and Suri˜nach, J. (2010). Fiscal policy and interest rates:
the role of financial and economic integration. InProgress in Spatial Analysis,
pages 311–336. Springer.
Driessen, J., Melenberg, B., and Nijman, T. (2003). Common factors in
interna-tional bond returns.Journal of International Money and Finance, 22(5):629–
656.
Engle, R. F. and Kroner, K. F. (1995). Multivariate simultaneous generalized
ARCH. Econometric theory, 11(01):122–150.
Engsted, T. and Tanggaard, C. (2004). The comovement of US and UK stock
markets. European Financial Management, 10(4):593–607.
Engsted, T. and Tanggaard, C. (2007). The comovement of US and German
bond markets. International Review of Financial Analysis, 16(2):172–182.
Graham, M., Kiviaho, J., and Nikkinen, J. (2012). Integration of 22
emerg-ing stock markets: a three-dimensional analysis. Global Finance Journal,
23(1):34–47.
Kim, S.-J., Lucey, B. M., and Wu, E. (2006). Dynamics of bond market
integra-tion between established and accession European Union countries. Journal of
International Financial Markets, Institutions and Money, 16(1):41–56.
Laopodis, N. T. (2008). Government bond market integration within European
Union. International Research Journal of Finance and Economics, 19:56–76.
Matei, I. (2013). Government bond market linkages within EMU: evidence from
Piljak, V. (2013). Bond markets co-movement dynamics and macroeconomic
factors: Evidence from emerging and frontier markets. Emerging Markets
Review, 17:29–43.
Skintzi, V. D. and Refenes, A. N. (2006). Volatility spillovers and dynamic
correlation in European bond markets. Journal of International Financial
Markets, Institutions and Money, 16(1):23–40.
Thupayagale, P. and Molalapata, I. (2012). Dynamic co-movement and
correla-tions in fixed income markets: Evidence from selected emerging market bond
yields. Investment Analysts Journal, (76):25–38.
Vo, X. V. (2009). International financial integration in asian bond markets.
Research in International Business and Finance, 23(1):90–106.
Yang, J. (2005). Government bond market linkages: evidence from Europe.
6
Appendix: Tables and Figures
Table 1 Summary statistics of the bond yield returns
Germany Japan Turkey UK USA Mean -0.0062 -0.0042 -0.0008 -0.0020 -0.0022 Maximum 0.6090 0.3331 0.2349 0.3446 0.3313 Minimum -0.5897 -0.2092 -0.1682 -0.2281 -0.2669 Std. Dev. 0.1077 0.0721 0.0373 0.0656 0.0710 Skewness 0.5660 0.6149 0.3760 0.7665 0.4143 Kurtosis 9.8270 5.0314 8.1314 6.9145 5.0463
Table 2 Unconditional correlations between bond yield returns
Turkey Japan Germany UK USA
Turkey 1
Japan 0.0127 1
Germany 0.1458** 0.2587** 1
UK 0.1158** 0.3027** 0.7252** 1 USA 0.1898** 0.3479** 0.6245** 0.6407** 1
Table 3 Estimated coeffcients for VAR(1)-BEKK(1,1) model
Panel A
Turkey t-stat Germany t-stat Japan t-stat US t-stat UK t-stat
(i=1) (i=2) (i=3) (i=4) (i=5)
θi,1 0.032 0.65 0.008 0.14 0.036 0.43 0.098 1.50 0.040 0.74
θi,2 -0.044 -1.88 -0.166 -2.71 -0.101 -2.15 -0.107 -2.54 -0.070 -1.84
θi,3 -0.047 -1.79 0.105 2.90 -0.124 -2.35 0.045 1.14 0.067 2.00
θi,4 0.035 1.01 0.017 0.32 0.199 3.13 -0.079 -1.40 0.088 1.75
θi,5 0.117 3.00 0.081 1.05 0.167 2.10 0.116 1.61 -0.058 -0.95 Panel B
Turkey t-stat Germany t-stat Japan t-stat US t-stat UK t-stat
(i=1) (i=2) (i=3) (i=4) (i=5)
αi,1 0.148 2.51 0.016 0.76 -0.124 -4.83 0.090 2.69 -0.026 -0.84
αi,2 -0.023 -0.49 0.575 9.55 -0.126 -3.41 0.217 4.59 -0.525 -5.59
αi,3 -0.329 -4.51 -0.025 -0.60 -0.272 -4.70 0.255 4.38 0.098 1.38
αi,4 -0.059 -1.26 0.132 3.24 -0.162 -4.86 -0.008 -0.17 -0.140 -2.59
αi,5 -0.099 -2.61 0.050 1.27 -0.164 -5.78 0.311 8.38 -0.146 -2.66
βi,1 0.874 14.93 0.017 1.47 -0.107 -6.03 0.004 0.21 -0.023 -1.56
βi,2 0.002 0.03 0.945 44.97 -0.016 -0.64 0.098 5.43 -0.202 -7.44
βi,3 0.338 3.55 0.049 1.99 0.890 33.14 0.014 0.50 -0.135 -4.05
βi,4 0.093 1.66 0.047 2.92 -0.043 -1.60 0.990 76.94 -0.098 -5.15
βi,5 0.035 0.95 0.084 5.52 -0.031 -1.61 0.042 3.21 0.830 42.32
Note: i= 1,2,3,4,5 stands for Turkey, Germany, Japan, US, and UK respectively. Coefficients,θ,α, andβrepresent return, shock and volatility effects.
Significant coefficients at 1% and 5% levels are presented inboldanditalicfonts respectively
Figure 1 International 5-year government bond yields and returns
2006−02 2006−12 2007−09 2008−07 2009−05 2010−02 2010−12 2011−09 2012−07 2013−05 2014−02
5 10 15 20 25 Turkey
2006−02 2006−12 2007−09 2008−07 2009−05 2010−02 2010−12 2011−09 2012−07 2013−05 2014−02
−0.1
0.0
0.1
0.2
Turkey
2006−02 2006−12 2007−09 2008−07 2009−05 2010−02 2010−12 2011−09 2012−07 2013−05 2014−02
0 1 2 3 4 Germany
2006−02 2006−12 2007−09 2008−07 2009−05 2010−02 2010−12 2011−09 2012−07 2013−05 2014−02
−0.6 −0.4 −0.2 0.0 0.2 0.4 0.6 Germany
2006−02 2006−12 2007−09 2008−07 2009−05 2010−02 2010−12 2011−09 2012−07 2013−05 2014−02
0.5
1.0
1.5
Japan
2006−02 2006−12 2007−09 2008−07 2009−05 2010−02 2010−12 2011−09 2012−07 2013−05 2014−02
−0.2 −0.1 0.0 0.1 0.2 0.3 Japan
2006−02 2006−12 2007−09 2008−07 2009−05 2010−02 2010−12 2011−09 2012−07 2013−05 2014−02
1 2 3 4 5 USA
2006−02 2006−12 2007−09 2008−07 2009−05 2010−02 2010−12 2011−09 2012−07 2013−05 2014−02