Lincoln
University
Digital
Thesis
Copyright
Statement
The
digital
copy
of
this
thesis
is
protected
by
the
Copyright
Act
1994
(New
Zealand).
This
thesis
may
be
consulted
by
you,
provided
you
comply
with
the
provisions
of
the
Act
and
the
following
conditions
of
use:
you
will
use
the
copy
only
for
the
purposes
of
research
or
private
study
you
will
recognise
the
author's
right
to
be
identified
as
the
author
of
the
thesis
and
due
acknowledgement
will
be
made
to
the
author
where
appropriate
you
will
obtain
the
author's
permission
before
publishing
any
material
from
the
thesis.
U.S. Quantitative Easing Policies: Their Effect on the Global Bond
Markets
A thesis
submitted in partial fulfilment
of the requirements for the Degree of
PhD of Finance
at
Lincoln University
by
Haiming Yu
Lincoln University
Abstract of a thesis submitted in partial fulfilment of the
requirements for the Degree of PhD of Finance.
Abstract
U.S. Quantitative Easing Policies: Effect on the Global Bond Markets
by
Haiming Yu
Since the 2007 U.S. subprime crisis, major economies have suffered from severe recessions. Even
cutting short-term interest rates to almost zero has not been enough to stimulate depressed
economies. Under these circumstances, the Federal Reserve implemented an unconventional
monetary easing policy in 2008; the Quantitative Easing (QE) policy. Within this U.S. QE framework,
long-term U.S. assets, and in particular, long-term U.S. Treasuries, have been absorbed, with
increasing reserves on the Fed’s balance sheet. This policy was initially designed to tackle domestic
recession problems: it significantly reduced long-term U.S. interest rates and lowered unemployment
levels. Due to the U.S.’s role in global markets, these U.S. QE policy effects are certain to spill over to
other markets and economies.
This study investigates the U.S. QE spillover effects on ten-year bond markets in both developed and
emerging economies for the period 2007 to 2016. I apply both Structural VAR (SVAR) model and
Dynamic Conditional Correlation-GARCH (DCC-GARCH) model to address the interactions among
global bond markets when examining the U.S. QE spillover effects. The inclusion of both short- and
long-term U.S. QE policy shocks better measures the policy shocks from each U.S. QE policy.
Empirical evidence suggests a growing trend in integration levels between U.S. bond market and
global bond markets during each U.S. QE period. This indicates a more substantial U.S. QE spillover
effect to the global bond markets. Further, the results also reveal that long-term U.S. QE policy
shocks will significantly reduce bond yields, particularly in developed markets, across all three U.S.
QE periods. The results also show limited evidence which supports short-term U.S. QE spillover
effects on bond yields. This means that term assets purchase activities will provide more
long-lasting and substantial spillover effects on reducing long-term foreign bond yields. Furthermore, the
results show pronounced volatility spillover effects, from both short-term and long-term U.S. QE
policy shocks, although mainly on emerging bond markets. This significant U.S. QE volatility spillover
spillover effects, as a result of less developed financial market foundations, compared to the
developed bond markets, they are more vulnerable and sensitive to the exogenous monetary shocks
from leading economies.
Keywords: Quantitative Easing, monetary policy shock, global bond market, spillover effect, volatility
Acknowledgements
First of all, I would like to express my sincere gratitude to my chief supervisor Dr. Baiding Hu for his
patience, dedication and encouragement. His work efficient supervision and detailed guidance
continually support me all the way through my PhD study. My sincere gratitude also goes to
Professor Christopher Gan, my associate supervisor. His work ethic has encouraged me from the start
to the end of my study. Both of them are my role models in teaching. Their engaging teaching
influences me in my future career. I also would like to thank Dr. Zhaohua Li, who taught me Finance
Theory and Corporate Policy, which enhanced my understanding on financial markets. Sincere
appreciation also goes to Faculty of Agribusiness and Commerce and Lincoln Library for their help
and support.
I would like to express my love and gratitude to my parents. Without their contionous support and
encouragement, I cannot complete my PhD study. Their unflinching courage and conviction will
always inspire me.
In closing, I would like to thank all of my supporters who made my PhD completion possible. Their
Table of Contents
Abstract ... ii
Acknowledgements ... iv
Table of Contents ... v
List of Tables ... viii
List of Figures ... ix
Chapter 1 Introduction ... 1
1.1 Background ...1
1.2 QE Policies in Japan ...2
1.3 QE Policies in the U.S. ...4
1.4 QE Policies in the U.K. ...5
1.5 QE Policies in the Euro Zone ...6
1.6 Consensus of QE...7
1.7 Research Problem ...9
1.8 Research Objectives ...9
1.9 Research Contribution ...9
1.10 Structure of the Thesis ... 10
Chapter 2 Literature Review... 11
2.1 Introduction ... 11
2.2 Development of Quantitative Easing ... 11
2.2.1 Conventional Monetary Policies ...12
2.2.2 Liquidity Trap ...14
2.2.3 Unconventional Monetary Policy ...15
2.3 QE Policy Transmission Channels ... 17
2.3.1 Signalling Channel ...18
2.3.2 Portfolio Balancing Channel ...19
2.3.3 The Liquidity Channel ...20
2.3.4 The Bank Lending Channel ...21
2.3.5 The Confidence Channel ...21
2.3.6 Summary ...21
2.4 QE Effects at the Domestic Level ... 22
2.4.1 QE Effects on Domestic Economies ...22
2.4.2 QE Effects on Domestic Bond Markets ...23
2.5 The Theoretical Basis of Monetary Policy Spillover Effects ... 26
2.5.1 Mundell-Fleming Model ...27
2.5.2 New Open Economy ...27
2.6 Modelling Quantitative Easing ... 27
2.6.1 Event Study and QE ...28
2.6.2 GARCH Models on Quantitative Easing...29
2.6.3 VAR models and QE ...31
2.8 The U.S. QE Spillover Effects on Global Bond Yields ... 33
2.8.1 The U.S. QE Spillover Effects on Macroeconomic Variables ...34
2.8.2 The U.S. QE Spillover Effects on Global Bond Yields ...35
2.9 U.S. QE Volatility Spillover Effects on Global Financial Markets ... 38
2.10 Summary ... 39
Chapter 3 Methodology ... 41
3.1 Introduction ... 41
3.2 Data and Stationarity Test ... 41
3.2.1 Data ...41
3.2.2 Stationarity of Data and Break Points ...43
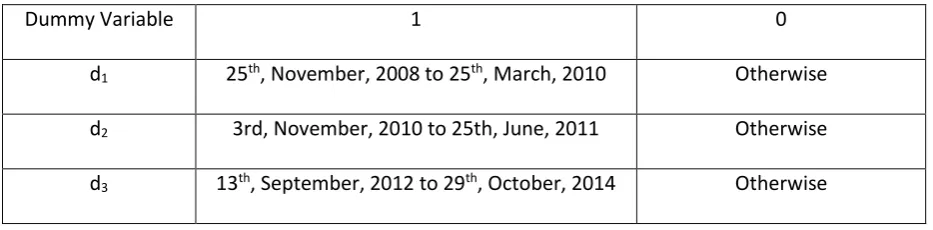
3.3 Identification of U.S. QE Policy Surprises ... 44
3.4 Market Integration during Different U.S. QE Periods ... 47
3.5 The U.S. QE Spillover Effects on Global Bond Yields ... 49
3.6 The U.S. QE Volatility Spillover on Global Bond Markets ... 51
3.7 Summary ... 52
Chapter 4 Empirical Results ... 53
4.1 Introduction ... 53
4.2 Descriptive Statistics and Data Properties ... 53
4.2.1 Descriptive Statistics ...53
4.2.2 Time Series Property of the Data ...62
4.2.3 Tests for Structural Break Points ...63
4.3 Empirical Results and Discussions of Market Integration during the U.S. QE Periods ... 64
4.3.1 Optimal Lag Length of Unrestricted VAR Models ...64
4.3.2 The Contemporaneous Interactions among Global Bond Markets ...66
4.3.3 Impulse Response Analysis ...66
4.3.4 Variance Decomposition Analysis ...69
4.4 Empirical Results and QE Spillover Effects on Global Bond Yields ... 90
4.4.1 Effects of Domestic and International Economic Factors on Bond Yields ...90
4.4.2 The U.S. QE Spillover Effects on Global Bond Yields ...92
4.4.3 Dynamic Correlations (Modelling Spillover Effects on Bond Yields) ...93
4.5 Empirical Results and QE Spillover Effects on Global Bond Volatilities ... 95
4.5.1 ARCH, GARCH and Asymmetric Terms on Global Bond Yield Volatilities ...95
4.5.2 Effects of Domestic and International Economic Factors on Bond Yield Volatilities .96 4.5.3 Volatility Spillover Effects of the U.S. QE Policies on Global Bond Yields ...96
4.5.4 Dynamic Correlations (Modelling Spillover Effects on Bond Yield Volatilities) ...98
4.6 Summary ... 99
Chapter 5 Conclusion ... 100
5.1 Introduction ... 100
5.2 Summary of the Empirical Findings ... 100
5.2.1 Research Objective One ...100
5.2.2 Research Objective Two ...101
5.2.3 Research Objective Three ...103
5.3 Practical Implications for Policy Makers and Market Participants ... 104
5.3.1 Implications for Policy Makers ...104
5.4 Contributions of this Study ... 106
5.5 Limitations of the Study ... 107
5.6 Suggestions for Future Studies ... 107
List of Tables
Table 1-1 Quantitative Easing Programs in the U.S., U.K. and Japan ... 2
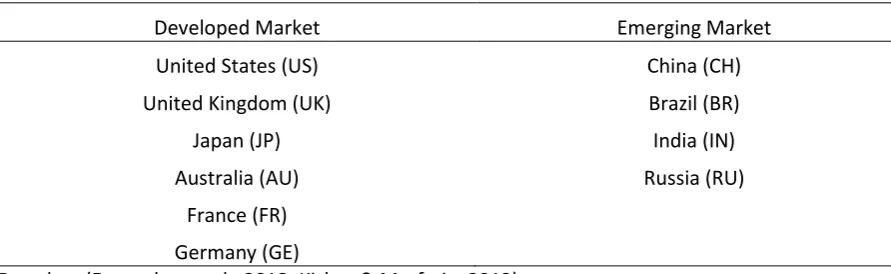
Table 3-1 Markets Included in the Current Study ...43
Table 3-2 Dummy Variables Represent Each U.S. QE Round ...46
Table 4-1 Descriptive Statistics for Ten-Year Bond Yields (2007 to 2016) ...55
Table 4-2 Descriptive Statistics for Ten-Year Bond Yields (U.S. QE1 Period) ...55
Table 4-3 Descriptive Statistics for Ten-Year Bond Yields (U.S. QE2 Period) ...56
Table 4-4 Descriptive Statistics for Ten-Year Bond Yields (U.S. QE3 Period) ...56
Table 4-5 Mean and Median Difference for Bond Yields across Different U.S. QE Periods...57
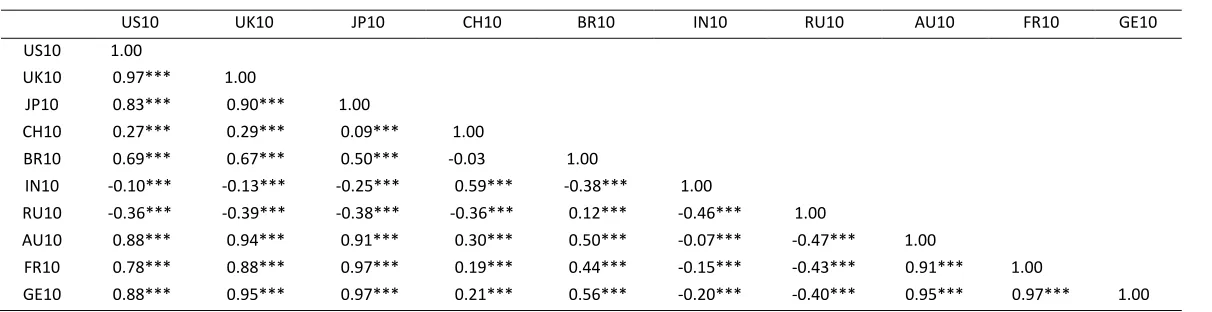
Table 4-6 Unconditional Correlation among Long-Term Bond Yields (2007 to 2016) ...57
Table 4-7 Unconditional Correlation among Long-Term Bond Yields (U.S. QE1 Period) ...58
Table 4-8 Unconditional Correlation among Long-Term Bond Yields (U.S. QE2 Period) ...58
Table 4-9 Unconditional Correlation among Long-Term Bond Yields (U.S. QE3 Period) ...59
Table 4-10 Unit Root Results among ADF, DFGLS, PP and Break Point ADF Tests ...62
Table 4-11 Chow Tests for All Starting and Ending Dates of U.S. QE Policies ...63
Table 4-12 Break Point Dates for All Markets from Break Point Unit Root Tests ...63
Table 4-13 Information Criteria for Optimal Lag Length ...65
Table 4-14 Structural Matrix Coefficients for the Entire Sample Period ...71
Table 4-15 Structural Matrix Coefficients for the U.S. QE1 Period ...71
Table 4-16 Structural Matrix Coefficients for the U.S. QE2 Period ...72
Table 4-17 Structural Matrix Coefficients for the U.S. QE3 Period ...72
Table 4-18 Variance Decomposition with the U.S., U.K., Japanese and Domestic Yields (%) ...85
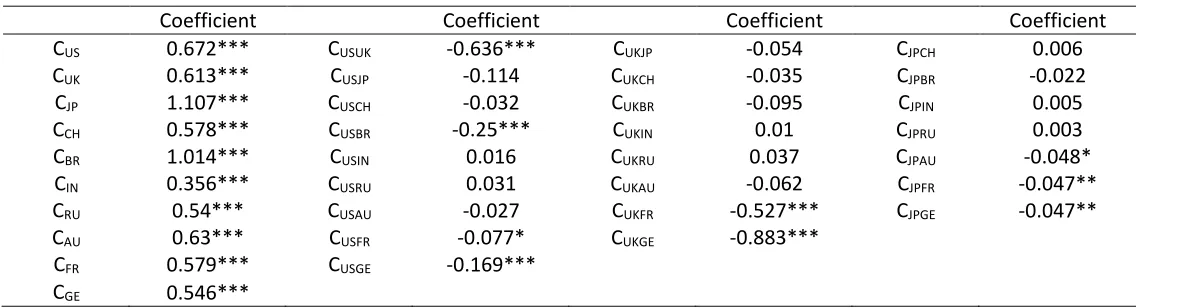
Table 4-19 Short-Term and Long-Term QE Shocks on Global Bond Yields ...86
List of Figures
Figure 2-1 Conventional Monetary Policy Transmission Channels ...13
Figure 2-2 Unconventional Monetary Policy Transmission Channels ...18
Figure 2-3 Japanese QE Transmission Mechanisms ...24
Figure 2-4 Total Assets held by the Fed ($trillion) ...24
Figure 2-5 Changing Compositions in the Fed’s Balance Sheet ...25
Figure 2-6 Short, Medium and Long-Term Treasury Securities held by the Fed ...25
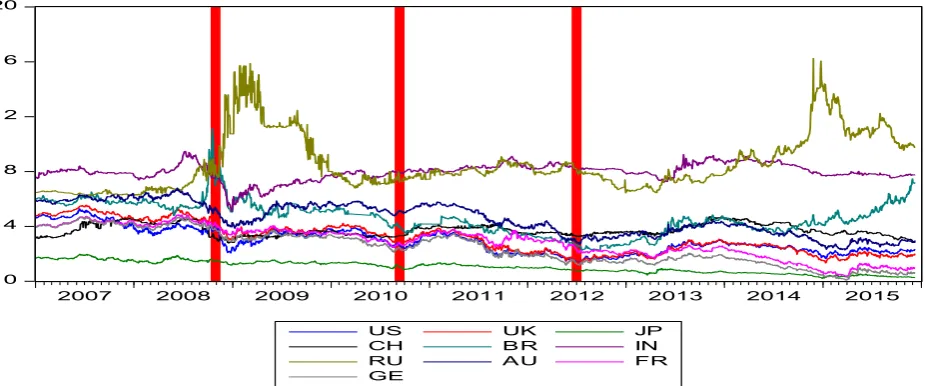
Figure 4-1 Global Bond Yield Movements (2007 to 2016) ...54
Figure 4-2 Daily Differenced Data of Global Bond Yields (2007 to 2016) ...61
Figure 4-3 Impulse Responses to U.S. Bond Shocks (2007 to 2016) ...73
Figure 4-4 Impulse Responses to the U.K. Bond Shocks (2007 to 2016) ...74
Figure 4-5 Impulse Responses to Japanese Bond Shocks (2007 to 2016) ...75
Figure 4-6 Impulse Response to U.S. Bond Shocks during the U.S. QE1 Period ...76
Figure 4-7 Impulse Responses to the U.K. Bond Shocks during the U.S. QE1 Period ...77
Figure 4-8 Impulse Responses to Japanese Bond Shocks during the U.S. QE1 Period ...78
Figure 4-9 Impulse Response to U.S. Bond Shocks during the U.S. QE2 Period ...79
Figure 4-10 Impulse Response to U.K. Bond Shocks during the U.S. QE2 Period ...80
Figure 4-11 Impulse Response to Japanese Bond Shocks during the U.S. QE2 Period ...81
Figure 4-12 Impulse Responses to U.S. Bond Shocks during the U.S. QE3 Period ...82
Figure 4-13 Impulse Responses to U.K. Bond Shocks during the U.S. QE3 Period ...83
Figure 4-14 Impulse Responses to Japanese Bond Shocks during the U.S. QE3 Period ...84
Figure 4-15 Dynamic Conditional Correlation among Markets with Short-and Long-Term QE Shocks (DCC-GARCH) ...87
Chapter 1
Introduction
1.1
Background
After the collapse of the Lehman Brothers in September 2008, major economies around the world
faced severe recessions. The increasing needs to support aggregate demands and ease financial
conditions led to a variety of monetary policy innovations to deal with this “unconventional”
circumstance (Klyuev et al., 2009). Of all the unconventional monetary policies applied, the
Quantitative Easing (QE) strategy seems to be the most popular method of stimulating economies.
QE policy has developed over time, with various changes made since it was first invented. QE has
been defined as the means through which central banks increase the market liquidity level in the
economy through purchasing long-term securities with increasing reserves on central bank balance
sheet (Bernanke & Reinhart, 2004; Benford et al, 2009). Blinder (2010) later concludes that through
these asset purchasing programs, QE policy not only increases the size of bank’s balance sheet but
also, changes the composition of the bank balance sheet as well. More specifically, securities
purchased under QE programs include long-term Treasuries, agency mortgage-backed securities
(MBS), and agency bonds (Krishnamurthy & Vissing-Jorgensen, 2011). The main aim of QE policy is to
lower the long-term interest rates through purchasing long-term assets and therefore spur economic
activity when short-term interest rates are at zero lower bound. Since the government bond
markets, especially the leading government bond markets which have a large volume and are widely
traded, the QE policy of purchasing domestic government bonds implemented in developed
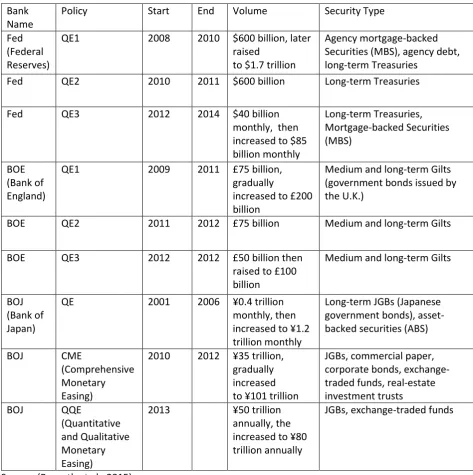
countries such as Japan, United States (U.S.), and the United Kingdom (U.K.) (see Table 1.1) are
Table 1-1 Quantitative Easing Programs in the U.S., U.K. and Japan
Bank Name
Policy Start End Volume Security Type
Fed (Federal Reserves)
QE1 2008 2010 $600 billion, later
raised
to $1.7 trillion
Agency mortgage-backed Securities (MBS), agency debt, long-term Treasuries
Fed QE2 2010 2011 $600 billion Long-term Treasuries
Fed QE3 2012 2014 $40 billion
monthly, then increased to $85 billion monthly Long-term Treasuries, Mortgage-backed Securities (MBS) BOE (Bank of England)
QE1 2009 2011 £75 billion,
gradually
increased to £200 billion
Medium and long-term Gilts (government bonds issued by the U.K.)
BOE QE2 2011 2012 £75 billion Medium and long-term Gilts
BOE QE3 2012 2012 £50 billion then
raised to £100 billion
Medium and long-term Gilts
BOJ (Bank of Japan)
QE 2001 2006 ¥0.4 trillion
monthly, then increased to ¥1.2 trillion monthly
Long-term JGBs (Japanese government bonds), asset-backed securities (ABS)
BOJ CME
(Comprehensive Monetary Easing)
2010 2012 ¥35 trillion, gradually increased to ¥101 trillion
JGBs, commercial paper, corporate bonds, exchange-traded funds, real-estate investment trusts
BOJ QQE
(Quantitative and Qualitative Monetary Easing)
2013 ¥50 trillion
annually, the increased to ¥80 trillion annually
JGBs, exchange-traded funds
Source: (Bernoth et al., 2015)
1.2
QE Policies in Japan
Though unconventional monetary policies, such as the QE policy, have been widely implemented in
the U.S. as well as the U.K., it is widely accepted that the first QE policy was launched in Japan. In the
early 1990s, Japan suffered a persistent depression as a result of the Japanese Asset Pricing Bubble.
The Bank of Japan (BOJ) implemented many conventional means, including cutting interest rates to
stimulate the economy. In September 1995, the BOJ started to cut the overnight rate, gradually
reduced it from 6% to 0.5%; a rate which remained in place until September 1998. Apart from
1999, the BOJ successively lowered the overnight rate to the zero lower bound (Girardin & Moussa,
2011). According to Keynesian economics (1936), once the short-term interest rate is either at, or
close to, zero, the economy slips into the “liquidity trap;” in other words, the common open market
option can no longer lower the interest rate, hence conventional monetary policies cease to be
effective (Krugman et al., 1998). New policies must be created in order to resolve these
circumstances; these policies have become known as unconventional monetary policies. The BOJ
first launched the Zero Interest Rate Policy (ZIRP) during the period of April 1999 to August 2000.
This policy generated some expected results, with the economy recovering and prices stabilising in
2000. However, the economy fell into a further depression with the cessation of the ZIRP in 2001.
These policies are thus ineffective unless they are continued on a long-term basis. In this case, the
BOJ had to implement more aggressive monetary easing policies to further stimulate the economy.
Hence, in March 2001, the BOJ announced the QE policy and began purchasing Japanese
Government Bonds (JGBs) (Ugai, 2007). The BOJ decided to terminate the QE policy and stop buying
government bonds five years later, in March 2006, when the key inflation rate rose and was
expected to remain positive for the foreseeable future. The Japanese QE1 policy achieved great
results. The QE policy provided ample liquidity to the domestic economy and stabilised the domestic
financial system, while simultaneously fulfilling the rising liquidity demands of financial institutions.
The Japanese QE policy commitment to continue zero interest rates,created a perfect environment
which allowed economic recovery (Shirai, 2014).
In 2010, after the 2007 U.S. subprime loan crisis and the resulting global financial crisis, the BOJ
reintroduced the Comprehensive Monetary Easing (CME) programs in response to persistent
economic deflation (Berkmen, 2012). This CME program, announced in October 2010, consisted of
purchasing government securities and corporate bonds to the value of 35 trillion yen. This was
gradually expanded to 101 trillion yen in December 2012. The CME program also included other
liquidity-stimulating components such as equity investments, asset-based lending, and U.S. dollar
lending arrangements to support economic growth. A key goal of the CME program was to establish
price stability in the medium and long term, or more precisely, to achieve a 2% inflation rate (Ugai,
2015).However, this goal has not been achieved.
After Shinzo Abe became the Prime Minister in December 2012, the Japanese government
established a new policy package to end long-term deflation and restore sustained growth, named
“Abenomics.” It included three main “arrows” (components): easy monetary policy, structural
reforms for growth, and “flexible” fiscal policy. Under Abenomics, the BOJ launched their new
(Fukuda, 2014; Ho, 2015). The government’s commitment to achieve its 2% inflation target (already
stated in CME) was renewed in January 2013 and was expected to remain in force for two years. The
BOJ noted however, that the QQE would remain in force for longer than this it was necessary to
maintain the price stability target. The BOJ planned to double the monetary base in two years,
increasing it by ¥60 trillion to ¥70 trillion in a year. The BOJ expanded its Japanese government bond
(JGB) purchase programs to approximately ¥50 trillion annually across all maturities. It also doubled
its exchange-traded fund (EFT) purchases and Japan real estate investment trusts (J-REIT) (Kawai,
2015).
Although the QQE policy managed to increase the inflation rate (to about 1%), it is still far from the
expected 2%. As a result, in October 2014, the BOJ announced it was expanding the current QQE
program (also termed as QQE2) (Coy, 2014).The QQE2 program would increase the monetary base
from ¥60-70 trillion set within the QQE annually to ¥80 trillion. The asset size of BOJ, together with
the monetary base, would increase to approximately 80% of the GDP. The BOJ decided to increase
the Japanese Government Bonds (JGBs) purchases (from 50 trillion to 80 trillion yen) and extend
their maturities (to 7-10 years). At the same time, the BOJ tripled its exchange-traded fund
purchases (ETF) and Japan real estate investment trusts (J-REIT) (expanded from ¥1 trillion to ¥3
trillion, and from ¥30 billion to ¥90 billion, respectively). One of QQE policy’s main purposes was to
transform the inflationary mindset. The BOJ was almost the only buyer of JGBs in the secondary
markets (Ugai, 2015). Therefore, the next step for the BOJ and Japanese government is to deal with
many JGB related issues, including the management of public debt, and the BOJ’s balance sheets.
1.3
QE Policies in the U.S.
In 2007, with the subprime crisis, the U.S. faced its worst recession since 1937-1938 (Blinder, 2010).
As with the Japanese situation, even with short-term market interest rates reduced to almost zero,
the economy failed to revive; conventional methods of stimulating the economy proved largely
unsuccessful. The Federal Reserve (Fed) thus launched a series of unconventional monetary policies
(including QE policy) to stimulate the depressed economy; it lowered long-term interest rates
(Krishnamurthy & Vissing-Jorgensen, 2011). Before the recession, the Fed held around $700 to $800
billion of Treasury notes on its balance sheet. However, after the implementation of the U.S. QE1
policy in late 2008, it gradually accumulated $600 billion of long-term securities, including
Treasuries, agency bonds and agency mortgage-backed securities (MBS). These bonds peaked at
As the recovery of the economy faltered in November 2010, the Fed issued a new quantitative
easing policy (QE2),which involved gradually purchasing $600 billion of long-term Treasuries by the
end of the second quarter of 2011 (Censky, 2010). On the 21st of September 2011, the Fed issued
their new maturity extension policy (MEP). This policy stated that by the end of June 2012, the Fed
would purchase $400 billion of Treasuries, with maturities varying from six to thirty years. At the
same time, the Fed also sold roughly the same amount of Treasuries with maturities between three
months to three years. In other words, without changing the total assets scale, the Fed exchanged
short term Treasuries with long-term securities (Meaning & Zhu, 2011).
On 13 September 2012, the Fed annnounced another quantitative easing policy (QE3). The Fed
implemented a new, open-ended bond purchasing program of $40 billion on a monthly basis. This
was seen as an effective means through which the Fed could reduce $40 billion per month of
commercial housing debts (Jansen, 2012). On 12 December, the Fed raised the assets purchasing
scale from $40 billion to $85 billion per month. Owing to continued positive economic data, on the
19th of June, 2013, the Fed Chairman Bernanke announced that the Fed would reduce its bond
purchasing scale from $85 billion to $65 billion monthly. He also indicated the possibility of exiting
the current QE policy by mid-2014. He mentioned that the Fed might consider increasing short-term
interest rates when the inflation rate reaches 2% and the unemployment rate declines to 6.5%. The
stock markets instantly dropped in response to these signals, with a 4.3% decrease three days after
Bernanke's announcement. The Dow Jones declined 659 points between the 19th and 24th of June,
closing at 14,660 on the 24th of June (Walsh, 2013). Finally, on the 29th of October 2014, the U.S.
QE3 policy was discontinued having added $4.1 trillion of securities to the Fed’s balance sheet.
1.4
QE Policies in the U.K.
In addition to the BOJ and Fed, the Bank of England (BOE) also issued their own unconventional
monetary policies to curb the recession. The BOE cut interest rates sharply, from 5% in early 2008 to
0.5% in March 2009. Unlike its counterparts, the BOE judged that it would be unrealistic to achieve
the 2% target inflation rate without aditional policies (other than the typical way of cutting
short-term nominal interest rates). Thus, the BOE established a new program whereby they made
large-scale purchases of both public and private assets in March 2009. They announced the gradual
purchase of £200 billion of medium and long-term government bonds (gilts), which accounted for
roughly one third of the free-floated gilts. These gilts were valued at approximately 14% of the
nominal GDP. This became known as the U.K. QE1 policy, and was accomplished by January 2010
(Joyce et al., 2011).Most of the gilts purchased were bonds with maturities varying from 5 to 25
were purchased, half of the free-floated gilts with 10 to 25-year maturities and 15% of gilts with
longer-term (over 25 years) maturities were also purchased. In addition to the various gilts
purchased under the U.K. QE1 policy, the BOE also purchased other securities including commercial
paper and corporate bonds; however, these securities were purchased in much smaller quantities
and were sold again by December 2009 (Steeley, 2015). All in all, the U.K. QE1 policy expanded the
size of the BOE’s balance sheet by threefold compared to the pre-crisis period (Fawley & Neely,
2013).
In response to the euro sovereign crisis, and to meet its 2% target inflation rate, the BOE expanded
the U.K. QE1 policy with further purchases of £75 billion in October 2011 (Churm et al., 2015). In
February 2012, the BOE expanded their assets purchase scale to £50 billion; these purchases were
finalised in early May 2012. This was yet another quantitative easing program (the U.K. QE2 policy)
(Steeley & Matyushkin, 2015). Two-month later, in July 2012, the BOE extended the U.K. QE2 policy
with another £50 billion gilts purchasing program (the U.K. QE3 policy), which raised the total assets
purchase ceiling to £375 billion gilts (Bernoth et al., 2015). In September 2015, the BOE announced
that it would maintain the short-term interest rate at 0.5% (set during the U.K. QE1 period) and
would also keep the same scale of assets purchase (£375 billion) decided in July 2012 (Lea, 2015).
1.5
QE Policies in the Euro Zone
When the global financial crisis impacted the countries in the European Union, the European Central
Bank (ECB) reacted differently, using more conventional methods, including interest rate cuts. It
adopted unconventional measures much later than the U.S. Differences between ECB’s and Fed’s
monetary policies could be explained by the different characteristics of the potency (Ferreira, 2015).
Unlike other markets which have control over their domestic currencies, the European Union does
not. It consists of 28-country economies and political partnerships only 19 of the countries share a
common currency (Euro). All of the member countries must approve political or economic measures.
Therefore, the ECB experienced significant difficulty in adopting QE policies to revive the economy.
In relation to the ECB’s government bonds purchase policies, German government and economists
argued that there must be a balance of both monetary and fiscal policy to manage credit default
risks in some EU member countries. However, some researchers (De Grauwe & Ji, 2015; De Groen,
2015) believed that it was possible for the ECB to implement QE policies without creating future
risks, but only if the interest paid by the governments to the ECB were refunded. More specifically,
when some member countries stopped paying interests on the bonds held by the ECB, the ECB could
stop paying interest to the defaulting government. Hence, the ECB would only pay interests to
On the 22nd of January 2015, the ECB announced its first QE program of repurchasing private and
public debts, including government bonds that amounted to between 1,100 and 1,600 billion euro
by the end of 2016, or 60 billion euro per month (Rey & Mazur, 2015). They stated that policy may
continue for a longer period until the target inflation rate is achieved. The ECB QE policy purchased
sovereign bonds as well as investment-rated corporate bonds. There were some special conditions
imposed on some of the bonds, where issuing countries are under reform programs (such as
Greece). The ratio of bonds purchased was decided using the capital key (the GDP weights). The
risk-sharing mechanism designed in the ECB QE policy only covered 20% of the total losses by using the
captial key, while the rest (80% losses induced by the ECB QE policy) were to be borne by the
national central banks (Watt, 2015). Roberto (2016) argued that the ECB QE policy would directly
influence the cost of public debt, which creates inflation and depreciates the real cost of debt at the
same time.
1.6
Consensus of QE
There are several commonalities across countries relating to the implementation and effect of QE
policies. Unconventional monetary policies, like the QE policy, signifcantly lowered long-term asset
yields, not only domestically, but also internationally, though mainly in other developed markets
(Roberto, 2016). This, in turn, had a positive impact on the long-term interest rates by decreasing
them, generating extra liqudity and promoting economic recovery. This process has been
documented in previous research. For example, Bernanke et al. (2004) found that both changes to
relative asset quantities and changes in market expectations about the related assets can affect
asset returns. Similarly, Gagnon et al., (2011); He et al. (2010) and Joyce et al. (2012) found that the
Fed’s purchase of long-term Treasuries and mortgage-backed securities significantly lowered
nominal interest rates on Treasuries, corporate bonds, and mortgage-backed securities during the
early U.S. QE phases (U.S. QE1 and QE2 periods). In terms of Japan, Ugai (2007) concluded that the
government bonds generated lower yields over the Japanese QE period. Likewise, Meier (2009)
discovered that long-term gilt yields declined following the initial U.K. QE announcement in March
2009.
In addition to the impact of QE policies in domestic markets, previous research has also determined
that the implementation of unconventional monetary policies in advanced countries (especially in
the U.S.) not only impacted on developed markets but also emerging ones. For instance, Bredin et al.
(2010) found evidence of significant U.S. spillover effects in both Germany and the U.K. bond
markets. Dahlhaus et al. (2014) found that U.S. QE significantly increased Canadian GDP and import
U.K., Japan and Euro Zone) affected long-term yields, equity prices, and exchange rates in both
developed and developing economies. Kim and Nguyen (2009) also revealed that unexpected U.S.
QE announcements may have led to negative responses in Asian-Pacific stock markets. Moreover,
Bhattarai et al. (2015) found that the U.S. QE policy induced the appreciation of domestic currencies
in emerging markets against the U.S. dollar, growth in emerging stock prices, as well as the capital
inflows to emerging markets. Furthermore, Rogers et al (2014) determined that the U.S. QE spillover
effects on other developed markets were larger than the spillover effects on the U.S. markets from
the QE policies of other advanced economies (such as the U.K. and Japan).
QE policies not only affected market returns, but also market volatility. The U.S. QE policies had an
even more noticeable impact than most. Li & Giles (2015) compared the U.S. and Japanese QE
volatility spillover effects on emerging markets. They found that the U.S. QE volatility spillover
effects were more pronounced than those of the Japanese market on the emerging markets they
sampled. Mukherjee & Bhaduri (2016) found a pronounced increase of volatility in the Brazil, Russia,
India, China and South Africa (BRICS) markets during the U.S. QE periods. However, the authors
noted that these volatility spillover effects gradually disappeared as a result of market adjustments
or stricter regulations in these markets. Ghosh & Saggar (2016) examined the U.S. QE volatility
spillover effects on the BRICS markets and some other emerging markets during the tapering talk
period. The authors noticed a contemporaneous volatility covariance between the U.S. markets and
other emerging markets, both for equities and government securities. Yang & Zhou’s study (2016)
concluded that the U.S. QE policy was the primary driver for intensifying volatility spillover effects in
global stock markets and could explain roughly half of the variations of spillover effects.
A key belief of scholarship is that only unanticipated changes in the target rate affect financial
markets, especially stock markets, whereas anticipated changes do not. This finding is consistent
with the Efficient Market Hypothesis (EMH). The semi-strong-form efficiency hypothesis states that
stock prices can rapidly respond to the latest public information. Thus, there are no excess returns
by trading on that information. Meanwhile, the EMH theory also highlights a negative correlation
between unanticipated changes of the target rate and stock returns. In other words, an
unanticipated increase of the target rate leads to negative stock returns and vice versa (Chuliá et al.,
2010). In this scenario, market volatilities tend to increase in response to unanticipated policy
changes. For example, Gospodinov and Jamali (2012) found that stock volatilities could significantly
and positively increase after the Fed funds rate surprises, while there was no significant response to
the expected target rate change. Kishor and Marfatia (2013) showed a significant and dynamic
U.S. monetary policy surprises. However, the situation was slightly different in the bond markets.
Bredin et al. (2010) found no statistically significant impact from a U.S. monetary policy surprise on
the three chosen markets’ (the U.S., U.K., and Germany) excess bond returns. Thus, although the
unexpected U.S. policy changes were found to influence global stock markets, there was still a gap
on international bond markets.
1.7
Research Problem
The current study examines the spillover effects of the U.S. QE policies on the global bond markets
following the 2008 global financial crisis, in particular, from both bond yield and volatility
perspectives. Meanwhile, there is also study on the market integration changes among the global
bond markets. The results of this study enhances the understanding of bond market interactions
during the crisis period and provides information for policy makers as well as investors about the
international political corporation and investment decision making in especially international bond
markets.
1.8
Research Objectives
a. To investigate changes in the level of market integration in global bond markets during the U.S.
QE phases.
b. To investigate spillover effects of the U.S. QE policy shocks on the global bond yields.
c. To examine U.S. QE volatility spillover effects on the global bond markets.
1.9
Research Contribution
Previous studies have analyzed the impact of the U.S. QE policies (focusing primarily on U.S. QE1 and
QE2 policies) on the financial markets (mainly stock markets) or on real economies. However, few
studies have focused on the global bond markets and even fewer cover the U.S. QE3 period.
Moreover, previous studies apply either the event study approach or the time-series models. Only a
few have included the exogenous U.S. monetary policy shocks into these models. This is the first
study that attempts to assess the cumulative U.S. QE spillover effects from both bond yield and
volatility perspectives on global bond markets for the entire U.S. QE period (covering all three U.S.
QE policies).Exogenous U.S. QE policy shocks will be calculated independently from the models and
distinguished in each U.S. QE phase.
This research expands scholarship on the U.S. QE spillover effects on global bond markets from both
DCC-(T) GARCH and SVAR models are applied. Additionally, unlike most previous studies, which do
not distinguish between U.S. QE policy shocks, here I define both the short-term and long-term
exogenous U.S. QE policy shocks from three different U.S. QE phases. The results of our study will
bridge the gap in the literature by identifying the (volatility) spillover effects of the U.S. QE policies
on different bond markets and assist researchers and investors to better understand the market
responses and movements resulting from uncoventional monetary policies like the QE policies.
1.10
Structure of the Thesis
The thesis is divided into five chapters. Chapter One introduces the research problem and objectives,
identifies the significance of the study and provides background information about specific
quantitative easing policies. Chapter Two reviews relevant literature relating to QE effects. Chapter
Three outlines the research methodology and the data used in this study. Chapter Four reports and
discusses empirical results in relation to each specific research objective. Chapter Five summarizes
the study’s major findings, proposes policy implications, highlights limitation of the research and
provides recommendations for future studies. Ultimately this study argues that during U.S. QE
period, the level of market integration in the international bond markets significantly improves. This
explains the pronounced spillover effects from especially the long-term U.S. QE shocks on decreasing
bond yields in developed markets and increasing bond yield volatilities in emerging markets. These
results suggest an increasing need in cross-market policy coordination with leading economies for
policy makers and a higher requirements for risk management in investing in emerging market
Chapter 2
Literature Review
2.1
Introduction
Having introduced the details of QE policies adopted in developed markets (the U.S., U.K., Japan and
Euro Zone) in the previous chapter, this chapter reviews literature about the formation and
development of the U.S. Quantitative Easing Policies. It also examines some recent empirical
research that investigates both the domestic impact and international spillover effects triggered by
U.S. QE policies. The literature about U.S. QE spillover effects is discussed from both return and
volatility perspectives. Thus, this chapter reviews several strands of literature relating to the
implementation and effect of these policies. More specifically, the chapter explores the rationale for
the shift from conventional to more unconventional monetary policies under liquidity trap. Next, the
chapter details the transmission channels through which QE policy may affect both the domestic and
international financial markets. Besides the literature which is concluded on the domestic impacts of
QE programs, this chapter discusses the theoretical basis of monetary spillover effects on other
countries. Then this chapter reviews the empirical methods used to estimate the QE impact upon
financial variables and the change of market integration level and the spillover effects. The chapter
also outlines the spillover effects of U.S. QE policy on different bond yields as well as the volatility
spillover effect of U.S. QE policy across markets. The chapter ends with a brief summary of the
literature.
2.2
Development of Quantitative Easing
Post 2000, conventional monetary policy has become increasingly unsuitable, especially in the wake
of rapidly falling short-term interest rates in major economies. According to the classical economic
theory, monetary policy tools cease to be effective when short-term interest rate reach zero lower
bound, with no room for further decreases (Krugman et al., 1998). In such circumstances, investors
are unwilling to invest in the financial markets, regardless of liquidity rates .The possibility of
alienating investors, however, does not seem to deter most central banks from modifying their
interest rates. When short-term interest rates led to a liquidity trap, central banks simply adjust
long-term interest rates so as to inject extra liquidity into the depressed economy. Hence, central
banks purchase long-term government bonds in order to reduce long-term interest rates. It is for
these reasons that unconventional monetary policies, such as the QE policy, were developed to spur
2.2.1
Conventional Monetary Policies
Monetary policy has been a key topic of academic discussion since the 1990s. At that time, the main
focus was on examining and quantifying the effects and transmission channels of monetary policies
launched worldwide (Bernanke & Blinder, 1992; Mishkin, 1996). More recently, with the subprime
loan crisis in 2007, there has been a notable increase in research that addresses monetary policies,
with the introduction and implementation of various unconventional monetary policies
(Baltensperger et al., 2007; Bernanke, 2012). Some researchers conclude that monetary policy
typically has two aims (Borio, 1997; Disyatat, 2008; Borio & Nelson, 2008). The first goal is to signal
future policy stances or more specifically, interest rate changes over time, which refers to interest
rate policy. The second relates to the central bank’s balance sheet and how they can achieve this
goal, what is commonly known as balance sheet policy (Borio & Disyatat, 2010). As these methods
are used to manage central bank reserves they are referred to as “liquidity management
operations.”
2.2.1.1 Conventional Monetary Policy
During periods of financial stability (such as before the 2007 subprime loan crisis), monetary policy
generally focused on short-term interest rates and used “interest rate policy,” or conventional
monetary policy. This approach provides information to the markets and is the domain of most
central banks. Using this approach, central banks set an overnight interest target in the interbank
money market through signalling the desired policy rate (Bruno, 2015).
In order to maintain price stability, central banks can lower policy rates during economic downturns
and increase it during economic upturns. The key interest rate can affect the real economy through
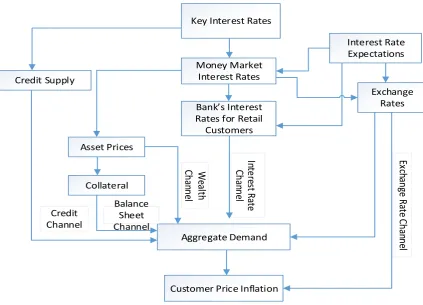
different channels. Figure 2.1 shows how conventional monetary policy influences the real economy
and markets through five different transmission channels: interest rate channel, wealth channel,
Figure 2-1 Conventional Monetary Policy Transmission Channels
Source: https://www.oenb.at/en/Monetary-Policy/How-Monetary-Policy-Works.html
2.2.1.2 Conventional Monetary Policy Transmission Channels
The interest rate channel is the primary means through which conventional monetary policy works
(Kuttner & Mosser, 2002). Any increase in key interest rates trigger an increase in short-term
interest rates through this channel. This, in turn, increases savings, lowers consumption and
investments. When the central bank reduces key interest rates, short-term interest rates also
decrease. Therefore, real interest rates and the cost of capital falls, leading to reduced savings and
higher investment, boosting aggregate demand and likewise inflation.
In the life-cycle model (Ando & Modigliani, 1963), household wealth is a core factor of consumption.
The wealth channel affects the price of both securities such as stocks and bonds, and real estate via
interest rates. Falling interest rates, due to policy changes, can increase the value of these assets
(Kuttner & Mosser, 2002). For example, once the central bank lowers key interest rates, stock prices
increase, since investors discount future dividends with a lower interest rate. Real estate prices
increase because mortgages are cheaper, thus increasing demand for housing. Growing real estate
and stock prices increase householders’ wealth as well as shareholders’, leading to higher
consumption and therefore, to increasing aggregate demand and inflation. Key Interest Rates
Money Market Interest Rates Interest Rate Expectations Exchange Rates Bank’s Interest
Rates for Retail Customers
Aggregate Demand
Customer Price Inflation
The balance sheet channel measures the role of collateral of the central bank’s assets. In a similar
process to the wealth channel, when the central bank decreases key interest rates, asset prices
increase, which leads to a growth in net assets in the balance sheet. Therefore, the value of
collateral on loans increases, thereby increasing lending and investment spending, hence aggregate
demand and inflation. Meanwhile, the changes of the balance sheet’s size also related to the effects
of another channel, the credit channel (Bruno, 2015).
The credit channel refers to the impact of key interest rate on the credit supply. When the central
bank lowers key interest rates, banks pay lower interest rates on households’ deposits and their
balance sheet improves as well. Since banks can refinance themselves more easily, they tend to
finance more loans and thus, increase the credit supply. Consequently, central bank credit easing
leads to more investment, consumption and higher inflation (Mishkin, 1996).
The exchange rate channel represents the impact of changing interest rates on the exchanging of
domestic currency with foreign currencies. When domestic interest rates decrease, domestic assets
become less attractive than foreign assets, which leads to a decline in the value of domestic assets
compared to foreign assets. This decline in the value of domestic assets indicates a depreciation of
the domestic currency. The depreciation of the domestic currency makes domestic products cheaper
than the foreign products, thereby resulting in increasing net exports as well as in aggregate output
(Mishkin, 1995). This channel relies upon the openness of the domestic economy; the more open it
is, the more this channel affects the economy. Transmission via the exchange rate channel directly
affects inflation (Bruno, 2015).
2.2.2
Liquidity Trap
Modifying short-term interest rates is the most efficient means through which central banks can
influence the real economy during non-crisis periods. Increasing key interest rates can cool an
overheated economy (Bruno, 2015). During economic downturns or recession periods, central banks
can lower key interest rates to low levels (even to almost zero) to stimulate depressed economies. If
the central bank fails to boost the aggregate demand and inflation in this situation (when the
short-term nominal interest rate is close to zero) , the real economy falls into what is called the “Zero
Lower Bound” (ZLB) (Bruno, 2015). In ZLB, cutting short-term interest rates cease to be effective,
since the short-term nominal interest rate cannot drop any lower (below zero percent). This causes a
“liquidity trap,” originally defined by Keynes (1936) as a situation in which economic agents prefer
holding cash instead of borrowing money at a very low interest rate, hence pushing down
the system through conventional monetary policy will cease to be effective (Farmer, 2012). For
example, following the 2007 subprime loan crisis, the Fed reduced the policy rate from 5.25 percent
in July 2007 to 0.15 percent in December 2008. In order to deliver further monetary stimulus, the
Fed further lowered the policy rate to -5 percent, well below its lower bound of zero (Rudebusch,
2009). Since the policy rate could not be reduced any further, conventional monetary policies (that
is, through the interest channel) ceased to be effective. The Fed was thus forced to adopt
unconventional policy tools (Fawley & Neely, 2013). The liquidity trap raises concerns about the
credibility of the monetary policy (Krugman et al., 1998). For example, after the Japanese asset price
bubble in the early 1990s, the Japanese economy struggled with a persistent depression. The BOJ
gradually reduced the policy rate to zero lower bound in February 1999 (Girardin & Moussa, 2011).
As there was no room for further reductions, market participants did not believe that the BOJ could
sustain conventional monetary expansions (Ugai, 2007). Therefore, apart from more traditional
counter-cyclical policy measures, central banks should institute unconventional monetary policies
not only to ensure financial stability and spur economic growth, but also to improve economic
environments beyond short-term interbank interest rates (Bean, 2012; Bruno, 2015).
2.2.3
Unconventional Monetary Policy
Compared with interest rate policies, balance sheet policies may influence broader financial
environments more directly. Balance sheet policy decisions influence the economy by changing
either the composition or the size of the central bank’s balance sheet (Disyatat, 2008). Central banks
such as the Fed, BOE and BOJ have adopted balance sheet policies to counter economic
deterioration triggered by the 2008 global financial crisis. In some extreme cases, central banks may
decide to change both the size and structure of their balance sheet at the same time (for example,
the QQE policy in Japan) (Kawai, 2015). These measures are commonly known as “unconventional
monetary policies.” However, not all balance sheet policies are that unconventional. For example,
foreign exchange intervention is one of the most familiar forms of balance sheet policy. This
approach seeks to influence the exchange rate separately from the policy rate by either purchasing
or selling a certain amount of foreign currency. It can therefore either expand or reduce the size of
the central bank’s balance sheet. As it can be separated from the policy rate, it can be adopted
regardless of whether the policy rate is close to zero or not. In other word, in balance sheet policy,
foreign exchange intervention can be exerted at both “conventional” and “unconventional” times
(Borio & Disyatat, 2010).
Unconventional monetary policies fall under two broad categories: quantitative easing (QE) and
strategies are used in response to problems which cannot be solved by many conventional theories
of monetary policy. Once short-term interest rates reaches a liquidity trap and cannot decrease any
further, the central bank attempts to lower long-term interest rates through absorbing an
unprecedented scale of long-term securities, thus effectively enlarging the size of their balance sheet
(Dahlhaus et al., 2014). The purpose of long-term assets purchase programs is to decrease long-term
private borrowing rates. Long-term Treasuries are treated as benchmarks for pricing various private
assets, thus decreasing long-term Treasury yields are expected to decrease the interest rates for
both private securities and loans (Klyuev et al., 2009). Since late 2007, the Fed started to
aggressively lower its federal funds rate target (the policy rate). This came at a time when inflation
was arguably increasing (Curdia & Woodford, 2010). Core interest rates no longer matched U.S.
policy rates as they typically did after August 2007. At this time, there was a dramatically spread
between the London Interbank Offered Rate (LIBOR) and the Overnight Indexed Swap (OIS) Rate.
This exceedingly volatile LIBOR-OIS spread on U.S. dollar was induced by the 2008 global financial
crisis that triggered stress in the U.S. money markets (Ji & In, 2010). Other studies noted that banks
must take the changes to this spread into account when deciding on their monetary policies (such as
Taylor, 1993, 2008). In short, unconventional monetary policies, such as expanding the central bank
credit intermediation, emerged as a means to boost the economy, even after short-term interest
rates reaches the zero lower bound (Gertler & Karadi, 2011). Some researchers (Goodfriend, 2011;
Shiratsuka, 2010) distinguish these unconventional monetary policies from QE and CE policies.
The differences between QE and CE policies have been widely discussed. King (2009) defines QE as
the purchase of securities with higher liquidity, such as government bonds, to stimulate the money
supply. In contrast, policies focused on improving liquidity in certain credit markets, through asset
purchases, are part of CE policy. Other research suggests that QE policy is an expansion of the
central bank balance sheet (especially the money base) without changing the structure of the bank’s
balance sheet (Goodfriend, 2011; Lenza et al., 2010; Shiratsuka, 2010). In other words, central bank
asset portfolios do not alter and the share of each asset category does not change substantially, with
no new assets added into the holding portfolio. On the liability side of the bank’s balance sheet, the
increase in monetary base is reflected in an accumulation of central bank reserves. In terms of the
CE policy, the overall size of the central bank balance sheet stays unchanged, instead, central banks
alter the composition of asset holdings with some unconventional assets replacing conventional
ones. Ugai (2015) further notes that CE policy focuses on the central bank’s asset portfolio, with risky
assets purchasing, while QE policy focuses on the liability side of the central bank balance sheet
through purchasing government bonds. In other words, both QE and CE policies influence the central
2.3
QE Policy Transmission Channels
The 2008 global financial crisis and the subsequent launch of various unconventional monetary
policies in many developed countries, has meant that QE policy, especially the QE policy
transmission channel, has become a hot topic in academia (Krishnamurthy & Vissing-Jorgensen,
2011; Aysun & Hepp, 2011; Bauer & Rudebusch, 2014; Dahlhaus et al., 2014; Ehlers, 2012). This is
because the transmission channel explains how QE policies can affect both domestic and
international markets. Benford et al. (2009) outlines several channels through which the central
banks’ unconventional monetary policies can affect the real economy. Purchases of securities
financed by the central bank’s reserves increase security prices; higher security prices lower
borrowing costs, which in turn promotes investment and consumption. This practice increases asset
holders’ wealth and encourages them to spend their money. The announcement of large asset
purchasing programs can affect the prices of both target assets and other related assets. For
example, QE programs purchasing large amounts of government bonds will lower their yields and
indirectly affect the company bonds at the same time. QE announcements also alter the investors’
future expectations.
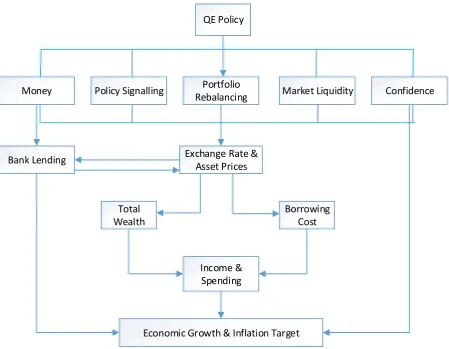
Joyce, Lasaosa, et al. (2011) identified five transmission channels through which QE policy may
influence the real economy: signalling (macro news) channel, portfolio balancing channel, liquidity
channel, bank lending channel and confidence channel (see Figure 2.2). Park and Um (2015) suggest
that unconventional monetary policies such as QE policies can influence asset prices and foreign
exchange rates through three of these channels (signalling channel, portfolio rebalancing channel
and liquidity channel), which indicates that QE policies not only impact the domestic economy and
markets, but also the international market due to the spillover effects. It is thus necessary to
QE Policy
Money Policy Signalling Portfolio
Rebalancing Market Liquidity Confidence
Bank Lending Exchange Rate &
Asset Prices
Total Wealth
Borrowing Cost
Income & Spending
Economic Growth & Inflation Target
Figure 2-2 Unconventional Monetary Policy Transmission Channels
Source: Adapted from Bruno (2015); Joyce, Tong, et al. (2011)
2.3.1
Signalling Channel
QE purchase announcements convey information to market participants about the economic
environments and how central banks may react to future developments. This channel can capture
information about future policy rates, and thus is also known as the macro or policy news channel
(Joyce, et al., 2011). QE policy is far more likely to influence the real economy than conventional
monetary policy. This is because QE policy aims to alter long-term interest rates. Further, monetary
policy effectiveness relates to signalling effects, especially in terms of financial indicators (such as
long-term interest rates), which reflect future monetary policy expectations. The monetary policy
stance should be assessed in terms of expected future monetary policy intentions rather than the
current setting of short-term nominal interest rates (Andersson et al., 2006). In regards to the future
of the short-term interest rate path, the information conveyed through this channel can be both
direct (explicit) and indirect (implicit) (Woodford, 2012). It not only affects the bond yields, but also
there are many debates about the impact of QE policies through this channel. Joyce, et al. (2011)
found the overall impact on yields or prices are ambiguous. Typically, safe, long-term government
bond yields can be decomposed into the sum of the average short-term interest rates over the
maturity of the bonds (the risk-neutral rates) and the term premium. In specific, the term premium
can compensate investors for the uncertainty induced by holding bonds for long period (such as
uncertainty of future inflation rates). Concerns about future inflation rates are often cited as one of
the reasons why investors sell their long-term bonds (Bauer & Rudebusch, 2014; Kim & Wright,
2005). QE announcements may suggest lower future rates in the short run, but can also indicate
higher future inflation rates, which can mean either lower or high yields. According to Gagnon et al.
(2011), the Fed does not use QE policies to signal future short-term policy rates. Hence, the U.S. QE
policies may play a more important role in signalling future long-term interest rates.
2.3.2
Portfolio Balancing Channel
Research on the portfolio balancing channel1 has been transformed since its inception, in the work
of Tobin (1958) and Brunner and Meltzer (1973). Based on conventional New Keynesian theories, QE
policies cannot influence broader economic environments. Eggertsson (2003) claims that there are
no portfolio balance effects for QE policies since the decrease in private sector portfolio risks can be
offset by a corresponding increase in the riskiness of public sector portfolios due to the uncertainty
of future taxes and spending. He suggests that the cancelling out of these risks makes QE policies
ineffective in the portfolio rebalancing channel. However, other studies (Andrés et al., 2004;
Harrison, 2012) argue that if incomplete markets, financial frictions, and imperfect substitutes
between different assets have been taken into consideration, then QE policies can influence asset
prices by altering the supply and maturity structure of different securities. Bernanke (2010) contends
that QE policies work primarily through the portfolio balancing channel by altering the quantity of
various securities held by the public. Based on the assumption of imperfect substitutability between
different assets, QE purchasing programs lead investors’ to rebalance their asset portfolios. The
changes in net supply of one asset within investors’ portfolios influence their yields and other
relative assets. Impacts can be felt immediately after QE policy announcements may take longer, as
investors adjust their portfolios. When the central bank absorbs securities (such as long-term
Treasuries), sellers’ money increases. Since money cannot be a perfect substitute for the sold
securities, sellers must rebalance their portfolios through purchasing better substitute securities
(Dale, 2010; Joyce, Lasaosa, et al., 2011). During this process, security prices will continue to increase
1 Portfolio balance channel is also known as the “term premium” channel (Glick & Leduc, 2012) or the
until investors are willing to maintain the overall supplies of securities and money. Yields and
borrowing costs will decrease, which in turn stimulates spending through raising asset holders’ total
wealth. As QE policies (especially the U.S. QE policies) purchase large scale, long-term Treasuries and
other term risky assets, they may also reduce the term premium (the spread between
long-term and short-long-term interest rates) and risk premium (spread between risky securities and the
risk-neutral securities) through the portfolio rebalancing channel (Gagnon et al., 2010; Joyce et al.,
2011).
More importantly, the U.S. QE effects can also spread to other financial markets through the
portfolio rebalancing channel. Since the U.S. dollar is the dominant reserve currency in the global
economy, the U.S. Treasuries play a special role in the global financial markets and cannot be
perfectly substituted by other sovereign or private debt instruments (Neely, 2010). When the U.S.
QE policy reduces the U.S. long-term bond yields, investors may turn to other securities (issued on
the market from countries other than the U.S.) of similar maturities, for larger returns. This could
stimulate security prices and decrease long-term interest rates in financial markets other than the
U.S. As a result, it effectively injects more liquidity into the real economies. Therefore, owing to
globalization and concomitant growing market integration level, the spillover effect from a domestic
monetary easing policy in a leading economy (especially from the U.S.) is inevitable, though the size
of such spillover effect may vary across markets based on the strength of cross-border transmission
channels (Chen et al., 2012).
2.3.3
The Liquidity Channel
Unlike the signalling and the portfolio balance channels, which may decrease bond yields, central
banks can raise the yields of some securities via the liquidity channel. When implementing QE
policies, central banks purchase long-term securities in the market and pay back by increasing
reserve on banks’ balance sheets. The increasing liquidity level can ease banks’ credit levels and
allow banks to provide more loans to investors (Park & Um, 2015). Since the reserves are of higher
liquidity than the long-term securities, the QE policy of increasing market liquidity levels can
decrease liquidity premium on most of liquid bonds. It is widely thought that treasury bonds carry a
liquidity price premium, and that liquidity premium is higher during periods of severe crisis. At these
times, markets becomes more volatile and riskier. Thus, more liquid assets will be valued higher and
the liquidity premium enlarges. QE policy can expand liquidity, which in turn leads to a reduction in
liquidity premiums and increases Treasury yields (Krishnamurthy & Vissing-Jorgensen, 2011).
purchase periods since this channel relies heavily upon the capital flow generated by the asset
purchases.
2.3.4
The Bank Lending Channel
The bank lending channel can be considered as a supplementary channel of the monetary policy. As
previously stated, QE policy releases a large scale of liquidity to the banks; this means that banks can
increase their levels of credit and lending (Joyce et al., 2011; Butt et al., 2014). The operation of bank
lending channel relies heavily on the supply of loans and credits which banks provide. Changes in
banks’ loans supply also impact upon the real economy (Apergis et al., 2014). When securities are
purchased from non-banking sectors, the banking sector obtains extra reserves from the central
bank and a corresponding growth in the deposit sector. Although these transactions seem to
contemporaneously alter deposits from non-banking sectors, Butt et al. (2014) found that these
changes have limited impact on the lending sector. Furthermore, they suggest that if the QE policy of
raising deposits are short-lived in any given bank, then the bank lending channel diminishes. Joyce
and Spaltro (2014) also conclude that the QE policy effect in altering bank lending is limited.
2.3.5
The Confidence Channel
Higher asset prices induced by asset purchases may have broader confidence effects on financial
assets (Joyce et al., 2011). It may alter investors’ risk appetite and investors’ portfolio decisions as
well as the security prices (Fratzscher et al., 2018). For instance, U.S. QE policy announcements can
be considered as a signal of deteriorating future economic conditions, as a result, it may encourage
the sale of assets or trigger a flight to safety2. This signal can also enlarge the portfolio rebalance
activities in especially international market and thus, enhancing the spillover effects of U.S. QE
policies (Neely, 2010).
2.3.6
Summary
Previous literature (Park & Um, 2015) demonstrates that there are three major channels through
which QE policy can affect other countries: the signalling channel, the portfolio rebalancing channel
and the liquidity channel. Information regarding reducing interest rates can lead to increasing
interest differential between the U.S. and other countries, therefore inducing capital flows into
other countries. In turn, this process affects prices and trading volume of foreign-held securities.
Owing to the imperfect substitutability between assets in various markets, the U.S. QE policy
2 Flight to safety refers to when investors move their capital from riskier investments to ‘safer’ programs