Comparing Multi-label Classification with Reinforcement Learning for
Summarisation of Time-series Data
Dimitra Gkatzia, Helen Hastie, and Oliver Lemon
School of Mathematical and Computer Sciences, Heriot-Watt University, Edinburgh {dg106, h.hastie, o.lemon}@hw.ac.uk
Abstract
We present a novel approach for automatic report generation from time-series data, in the context of student feedback genera-tion. Our proposed methodology treats content selection as a multi-label (ML) classification problem, which takes as in-put time-series data and outin-puts a set of templates, while capturing the dependen-cies between selected templates. We show that this method generates output closer to the feedback that lecturers actually gener-ated, achieving 3.5% higher accuracy and 15% higher F-score than multiple simple classifiers that keep a history of selected templates. Furthermore, we compare a ML classifier with a Reinforcement Learn-ing (RL) approach in simulation and usLearn-ing ratings from real student users. We show that the different methods have different benefits, with ML being more accurate for predicting what was seen in the training data, whereas RL is more exploratory and slightly preferred by the students.
1 Introduction
Summarisation of time-series data refers to the task of automatically generating text from vari-ables whose values change over time. We con-sider the task of automatically generating feed-back summaries for students describing their per-formance during the lab of a Computer Science module over the semester. Students’ learning can be influenced by many variables, such as difficulty of the material (Person et al., 1995), other dead-lines (Craig et al., 2004), attendance in lectures (Ames, 1992), etc. These variables have two im-portant qualities. Firstly, they change over time, and secondly they can be dependent on or inde-pendent of each other. Therefore, when generating
feedback, we need to take into account all vari-ables simultaneously in order to capture potential dependencies and provide more effective and use-ful feedback that is relevant to the students.
In this work, we concentrate on content selec-tion which is the task of choosing what to say, i.e. what information is to be included in a report (Reiter and Dale, 2000). Content selection deci-sions based on trends in time-series data determine the selection of the useful and important variables, which we refer to here asfactors, that should be conveyed in a summary. The decisions of factor selection can be influenced by other factors that their values are correlated with; can be based on the appearance or absence of other factors in the summary; and can be based on the factors’ be-haviour over time. Moreover, some factors may have to be discussed together in order to achieve some communicative goal, for instance, a teacher might want to refer to student’s marks as a moti-vation for increasing the number of hours studied. We frame content selection as a simple classifi-cation task: given a set of time-series data, decide for each template whether it should be included in a summary or not. In this paper, with the term ‘template’ we refer to a quadruple consisting of an
id, a factor (bottom left of Table 1), a reference type (trend, weeks, average, other) and surface text. However, simple classification assumes that the templates are independent of each other, thus the decision for each template is taken in isolation from the others, which is not appropriate for our domain. In order to capture the dependencies in the context, multiple simple classifiers can make the decisions for each template iteratively. After each iteration, the feature space grows by 1 fea-ture, in order to include the history of the previous template decisions. Here, we propose an alterna-tive method that tackles the challenge of interde-pendent data by using multi-label (ML) classifica-tion, which is efficient in taking data dependencies
Raw Data
factors week 2 week 3 ... week 10
marks 5 4 ... 5
hours studied 1 2 ... 3 ... ... ... ... ...
Trends from Data
factors trend
(1) marks (M) trend other (2) hours studied (HS) trend increasing (3) understandability (Und) trend decreasing (4) difficulty (Diff) trend decreasing (5) deadlines (DL) trend increasing (6) health issues (HI) trend other (7) personal issues (PI) trend decreasing (8) lectures attended (LA) trend other (9) revision (R) trend decreasing
Summary
Your overall performance was excellent
during the semester. Keep up the good work and maybe try some more challeng-ing exercises. Your attendance was vary-ingover the semester. Have a think about how to use time in lectures to improve your understanding of the material. You spent2 hours studying the lecture material on average. You should dedicate more time to study. You seem to find the material
[image:2.595.85.525.69.303.2]easier to understand compared to the beginning of the semester. Keep up the good work! You revisedpart ofthe learn-ing material. Have a think whether revis-ing has improved your performance.
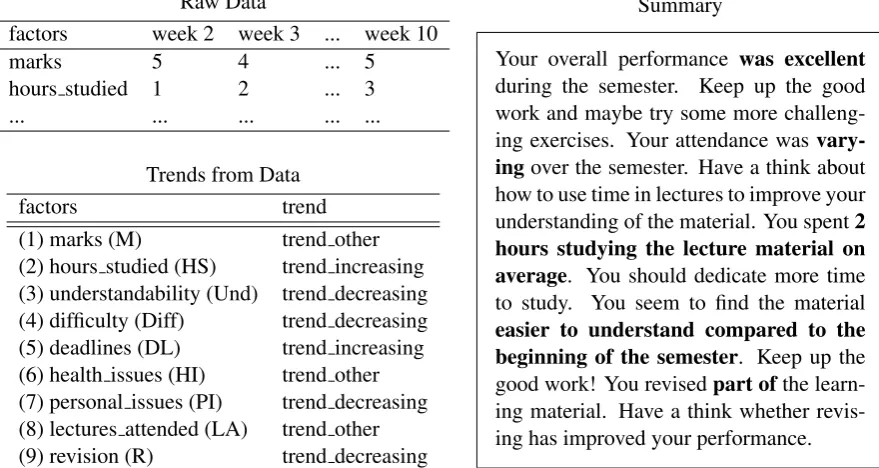
Table 1: The table on the top left shows an example of the time-series raw data for feedback generation. The table on the bottom left shows an example of described trends. The box on the right presents a target summary (target summaries have been constructed by teaching staff).
into account and generating a set of labels (in our case templates) simultaneously (Tsoumakas et al., 2010). ML classification requires no history, i.e. does not keep track of previous decisions, and thus has a smaller feature space.
Our contributions to the field are as follows: we present a novel and efficient method for tackling the challenge of content selection using a ML clas-sification approach; we applied this method to the domain of feedback summarisation; we present a comparison with an optimisation technique (Rein-forcement Learning), and we discuss the similari-ties and differences between the two methods.
In the next section, we refer to the related work on Natural Language Generation from time-series data and on Content Selection. In Section 4.2, we describe our approach and we carry out a compar-ison with simple classification methods. In tion 5, we present the evaluation setup and in Sec-tion 6 we discuss the results, obtained in simula-tion and with real students. Finally, in Secsimula-tion 8, directions for future work are discussed.
2 Related Work
Natural Language Generation from time-series data has been investigated for various tasks such as weather forecast generation (Belz and Kow, 2010; Angeli et al., 2010; Sripada et al., 2004), report generation from clinical data (Hunter et al.,
2011; Gatt et al., 2009), narrative to assist children with communication needs (Black et al., 2010) and audiovisual debrief generation from sensor data from Autonomous Underwater Vehicles missions (Johnson and Lane, 2011).
The important tasks of time-series data sum-marisation systems arecontent selection(what to say), surface realisation(how to say it) and infor-mation presentation(Document Planning, Order-ing, etc.). In this work, we concentrate on content selection. Previous methods for content selection include Reinforcement Learning (Rieser et al., 2010); multi-objective optimisation (Gkatzia et al., 2014); Gricean Maxims (Sripada et al., 2003); Integer Linear Programming (Lampouras and An-droutsopoulos, 2013); collective content selection (Barzilay and Lapata, 2004); interest scores as-signed to content (Androutsopoulos et al., 2013); a combination of statistical and template-based ap-proaches to NLG (Kondadadi et al., 2013); statis-tical acquisition of rules (Duboue and McKeown, 2003) and the Hidden Markov model approach for Content Selection and ordering (Barzilay and Lee, 2004).
collective content selection requires the considera-tion of an individual preference score (which is de-fined as the preference of the entity to be selected or omitted, and it is based on the values of entity attributes and is computed using a boosting algo-rithm) and the identification of links between the entities with similar labels. In contrast, ML clas-sification does not need the computation of links between the data and the templates. ML classi-fication can also apply to other problems whose features are correlated, such as text classification (Madjarov et al., 2012), when an aligned dataset is provided.
ML classification algorithms have been divided into three categories: algorithm adaptation ods, problem transformation and ensemble meth-ods (Tsoumakas and Katakis, 2007; Madjarov et al., 2012). Algorithm adaptation approaches (Tsoumakas et al., 2010) extend simple classifi-cation methods to handle ML data. For exam-ple, the k-nearest neighbour algorithm is extended to kNN by Zhang and Zhou (2007). ML-kNN identifies for each new instance its k nearest neighbours in the training set and then it predicts the label set by utilising the maximum a posteri-ori principle according to statistical information derived from the label sets of the k neighbours. Problem transformation approaches (Tsoumakas and Katakis, 2007) transform the ML classifica-tion task into one or more simple classificaclassifica-tion tasks. Ensemble methods (Tsoumakas et al., 2010) are algorithms that use ensembles to perform ML learning and they are based on problem transfor-mation or algorithm adaptation methods. In this paper, we applied RAkEL (Random k-labelsets) (Tsoumakas et al., 2010): an ensemble problem transformation method, which constructs an en-semble of simple-label classifiers, where each one deals with a random subset of the labels.
Finally, our domain for feedback generation is motivated by previous studies (Law et al., 2005; van den Meulen et al., 2010) who show that text summaries are more effective in decision making than graphs therefore it is advantageous to provide a summary over showing users the raw data graph-ically. In addition, feedback summarisation from time-series data can be applied to the field of In-telligent Tutoring Systems (Gross et al., 2012).
3 Data
The dataset consists of 37 instances referring to the activities of 26 students. For a few students there is more than 1 instance. An example of one such instance is presented in Table 1. Each in-stance includes time-series information about the student’s learning habits and the selected tem-plates that lecturers used to provide feedback to this student. The time-series information includes for each week of the semester: (1) the marks achieved at the lab; (2) the hours that the stu-dent spent studying; (3) the understandability of the material; (4) the difficulty of the lab exercises as assessed by the student; (5) the number of other deadlines that the student had that week; (6) health issues; (7) personal issues; (8) the number of lec-tures attended; and (9) the amount of revision that the student had performed. The templates describe these factors in four different ways:
1. <trend>: referring to the trend of a fac-tor over the semester (e.g. “Your performance
was increasing...”),
2. <weeks>: explicitly describing the factor value at specific weeks (e.g. “Inweeks 2, 3 and 9...”),
3. <average>: considering the average of a factor value (e.g. “You dedicated 1.5 hours studying on average...”), and
4. <other>: mentioning other relevant infor-mation (e.g. “Revising material will improve your performance”).
For the corpus creation, 11 lecturers selected the content to be conveyed in a summary, given the set of raw data (Gkatzia et al., 2013). As a result, for the same student there are various summaries provided by the different experts. This character-istic of the dataset, that each instance is associated with more than one solution, additionally moti-vates the use of multi-label classification, which is concerned with learning from examples, where each example is associated with multiple labels.
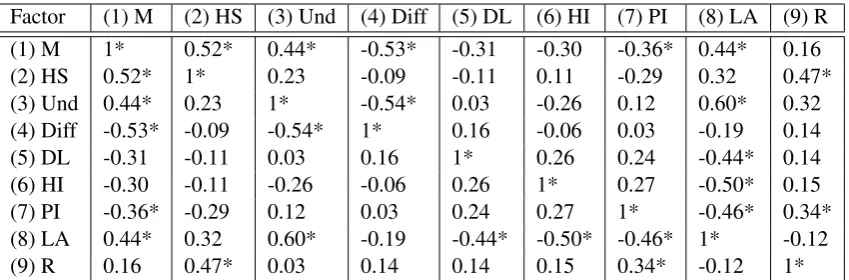
Factor (1) M (2) HS (3) Und (4) Diff (5) DL (6) HI (7) PI (8) LA (9) R (1) M 1* 0.52* 0.44* -0.53* -0.31 -0.30 -0.36* 0.44* 0.16 (2) HS 0.52* 1* 0.23 -0.09 -0.11 0.11 -0.29 0.32 0.47* (3) Und 0.44* 0.23 1* -0.54* 0.03 -0.26 0.12 0.60* 0.32 (4) Diff -0.53* -0.09 -0.54* 1* 0.16 -0.06 0.03 -0.19 0.14 (5) DL -0.31 -0.11 0.03 0.16 1* 0.26 0.24 -0.44* 0.14 (6) HI -0.30 -0.11 -0.26 -0.06 0.26 1* 0.27 -0.50* 0.15 (7) PI -0.36* -0.29 0.12 0.03 0.24 0.27 1* -0.46* 0.34* (8) LA 0.44* 0.32 0.60* -0.19 -0.44* -0.50* -0.46* 1* -0.12 (9) R 0.16 0.47* 0.03 0.14 0.14 0.15 0.34* -0.12 1* Table 2: The table presents the Pearson’s correlation coefficients of the factors (* meansp<0.05).
4 Methodology
In this section, the content selection task and the suggested multi-label classification approach are presented. The development and evaluation of the time-series generation system follows the follow-ing pipeline (Gkatzia et al., 2013):
1. Time-Series data collection from students 2. Template construction by Learning and
Teaching (L&T) expert
3. Feedback summaries constructed by lectur-ers; random summaries rated by lecturers 4. Development of time-series generation
sys-tems (Section 4.2, Section 5.3): ML system, RL system, Rule-based and Random system 5. Evaluation: (Section 5)
- Offline evaluation (Accuracy and Reward) - Online evaluation (Subjective Ratings)
4.1 The Content Selection Task
Our learning task is formed as follows: given a set of 9 time-series factors, select the content that is most appropriate to be included in a summary. Content is regarded as labels (each template rep-resents a label) and thus the task can be thought of as a classification problem. As mentioned, there are 4 ways to refer to a factor: (1) describing the trend, (2) describing what happened in every time stamp, (3) mentioning the average and (4) making another general statement. Overall, for all factors there are 29 different templates1. An example of
the input data is shown in Table 1. There are two decisions that need to be made: (1) whether to talk about a factor and (2) in which way to refer to it. Instead of dealing with this task in a hierarchical way, where the algorithm will first learn whether to talk about a factor and then to decide how to
1There are fewer than 36 templates, because for some
fac-tors there are less than 4 possible ways of referring to them.
refer to it, we transformed the task in order to re-duce the learning steps. Therefore, classification can reduce the decision workload by deciding ei-ther in which way to talk about it, or not to talk about a factor at all.
4.2 The Multi-label Classification Approach
Traditional single-label classification is the task of identifying which label one new observation is as-sociated with, by choosing from a set of labelsL
(Tsoumakas et al., 2010). Multi-label classifica-tion is the task of associating an observaclassifica-tion with a set of labelsY ⊆L(Tsoumakas et al., 2010).
One set of factor values can result in various sets of templates as interpreted by the different experts. A ML classifier is able to make deci-sions for all templates simultaneously and cap-ture these differences. The RAndom k-labELsets (RAkEL) (Tsoumakas et al., 2010) was applied in order to perform ML classification. RAkEL is based on Label Powerset (LP), a problem transfor-mation method (Tsoumakas et al., 2010). LP ben-efits from taking into consideration label correla-tions, but does not perform well when trained with few examples as in our case (Tsoumakas et al., 2010). RAkEL overcomes this limitation by con-structing a set of LP classifiers, which are trained with different random subsets of the set of labels (Tsoumakas et al., 2010).
The LP method transforms the ML task, into one single-label multi-class classification task, where the possible set of predicted variables for the transformed class is the powerset of labels present in the original dataset. For instance, the set of labelsL={temp0, temp1, ...temp28}could be
transformed to {temp0,1,2, temp28,3,17,...}. This
Classifier Accuracy Precision Recall F score (10-fold)
[image:5.595.112.490.62.162.2]Decision Tree (no history) *75.95% 67.56 75.96 67.87 Decision Tree (with predicted history) **73.43% 65.49 72.05 70.95 Decision Tree (with real history) **78.09% 74.51 78.11 75.54 Majority-class (single label) **72.02% 61.73 77.37 68.21 RAkEL (multi-label) (no history) 76.95% 85.08 85.94 85.50
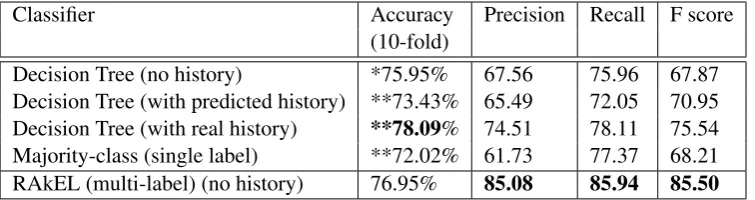
Table 3: Average, precision, recall and F-score of the different classification methods (T-test, * denotes significance withp<0.05and ** significance withp<0.01, when comparing each result to RAkEL).
et al., 2010). RAkEL tackles this problem by con-structing an ensemble of LP classifiers and train-ing each one on a different random subset of the set of labels (Tsoumakas et al., 2010).
4.2.1 The Production Phase of RAkEL
The algorithm was implemented using the MU-LAN Open Source Java library (Tsoumakas et al., 2011), which is based on WEKA (Witten and Frank, 2005). The algorithm works in two phases: 1. the production of an ensemble of LP
algo-rithms, and
2. the combination of the LP algorithms. RAkEL takes as input the following parameters: (1) the numbers of iterations m (which is devel-oper specified and denotes the number of models that the algorithm will produce), (2) the size of la-belsetk(which is also developer specified), (3) the set of labelsL, and (4) the training setD. During the initial phase it outputs an ensemble of LP clas-sifiers and the corresponding k-labelsets. A pseu-docode for the production phase is shown below:
Algorithm 1RAkEL production phase
1 : I n p u t : i t e r a t i o n s m, k l a b e l s e t s , l a b e l s L , t r a i n i n g d a t a D 2 : f o r i =0 t o m
3 : S e l e c t random k−l a b e l s e t from L 4 : T r a i n an LP on D
5 : Add LP t o ensemble 6 : end f o r
7 : Output : t h e ensemble of LPs
with c o r r e s p o n d i n g k−l a b e l s e t s
4.2.2 The Combination Phase
During the combination phase, the algorithm takes as input the results of the production phase, i.e. the ensemble of LPs with the corresponding k -labelsets, the set of labelsL, and the new instance
x and it outputs the result vector of predicted la-bels for instancex. During run time, RAkEL
es-timates the average decision for each label in L
and if the average is greater than a thresholdt (de-termined by the developer) it includes the label in the predicted labelset. We used the standard pa-rameter values oft, kandm (t= 0.5, k = 3 and
m equals to 58 (2*29 templates)). In future, we could perform parameter optimisation by using a technique similar to (Gabsdil and Lemon, 2004).
5 Evaluation
Firstly, we performed a preliminary evaluation on classification methods, comparing our proposed ML classification with multiple iterated classifica-tion approaches. The summaries generated by the ML classification system are then compared with the output of a RL system and two baseline sys-tems in simulation and with real students.
5.1 Comparison with Simple Classification
We compared the RAkEL algorithm with single-label (SL) classification. Different SL classifiers were trained using WEKA: JRip, Decision Trees, Naive Bayes, k-nearest neighbour, logistic regres-sion, multi-layer perceptron and support vector machines. It was found out that Decision Trees achieved on average 3% higher accuracy. We, therefore, went on to use Decision Trees that use generation history in three ways.
Firstly, for Decision Tree (no history), 29 decision-tree classifiers were trained, one for each template. The input of these classifiers were the 9 factors and each classifier was trained in order to decide whether to include a specific template or not. This method did not take into account other selected templates – it was only based on the time-series data.
as well as the set of time-series data in order to emulate the dependencies in the dataset. For in-stance, classifiernwas trained using the data from the 9 factors and the template decisions for tem-plates0ton−1.
Thirdly, for Decision Tree (with real his-tory), the real, expert values were used rather than the predicted ones in the history. The above-mentioned classifiers are compared with, theMajority-class (single label)baseline, which labels each instance with the most frequent tem-plate.
The accuracy, the weighted precision, the weighted recall, and the weighted F-score of the classifiers are shown in Table 3. It was found that in 10-fold cross validation RAkEL performs sig-nificantly better in all these automatic measures (accuracy = 76.95%, F-score = 85.50%). Remark-ably, ML achieves more than 10% higher F-score than the other methods (Table 3). The average accuracy of the single-label classifiers is 75.95% (10-fold validation), compared to 73.43% of clas-sification with history. The reduced accuracy of the classification with predicted history is due to the error in the predicted values. In this method, at every step, the predicted outcome was used in-cluding the incorrect decisions that the classifier made. The upper-bound accuracy is 78.09% cal-culated by using the expert previous decisions and not the potentially erroneous predicted decisions. This result is indicative of the significance of the relations between the factors showing that the pre-dicted decisions are dependent due to existing cor-relations as discussed in Section 1, therefore the system should not take these decisions indepen-dently. ML classification performs better because it does take into account these correlations and de-pendencies in the data.
5.2 The Reinforcement Learning System
Reinforcement Learning (RL) is a machine learn-ing technique that defines how an agent learns to take optimal actions so as to maximise a cumu-lative reward (Sutton and Barto, 1998). Content selection is seen as a Markov Decision problem and the goal of the agent is to learn to take the quence of actions that leads to optimal content se-lection. The Temporal Difference learning method was used to train an agent for content selection.
Actions and States: The state consists of the time-series data and the selected templates. In
or-der to explore the state space the agent selects a factor (e.g. marks, deadlines etc.) and then decides whether to talk about it or not.
Reward Function: The reward function reflects the lecturers’ preferences on summaries and is derived through linear regression analysis of a dataset containing lecturer constructed summaries and ratings of randomly generated summaries. Specifically, it is the following cumulative multi-variate function:
Reward=a+∑n i=1
bi∗xi+c∗length
where X = {x1, x2, ..., xn} describes the
com-binations of the data trends observed in the time-series data and a particular template.a,bandcare the regression coefficients, and their values vary from -99 to 221. The value ofxi is given by the
function:
xi=
1, the combination of a factor trend and a template type is included in a summary
0, if not.
The RL system differs from the classification system in the way it performs content selection. In the training phase, the agent selects a factor and then decides whether to talk about it or not. If the agent decides to refer to a factor, the template is selected in a deterministic way, i.e. from the avail-able templates it selects the template that results in higher expected cumulative future reward.
5.3 The Baseline Systems
We compared the ML system and the RL system with two baselines described below by measuring the accuracy of their outputs, the reward achieved by the reward function used for the RL system, and finally we also performed evaluation with stu-dent users. In order to reduce the confounding variables, we kept the ordering of content in all systems the same, by adopting the ordering of the rule-based system. The baselines are as follows:
1. Rule-based System: generates summaries based on Content Selection rules derived by work-ing with a L&T expert and a student (Gkatzia et al., 2013).
Time-Series Accuracy Reward Rating Mode (mean) Data Source Summarisation Systems
Multi-label Classification 85% 65.4 7 (6.24) Lecturers’ constructed summaries Reinforcement Learning **66% 243.82 8 (6.54) Lecturers’ ratings & summaries Rule-based **65% 107.77 7, 8 (5.86) L&T expert
[image:7.595.75.557.63.148.2]Random **45.2% 43.29 *2 (*4.37) Random
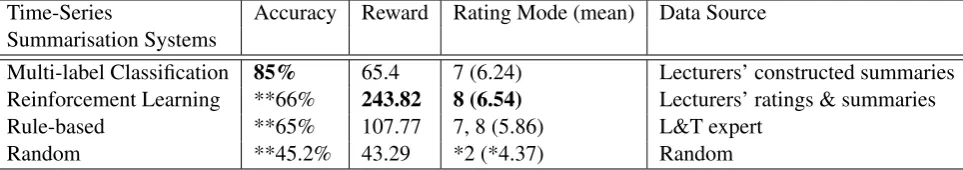
Table 4: Accuracy, average rewards (based on lecturers’ preferences) and averages of the means of the student ratings. Accuracy significance (Z-test) with RAkEL atp<0.05is indicated as * and atp<0.01
as **. Student ratings significance (Mann Whitney U test) with RAkEL atp<0.05is indicated as *.
6 Results
Each of the four systems described above gener-ated 26 feedback summaries corresponding to the 26 student profiles. These summaries were evalu-ated in simulation and with real student users.
6.1 Results in Simulation
Table 4 presents the accuracy, reward, and mode of student rating of each algorithm when used to generate the 26 summaries. Accuracy was esti-mated as the proportion of the correctly classified templates to the population of templates. In or-der to have a more objective view on the results, the score achieved by each algorithm using the reward function was also calculated. ML clas-sification achieved significantly higher accuracy, which was expected as it is a supervised learning method. The rule-based system and the RL tem have lower accuracy compared to the ML sys-tem. There is evidently a mismatch between the rules and the test-set; the content selection rules are based on heuristics provided by a L&T Expert rather than by the same pool of lecturers that cre-ated the test-set. On the contrary, the RL is trained to optimise the selected content and not to repli-cate the existing lecturer summaries, hence there is a difference in accuracy.
Accuracy measures how similar the generated output is to the gold standard, whereas the reward function calculates a score regarding how good the output is, given an objective function. RL is trained to optimise for this function, and therefore it achieves higher reward, whereas ML is trained to learn by examples, therefore it produces out-put closer to the gold standard (lecturer’s produced summaries). RL uses exploration and exploitation to discover combinations of content that result in higher reward. The reward represents predicted ratings that lecturers would give to the summary. The reward for the lecturers’ produced summaries
is 124.62 and for the ML method is 107.77. The ML classification system performed worse than this gold standard in terms of reward, which is ex-pected given the error in predictions (supervised methods learn to reproduce the gold standard). Moreover, each decision is rewarded with a dif-ferent value as some combinations of factors and templates have greater or negative regression coef-ficients. For instance, the combination of the fac-tors “deadlines” and the template that corresponds to <weeks> is rewarded with 57. On the other hand, when mentioning the<average>difficulty the summary is “punished” with -81 (see descrip-tion of the reward funcdescrip-tion in Secdescrip-tion 5.2). Conse-quently, a single poor decision in the ML classifi-cation can result in much less reward.
6.2 Subjective Results with Students
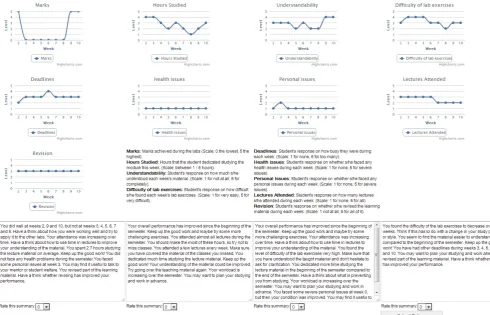
37 first year computer science students partici-pated in the study. Each participant was shown a graphical representation of the time-series data of one student and four different summaries gen-erated by the four systems (see Figure 1). The or-der of the presented summaries was randomised. They were asked to rate each feedback summary on a 10-point rating scale in response to the fol-lowing statement: “Imagine you are the folfol-lowing student. How would you evaluate the following feedback summaries from 1 to 10?”, where 10 cor-responds to the most preferred summary and 1 to the least preferred.
Figure 1: The Figure show the evaluation setup. Students were presenting with the data in a graphical way and then they were asked to evaluate each summary in a 10-point Rating scale. Summaries displayed from left to right: ML system, RL, rule-based and random.
significantly prefer all the systems over the ran-dom.
7 Summary
We have shown that ML classification for sum-marisation of our time-series data has an accuracy of 76.95% and that this approach significantly out-performs other classification methods as it is able to capture dependencies in the data when mak-ing content selection decisions. ML classifica-tion was also directly compared to a RL method. It was found that although ML classification is almost 20% more accurate than RL, both meth-ods perform comparably when rated by humans. This may be due to the fact that the RL optimi-sation method is able to provide more varied re-sponses over time rather than just emulating the training data as with standard supervised learn-ing approaches. Foster (2008) found similar re-sults when performing a study on generation of emphatic facial displays. A previous study by Belz and Reiter (2006) has demonstrated that au-tomatic metrics can correlate highly with human
ratings if the training dataset is of high quality. In our study, the human ratings correlate well to the average scores achieved by the reward func-tion. However, the human ratings do not correlate well to the accuracy scores. It is interesting that the two methods that score differently on various automatic metrics, such as accuracy, reward, pre-cision, recall and F-score, are evaluated similarly by users.
8 Future Work
For this initial experiment, we evaluated with stu-dents and not with lecturers, since the stustu-dents are the recipients of feedback. In future, we plan to evaluate with students’ own data under real cir-cumstances as well as with ratings from lecturers. Moreover, we plan to utilise the results from this student evaluation in order to train an optimisation algorithm to perform summarisation according to students’ preferences. In this case, optimisation would be the preferred method as it would not be appropriate to collect gold standard data from stu-dents. In fact, it would be of interest to investi-gate multi-objective optimisation techniques that can balance the needs of the lecturers to convey important content to the satisfaction of students.
9 Acknowledgements
The research leading to this work has re-ceived funding from the EC’s FP7 programme: (FP7/2011-14) under grant agreement no. 248765 (Help4Mood).
References
Carole Ames. 1992. Classrooms: Goals, structures, and student motivation. Journal of Educational Psy-chology, 84(3):261–71.
Ion Androutsopoulos, Gerasimos Lampouras, and Dimitrios Galanis. 2013. Generating natural lan-guage descriptions from owl ontologies: the nat-ural owl system. Atrificial Intelligence Research, 48:671–715.
Gabor Angeli, Percy Liang, and Dan Klein. 2010. A simple domain-independent probabilistic approach to generation. InConference on Empirical Methods
in Natural Language Processing (EMNLP).
Regina Barzilay and Mirella Lapata. 2004. Collec-tive content selection for concept-to-text generation.
InConference on Human Language Technology and
Empirical Methods in Natural Language Processing
(HLT-EMNLP).
Regina Barzilay and Lillian Lee. 2004. Catching the drift: Probabilistic content models, with applications to generation and summarization. In Human Lan-guage Technology Conference of the North Ameri-can Chapter of the Association for Computational
Linguistics (HLT-NAACL).
Anja Belz and Eric Kow. 2010. Extracting parallel fragments from comparable corpora for data-to-text generation. In6th International Natural Language
Generation Conference (INLG).
Anja Belz and Ehud Reiter. 2006. Comparing auto-matic and human evaluation of nlg systems. In11th Conference of the European Chapter of the Associa-tion for ComputaAssocia-tional Linguistics (ACL).
Rolf Black, Joe Reddington, Ehud Reiter, Nava Tintarev, and Annalu Waller. 2010. Using NLG and sensors to support personal narrative for children with complex communication needs. In NAACL HLT 2010 Workshop on Speech and Language Pro-cessing for Assistive Technologies.
Scotty D. Craig, Arthur C. Graesser, Jeremiah Sullins, and Barry Gholson. 2004. Affect and learning: an exploratory look into the role of affect in learn-ing with autotutor. Journal of Educational Media, 29:241–250.
Pable Duboue and K.R. McKeown. 2003. Statistical acquisition of content selection rules for natural lan-guage generation. In Conference on Human Lan-guage Technology and Empirical Methods in
Natu-ral Language Processing (EMNLP).
Mary Ellen Foster. 2008. Automated metrics that agree with human judgements on generated output for an embodied conversational agent. In5th Inter-national Natural Language Generation Conference (INLG).
Malte Gabsdil and Oliver Lemon. 2004. Combining acoustic and pragmatic features to predict recogni-tion performance in spoken dialogue systems. In
42nd Annual Meeting of the Association for Com-putational Linguistics (ACL).
Albert Gatt, Francois Portet, Ehud Reiter, James Hunter, Saad Mahamood, Wendy Moncur, and So-mayajulu Sripada. 2009. From data to text in the neonatal intensive care unit: Using NLG technology for decision support and information management.
AI Communications, 22: 153-186.
Dimitra Gkatzia, Helen Hastie, Srinivasan Ja-narthanam, and Oliver Lemon. 2013. Generating student feedback from time-series data using Rein-forcement Learning. In14th European Workshop in
Natural Language Generation (ENLG).
Dimitra Gkatzia, Helen Hastie, and Oliver Lemon. 2014. Finding Middle Ground? Multi-objective Natural Language Generation from time-series data.
In14th Conference of the European Chapter of the
Association for Computational Linguistics (EACL) (to appear).
Sebastian Gross, Bassam Mokbel, Barbara Hammer, and Niels Pinkwart. 2012. Feedback provision strategies in intelligent tutoring systems based on clustered solution spaces. In J. Desel, J. M. Haake, and C. Spannagel, editors,Tagungsband der 10.
e-Learning Fachtagung Informatik (DeLFI), number
Jim Hunter, Yvonne Freer, Albert Gatt, Yaji Sripada, Cindy Sykes, and D Westwater. 2011. Bt-nurse: Computer generation of natural language shift sum-maries from complex heterogeneous medical data.
American Medical Informatics Association,
18:621-624.
Nicholas Johnson and David Lane. 2011. Narrative monologue as a first step towards advanced mis-sion debrief for AUV operator situational aware-ness. In15th International Conference on Advanced Robotics.
Ravi Kondadadi, Blake Howald, and Frank Schilder. 2013. A statistical nlg framework for aggregated planning and realization. In 51st Annual Meet-ing of the Association for Computational LMeet-inguistics (ACL).
Gerasimos Lampouras and Ion Androutsopoulos. 2013. Using integer linear programming in concept-to-text generation to produce more compact texts. In
51st Annual Meeting of the Association for Compu-tational Linguistics (ACL).
Anna S. Law, Yvonne Freer, Jim Hunter, Robert H. Logie, Neil McIntosh, and John Quinn. 2005. A comparison of graphical and textual presentations of time series data to support medical decision making in the neonatal intensive care unit. Journal of
Clini-cal Monitoring and Computing, pages 19: 183–194.
Gjorgji Madjarov, Dragi Kocev, Dejan Gjorgjevikj, and Saso Dzeroski. 2012. An extensive experimen-tal comparison of methods for multi-label learning.
Pattern Recognition, 45(9):3084–3104.
Natalie K. Person, Roger J. Kreuz, Rolf A. Zwaan, and Arthur C. Graesser. 1995. Pragmatics and peda-gogy: Conversational rules and politeness strategies may inhibit effective tutoring. Journal of Cognition and Instruction, 13(2):161-188.
Ehud Reiter and Robert Dale. 2000. Building natu-ral language generation systems. Cambridge Uni-versity Press.
Verena Rieser, Oliver Lemon, and Xingkun Liu. 2010. Optimising information presentation for spoken dia-logue systems. In48th Annual Meeting of the Asso-ciation for Computational Linguistics (ACL). Somayajulu Sripada, Ehud Reiter, Jim Hunter, and Jin
Yu. 2003. Generating english summaries of time se-ries data using the gricean maxims. In9th ACM in-ternational conference on Knowledge discovery and
data mining (SIGKDD).
Somayajulu Sripada, Ehud Reiter, I Davy, and K Nilssen. 2004. Lessons from deploying NLG technology for marine weather forecast text gener-ation. InPAIS session of ECAI-2004:760-764. Richart Sutton and Andrew Barto. 1998.
Reinforce-ment learning. MIT Press.
Grigorios Tsoumakas and Ioannis Katakis. 2007. Multi-label classification: An overview.
Inter-national Journal Data Warehousing and Mining,
3(3):1–13.
Grigorios Tsoumakas, Ioannis Katakis, and Ioannis Vlahavas. 2010. Random k-labelsets for multi-label classification. IEEE Transactions on
Knowl-edge and Data Engineering, 99(1):1079–1089.
Grigorios Tsoumakas, Eleftherios Spyromitros-Xioufis, Josef Vilcek, and Ioannis Vlahavas. 2011. Mulan: A java library for multi-label learning. Journal of Machine Learning Research, 12(1):2411–2414.
Marian van den Meulen, Robert Logie, Yvonne Freer, Cindy Sykes, Neil McIntosh, and Jim Hunter. 2010. When a graph is poorer than 100 words: A com-parison of computerised natural language genera-tion, human generated descriptions and graphical displays in neonatal intensive care. InApplied Cog-nitive Psychology, 24: 77-89.
Ian Witten and Eibe Frank. 2005. Data mining: Practi-cal machine learning tools and techniques. Morgan Kaufmann Publishers.