Geometry Effects in Four-Point Bending Test for Thin Sheet
Studied by Finite Element Simulation
Xiaolong Dong
1, Hongwei Zhao
1,+, Lin Zhang
1,2, Hongbing Cheng
1and Jing Gao
1 1School of Mechanical Science and Engineering, Jilin University, Changchun 130025, China2Department of Integrated System Engineering, The Ohio State University, Columbus, OH 43210, U.S.A
Some experimental geometry parameters of four-point bending tests, such as span ratio and support radius, obtained from experience, likely lead systematic errors into thefinal results. In this paper, some typical geometry effects of four-point bending tests for thin sheet are investigated by employingfinite element analysis (FEA). In order to assure the reasonability and accuracy of the FEA results, the standard tensile tests and four-point bending tests are carried out by commercial instruments. Based on the simulation results, it is noted that the stress distribution between the inner supports and outer supports is different with the variation of span ratio. The maximum wedging stress is located near the inner supports. According to the study, the optimum value of the span ratio is suggested to be around 1/3 at plastic stage. In addition, the effects of support radius and contact roughness are also discussed to make a beneficial reference for designing four-point bending experiments and devices. [doi:10.2320/matertrans.M2015178]
(Received May 7, 2015; Accepted November 4, 2015; Published February 25, 2016)
Keywords: four-point bending, geometry effect,finite element analysis, span ratios, stress distribution
1. Introduction
Four-point bending test is a standard widely used method for determining materials mechanical properties, such as
flexural strength and flexural modulus.1) The standard specimens and process employed in four-point bending tests are simple to operate, leading it to a convenient way for both plastic and brittle materials. It is well known that the four-point bendingfixture consists of two inner supports and two outer supports, symmetrically arranged relative to specimen. The four-point bending most remarkable difference from three-point bend is that the load is applied by two inner supports. Compared with three-point bending tests, the moment along the specimen between the inner supports is uniformly distributed. Although four-point bending tests are widely used and some relevant standards have been established, our understanding on the deformation mechan-ism of materials in four-point bending test is still far from complete.2,3) For example, the span ratio between inner supports and outer supports is often treated as an empirical parameter. Up to now, it is hardly to accurately decide the span ratio when designing four-point test experiments or instruments. As a result, the span of inner supports is usually set to be 1/2 or 1/3 of the outer supports span just because it is easy to operate, but different span ratios between the inner supports and outer supports can easily lead to some systematic errors in determiningflexural strength.4,5)
For this reason, a lot of studies based on experimental and various theoretical models have been carried out to make deep understanding of the geometry effects in four-point bending tests. All those previous studies have provided much help in understanding such material performance character-ization method.68)Theobaldet al.conducted an experimen-tal research to analyze the influence of geometric confi g-uration on four-point bending tests about flexural strength and modulus. They found thatflexural strength is dependent on span ratios and decreases as the inner span increases.6)
Hiroshi Yoshihara and Hiroki Kondo suggested that the shear modulus may change according to different depth/span ratio in asymmetric four-point bending tests.7)
As the four-point bending test is a continuous and simple method to measure the physical performance of materials, it is often carried out as a kind of fatigue test method for measuring fatigue properties of metallic and ceramic materials.813) Grabowski and Yates conducted four-point
bending fatigue tests on waspaloy (a Ni-based superalloy) to investigate the geometry effect on the specimen fatigue behavior.9)The span ratio between inner supports and outer
supports is discovered to have a significant impact on material’s fatigue life. It is necessary to make sense of the geometry effect on four-point bending test and to optimize the test method.
As the mentioned above, four-point bending test gives a uniform maximum tensile stress between two inner supports beneath the specimen surface, which is also known as the pure-bending section length. The nominal maximum stress· on the surface of specimen can be obtained by the beam mechanical theory.14)
· ¼3FðltÞ=ðbh2Þ ð1Þ
whereFis the resultant bending force of inner supports;tis distance between inner supports; l is the distance between outer supports; h and b is the thickness and width of the specimen, respectively.
Based on some previous studies, the tensile stress between two inner supports is not completely consistent.4,15,16) Discovering the rules of stress distribution will be helpful to account for the materials mechanical behaviors under the bending moment. T. Zhaiet al.conducted a systematic study of stress distributions for the specimen with different span ratios of inner supports and outer supports and different ratios of support span and specimen thickness in four-point bend throughfinite element simulation. They found that the value of t/h between 1.2³1.5 and l/t between 4³5 leads to relatively uniform stress distribution.4) However, compared
with the outer span, the specimen thickness selected in their
+Corresponding author, E-mail: hwzhao@jlu.edu.cn
study is too large. The results are not practical in determine most of the mechanical properties of thin sheets. The four-point bending test standards (ASTM D790-791 and ASTM D6272-02) recommend the outer span/specimen thickness
²16.17)For most thin sheet four-point bending tests, the outer span is always above 50 times of specimen thickness. Thus, there is an actual demand to make clear the geometry effect on thin sheet four-point bending tests.
Finite element analysis (FEA) is a powerful tool in mechanical researches and could monitor many phenomena which cannot be easily obtained by experiments.18) In this paper, the research of different span ratios of inner supports and outer supports for 6061 aluminium alloy thin sheet in four-point bending test is carried out via FEA. In addition, the effects of support radius and contact roughness on four-point bending test are also studied. This investigation is aimed to find out the optimum geometry parameter of different situations for thin sheet four-point bending test and make a beneficial reference for the future experimental researches and instrument designs.
2. Experiments
2.1 Material mechanical properties
The mechanical properties of 6061 aluminium alloy were obtained by standard tensile tests (DNS type universal testing machine produced from CRIMS). The specimen with thick-ness of 2.0 mm is shown in Fig. 1. The specimens were made by wire electrical discharge machining from aflat cold-rolled sheet. In order to avoid random error in one single experiment,five uniaxial tensile experiments were conducted with the same experimental conditions. The mechanical properties are shown in Table 1.
In the uniaxial tensile tests, the deformation of material was measured by high precision extensometer to make sure that the strain was measured as accurate as possible, shown as Fig. 2(a). What calls for attention is that the tested stress and strain should be converted to true stress and strain. The relationship between true strain and nominal stress-strain is as follows,
·true¼·nomð1þ¾nomÞ ð2Þ ¾true¼lnð1þ¾nomÞ ð3Þ
where ·trueand ¾truerepresents the true stress and true strain
respectively;·nomand¾nomrepresents the nominal stress and
nominal strain respectively. The curve of true stress against true strain is shown in Fig. 2(b).
2.2 Four-point bending experiments
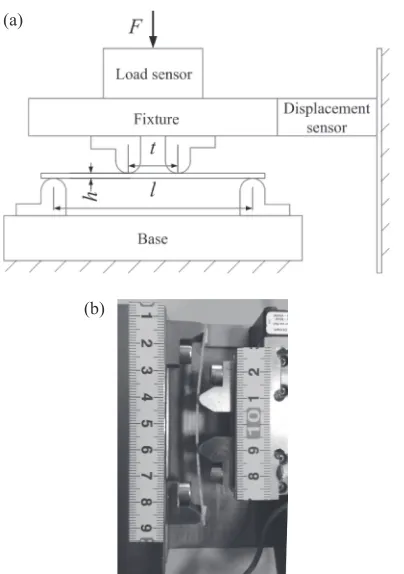
In general, the commercial four-point bending instruments are either too large or easily bring about errors due to insufficient stiffness. A small sized scientific device was developed to conduct relative four-point bending experi-ments. The self-developed device is integrated with high precision sensors, flexible structures, feedback control and compensation algorithm, which enable to avoid the dis-advantages of current commercial instruments. The sche-matic diagram of the experiment setup is shown as Fig. 3(a). One of the main concerns was the stiffness of the four-point testing device. To minimize the error due to the stiffness of
the supports during four-point bending tests, the supports were made of tool steel, which was much higher stiffness than the specimen. The inner supports and outer supports were fastened to thefixture and device base. Compared with standard measurement results, the stiffness of the device was measured to be 3,540 N/mm and this parameter was taken into consideration in the tests to modify the experimental results.
In order to make sure thefinite element analysis accurate and reasonable, a serious of four-point bending experiments
[image:2.595.308.548.121.623.2]Fig. 1 Specimen for standard tensile test.
Table 1 Properties of 6061 aluminium alloy.
Young’s modulusE(GPa) 72.0
Poisson’s ratiov 0.33
Yield stress·s(MPa) 158
ElongationA(%) 17
(a)
(b)
of 6061 aluminium alloy were conducted, shown as Fig. 3(b). The loading speed was set to be 0.24 mm/min as a quasi-static loading process. The dimensions of two kinds thin sheet specimen were 84.0 mm©5.0 mm©1.0 mm and 84.0 mm©5.0 mm©2.0 mm. According to the experimental results, the results consisted well with that from the standard tensile tests.
3. FE Simulation
3.1 FE models and validation
Thefinite element analysis was adopted using the software ABAQUS to investigate geometry effects in four-point bending test.19) Because of the symmetry of specimens and
supports, only half part of the whole model was established. The symmetric boundary conditions were applied on the mid-plane of specimen. The specimen was modeled as a three-dimension deformable body and the material parameters used are obtained from the standard tensile tests.19) The size of
specimen was as same as the specimen size in the experi-ments. The supports were idealized as rigid bodies because the hardness and strength of supports were much larger than the bending materials. The radius of supports was 2.5 mm just as the situation of experiments. Static analysis was implemented in the FE model and C3D8R elements were used for the specimen. The region between inner supports was of interest. Different mesh sizes were used in two regions to simplify the analysis, shown as Fig. 4. Along the specimen length direction, the size of each element was set to be 0.15 mm in the pure-bending region and 0.40 mm in the other region. The size was 0.10 mm and 0.25 mm along the
specimen thickness direction and width direction, respec-tively. Coulomb friction was defined between the contact surfaces of specimen and supports, and the friction coefficient was set to be 0.02 in view of good surface treatments. The boundary conditions of inner support are allowed with single direction along y-axial while the outer support is fullyfixed. The freedom of specimen is not limited as the actual experimental conditions.
In thefirst case, the inner span was selected to be 20.0 mm and outer span was set to be 75.0 mm in the FE model. Figure 5 illustrates the stress distribution along specimen length direction. It can be seen that the material maximum stress have exceeded the yield stress and both specimens have experienced plastic strain. In addition, the region above neutral layer is subjected to pressure stress and the region below neutral layer is subjected to tensile stress. The maximum stresses are mainly concentrated on the top and bottom surface of the specimen near the inner supports. The local stress is concentrated in the region between the inner supports when material is squeezed by support. The stress concentration in pressure is higher than the maximum stress in tension. Local failures beneath the inner supports are always observed in bending experiments.20) However,
experimental results show that the deficiency of tensile strength is the main reason for fatigue and failure for
(a)
(b)
Fig. 3 Four-point bending experiments of 6061 aluminium alloy: (a) schematic diagram of the experiment setup; (b) four-point bending test apparatus.
Fig. 4 Schematic diagram of four-point bend FE model.
(a)
(b)
[image:3.595.71.273.66.353.2] [image:3.595.306.545.91.428.2]aluminum alloy in four-point bending tests.4) Further
explanation of stress on the tension surface was described in the following statement.
The load-displacement curves from simulation results were compared with those obtained in the four-point bending experiments, shown as Fig. 6. Since the specimen stiffness in the thickness was small, vibrations could be seen in the load-displacement curve during loading process for the case of 1.0 mm specimen thickness. The comparison of maximum loads from simulation and experiments is listed in Table 2. The error is 6.0%and 1.7%for specimen thickness of 1.0 mm and 2.0 mm, respectively. The simulation load-displacement curves basically consisted with experimental results, which verified the parameters setting in the FE model was feasible and reasonable.
3.2 Simulation results
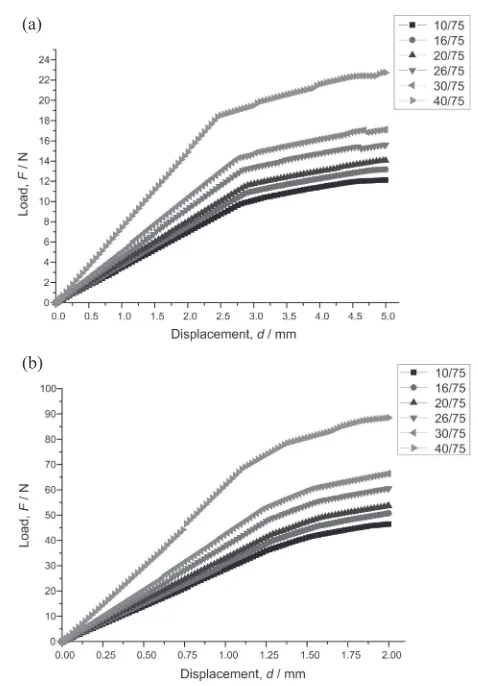
The finite element models with different span ratios between inner supports and outer supports were calculated. The outer spanlwasfixed on 75.0 mm, while the inner span tvaried from 10.0 mm to 40.0 mm. For each specimen with the same thickness, six inner spans were set as 10.0 mm, 16.0 mm, 20.0 mm, 26.0 mm, 30.0 mm, and 40.0 mm. The load-displacement curves of different span ratios are plotted in Fig. 7. With the inner span longer, the moment arm of four-point bend is larger. The load of long inner span increases faster than those with short inner spans.
The flexure modulus E could be calculated from linear
fitting of load-displacement curve when the material was in elastic stage. Flexure modulusEwith respect to inner spant and outer spanlis,
E¼ ðlþ2tÞðltÞ2=ðbh3Þ ðF=dÞ ð4Þ
whered is the displacement of inner support.
Experiment results of Theobald et al. showed that the
flexure modulus was independent of span ratios.6)Theflexure modulus listed in Table 3 from simulation results also show that no obvious difference appears in flexure modulus with different span ratios and the maximum error with standard value is below 2.5%. It means that the flexure modulus obtained from four-point bending test with different span ratios is credible and accurate when the bending deflection of specimen is not large enough to change contact position in the supports.1)
(a)
(b)
[image:4.595.54.286.61.437.2]Fig. 6 Comparison of load-displacement curves of the simulations and experiments: (a) specimen thickness of 1.0 mm; (b) specimen thickness of 2.0 mm.
Table 2 Comparison of maximum loads from simulation and experiments.
Specimen thickness,
t/mm Experiment Simulation Error,¤/%
1 15.0 14.1 6.0
2 47.5 48.3 1.7
(a)
(b)
[image:4.595.305.544.64.407.2] [image:4.595.46.291.516.568.2]3.3 Analysis of different span ratios
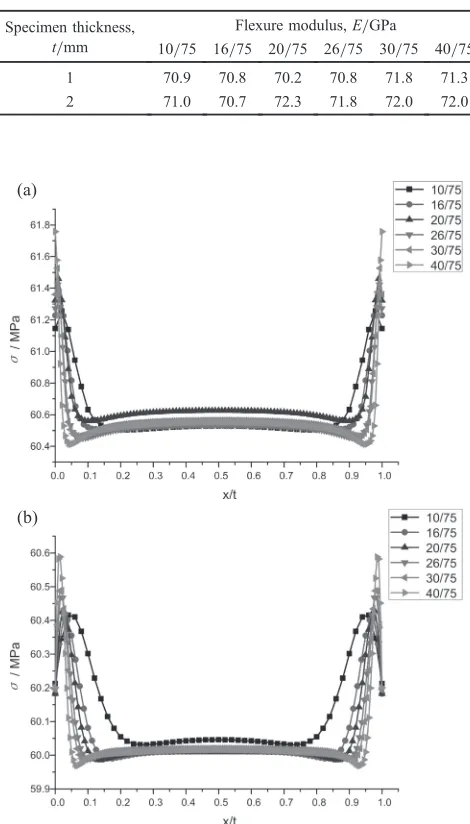
When materials are in the elastic stage, the stress in tension tends to increase towards the ends of pure-bending region for thin sheet. Figure 8 shows the stress distribution of the tension surface corresponding to different span ratios t/l when middle point stress is around 60.0 MPa. The simulation results are similar with previous studies. Zhai et al. found that there is a wedging stress near inner supports for four-point bending test with large ratio of t/h. Thus, it is understandable that cracks were generally formed at the end of inner span when applied with high-circle fatigue tests.10,11) With the same outer span, the wedging stress is larger when the inner span of four-point bend gets longer.
Interestingly, the tress distribution on tension surface changes when the load increases. Figure 9 shows the stress distribution corresponding to various span ratios t/l when middle point stress is around 165.0 MPa. Plastic deformation of the material has occurred. For the case of 1.0 mm specimen thickness, the maximum stress is still at the end of
pure-bending region for short inner spans, such as the situation of t/l=10/75, 16/75. The maximum stress occurs at middle of pure-bending region when the inner span is long enough, such as the situation oft/l=30/75, 40/75, although there is a minor stress lift in the region near inner support. The view of stress distribution with different values oft/l is shown in Fig. 10.
Figure 11 illustrates the maximum deviation of stress from middle point along pure-bending region with different span ratios between inner support and outer support from 10/75 to 40/75. The minimum stress deviation appears at the span ratio of 26/75, while the maximum stress deviation appears at the span ratio of 40/75. It can be seen that the non-uniformity in pure-bending region remains the highest for t/l value of 40/75, no matter at elastic stage or plastic stage. It makes sense that the inner span is always less than 1/2 of outer span recommended by four-point bending standards.
[image:5.595.312.546.58.235.2]However, the rule of stress distribution of the 2.0 mm specimen thickness is different from that of the 1.0 mm specimen thickness when the stress reaches yield stage. Figure 12 shows the stress distribution corresponding to different span ratios t/l when middle point stress is around 164.0 MPa. The wedging stress remains a dominant factor in determining how stresses are distributed and the maximum stress occurs at the end sides of pure-bending region, just as the situation at elastic stage. The difference is that non-uniformity is getting obvious and the point at which stress starts to rise towards inner supports gets closer to the middle point of the specimen. For a shorter distance between the inner supports, the stress rise-point becomes closer to middle of specimen. Although the wedging stress with span ratio of 10/75 is smaller than other wedging stresses, it is still not convinced that the uniformity with span ratio of 10/75 is the best considering the position of stress rise-point. Considering all the situations and explanations above, the best uniformity of stress distribution belongs to the span ratio of 26/75. Thus, it suggests that the fatigue life may be longer when the outer span is around three times of inner span while the material is applied with low-circle fatigue tests in which material often experienced plastic deformation.
Table 3 Flexure modulus with different span ratios.
Specimen thickness, t/mm
Flexure modulus,E/GPa
10/75 16/75 20/75 26/75 30/75 40/75
1 70.9 70.8 70.2 70.8 71.8 71.3
2 71.0 70.7 72.3 71.8 72.0 72.0
(a)
(b)
Fig. 8 Stress distribution corresponding to different span ratiost/lwhen middle point stress is around 60.0 MPa: (a) specimen thickness of 1.0 mm; (b) specimen thickness of 2.0 mm.
[image:5.595.51.286.80.492.2]It is noted that the stress distribution changes as the load increases. The view of stress distribution on the tension surface with different maximum strains for specimen thick-ness of 1.0 mm and span ratio of 40/75 is shown in Fig. 13. It is suggested that the strain is one of the main factors that influence stress distribution. The experimental research from Hassan and Liu also demonstrated that difference of strain
range would influence material’s bending fatigue life.21)The stress in middle region tends to become larger compared with other regions between two inner supports when the strain of specimen is large enough. The strain effect becomes more significant for thinner specimen and longer inner span with the same outer span in 6061 aluminum alloy.
(a) (b)
(c) (d)
[image:6.595.60.536.70.439.2](e) (f)
[image:6.595.62.274.485.650.2]Fig. 10 The view of stress distribution of the tension surface for specimen thickness of 1.0 mm: (a)t/l=10/75; (b) t/l=16/75; (c)t/l=20/75; (d)t/l=26/75; (e)t/l=30/75; (f )t/l=40/75.
Fig. 11 Maximum deviation of stress from middle point with different span ratios for specimen thickness of 1.0 mm.
[image:6.595.310.543.486.642.2]3.4 Analysis of different support radiuses
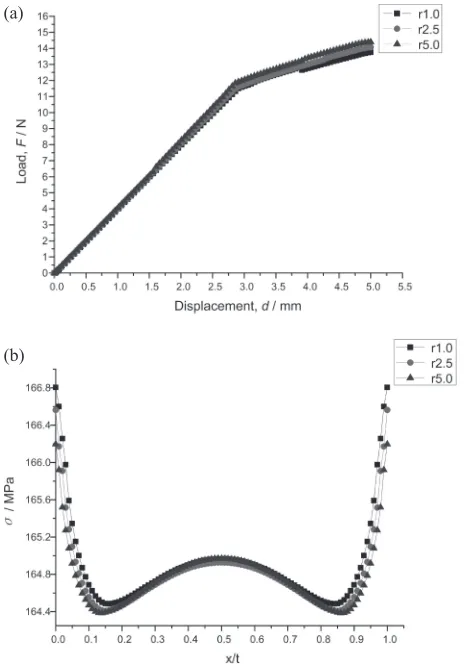
The effect of support radius on four-point bending tests is analyzed by changing the radius of inner support from 1.0 mm to 5.0 mm. The inner span and outer span werefixed on 20.0 mm and 75.0 mm. The load-displacement curves of different support radiuses are shown in Fig. 14(a). There is no difference at initial phase. However, the load increase speed becomes faster with larger support radius when the displacement exceeds 1.5 mm. Figure 14(b) shows the stress distribution of different support radiuses on the tension surface. The wedging stress gets closer to inner support with the larger support radius and the maximum tension stress may get over the initial pure-bending region.
The support contact position varies along with the bending rotation of specimen. The true inner span increases as the specimen rolls over the support. On the pressure surface, a stress concentration region is located on the contact position, as shown in Fig. 15. It should be noted that the mesh sizes of specimens are same in Fig. 15, and the only difference is the radius of support. If the contact radius does not change significantly, the stress concentrations have only minor variations from photo-elastic studies.22) Simulation results were consistent with the literature. But the stress concen-tration region moves to end side of the specimen which can represent the change trend of contact position. When the support radius gets larger, move speed of stress concentration region gets faster. Thus, large support radius should be avoided to select for thin sheet four-point bending tests to minimize the move trend of contact position.
[image:7.595.63.535.72.193.2](a) (b)
Fig. 13 The view of stress distribution of the tension surface with different maximum strains for specimen thickness of 2.0 mm and span ratio of 40/75: (a)¾max=0.003865; (b)¾max=0.006884.
(a)
(b)
Fig. 14 Four-point bending test results with different support radiuses: (a) load-displacement curves; (b) stress distribution.
(a) (b)
(c)
[image:7.595.54.287.237.569.2](d)
[image:7.595.306.543.238.523.2]3.5 Analysis of different contact roughness
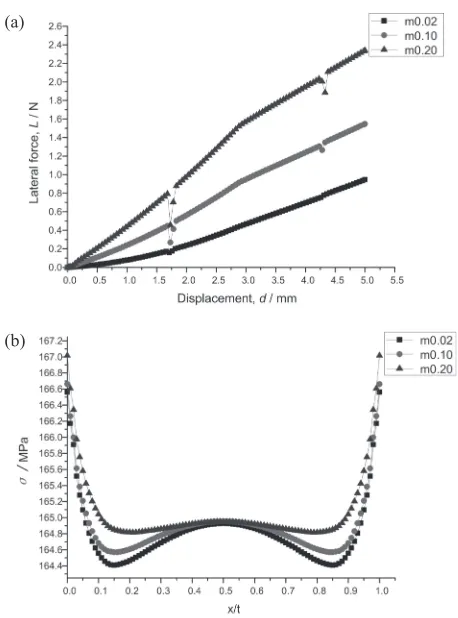
The specimen is loaded directly by the supports during four-point bending tests. The contact roughness between specimen and supports must have some influence on the four-point bending results. The surface qualities between the supports and specimens largely effect the interaction relation-ship.23) Different contact roughness is modeled by setting different friction coefficients in FE simulations. The supports in the experiments are made of tool steel and the test material is 6061 aluminum alloy. The friction coefficients on the contact surfaces are set at 0.02, 0.10 and 0.20 in three different situations.
The lateral force in four-point bending tests increases along with the deformation of specimen. Different contact roughness directly influences the level of lateral force, shown as Fig. 16(a). The lateral force with rough face could be times of which with smooth surface. Although the lateral force of four-point bending test is not included in the resultant force of two inner supports, the stress distributions with different lateral forces are remarkably different. The stress distribu-tions on tension surface with different friction coefficients are shown in Fig. 16(b). As mentioned above, the stress tends to decrease from middle to end sides of specimen. This stress attenuation trend slows down for large friction coefficient which means that the whole stress level in pure-bending region is higher for poor contact roughness.
4. Conclusions
In this paper, a series of FE simulations were conducted to
investigate the influences of span ratio, support radius and contact roughness on four-point bending tests. The geometry effects in thin sheet four-point bending test were discussed through the view of stress distribution. The main results are concluded as follows:
(1) The stresses were not completely uniform in the region of pure-bending in four-point bending tests. The wedging stress existed in thin sheet four-point bending tests and remained the maximum stress during elastic stage. The wedging stress got larger when the inner span got longer, while the stress distribution would change when the load increased. The best span ratio for uniformity of stress distribution between inner supports and outer supports belonged to 26/75 at plastic stage. It suggested that the 1/3 may be the optimum value of span ratio for thin sheet applied with low-circle four-point bending fatigue tests.
(2) The strain may be one of the main factors that influence the stress distribution in four-point bending tests. The middle stress tended to become the maximum stress along pure-bending region while large deformation had occurred. For thinner specimen and for longer inner span, the strain effect was more significant.
(3) Different support radiuses mainly effected the contact positions between support and specimen and changed the magnitudes of contact position movement. Thus, large support radius should be avoided to minimize the move trend of contact position for thin sheet four-point bending tests.
(4) The lateral force in four-point bending test was much larger for rough contact surface compared with smooth contact surface. For poor contact roughness, the stress attenuation trend slowed down and the whole stress level in pure-bending region was higher.
Acknowledgments
This research is funded by the National Hi-tech Research and Development Program of China (863 Program) (No. 2012AA041206), National Natural Science Foundation of China (NSFC) (No. 51275198), and Program for New Century Excellent Talents in University of Ministry of Education of China (No. NCET-12-0238).
REFERENCES
1) F. Mujika:Polym. Test.25(2006) 214220.
2) T. Lube, M. Manner and R. Danzer:Fatigue Fract. Eng. Mater. Struct.
20(1997) 16051616.
3) G. D. Quinn and R. Morrell:J. Am. Ceram. Soc.74(1991) 20372066.
4) T. Zhai, Y. G. Xu, J. W. Martin, A. J. Wilkinson and G. A. D. Briggs:
Int. J. Fatigue21(1999) 889894.
5) L. Wang, W. Liu, H. Fang and L. Wan: J. Compos. Mater. (2014)DOI: 10.1177/0021998314554124.
6) D. Theobald, J. McClurg and J. G. Vaughan: Int. Compos. Expo. (Washington, 1997) pp. 19.
7) H. Yoshihara and H. Kondo: Bio Resour.8(2013) 38583868. 8) L. K. Zhang, Z. H. Chen, D. Chen, X. Y. Zhao and Q. Zheng:J.
Non-Cryst. Solid.370(2013) 3136.
9) L. Grabowski and J. R. Yates:Int. J. Fatigue14(1992) 227232.
10) J. R. Yates, W. Zhang and K. J. Miller: Fatigue Fract. Eng. Mater. Struct.16(1993) 351362.
11) S. Gungor and L. Edwards:Mater. Sci. Eng. A160(1993) 1724.
(a)
[image:8.595.54.283.65.374.2](b)
12) J. Qian and A. Fatemi:Fatigue Fract. Eng. Mater. Struct.19(1996) 12771284.
13) G.-D. Zhan, M. J. Reece, M. Li and J. M. Calderon-Moreno:J. Mater. Sci.33(1998) 38673874.
14) T.-K. Kang:Measurement44(2011) 871874.
15) K. H. Vepakomma, S. H. Carley, J. T. Westbrook and G. V. Morgan: J. Am. Ceram. Soc. (2015)DOI: 10.1111/jace.13473.
16) K. H. Vepakomma, J. Westbrook, S. Carley and J. Kim: J. Disp. Technol.9(2013) 8286.
17) G. Williams, R. Trask and I. Bond:Composites A38(2007) 1525 1532.
18) K.-Y. Chen, C.-W. Huang, M. Wu, W.-C. J. Wei and C.-H. Hsueh:
J. Am. Ceram. Soc.97(2014) 11701176.
19) Hibbitt: ABAQUS. version 6.9 (Karlsson and Sorensen, Inc. Pawtucket, RI 2011).
20) G. Caprino, M. Durante, C. Leone and V. Lopresto:Composites B71
(2015) 4551.
21) T. Hassan and Z. Liu:Int. J. Press. Vessels Piping78(2001) 1930.
22) E. R. C. Draper and A. E. Goodship:J. Biomech.36(2003) 1497 1502.