{001} Texture Map of AA5182 Aluminum Alloy
for High Temperature Uniaxial Compression
Hyeon-Mook Jeong
*, Kazuto Okayasu and Hiroshi Fukutomi
Department of Solid State Materials and Engineering, Graduate School of Yokohama National University, Yokohama 240-8501, Japan
The behavior of texture formation in AA5182 aluminum alloy was investigated by uniaxial compression tests under strain rates and temperatures ranging from5:0104s1to5:0102s1and from 673 K to 823 K, respectively. After the deformation, {011} (compression plane) or {001} fiber texture appears. It was found that {001} fiber texture was formed after the development of {011} fiber texture. The size of {001} grains is larger than the average grain size, suggesting that the {001} texture formation is attributed to grain boundary migration. In order to understand the relationship between texture sharpness of {001}, temperature and strain rate, the texture map is proposed. The {001} texture map elucidates that the balance between flow stress and deformation temperature is important for the development of {001} component when the viscous motion of dislocation is the dominant deformation mechanism. [doi:10.2320/matertrans.L-M2010820]
(Received February 3, 2010; Accepted August 10, 2010; Published October 27, 2010)
Keywords: AA5182 aluminum alloy, texture, grain boundary migration, high temperature deformation, electron back-scattered diffraction
1. Introduction
Aluminum alloys have been used as basic materials with light weight and high strength characteristics. For promoting the application of aluminum alloys, the improvement in workability is one of the key issues. It has been known that the texture has strong effects on plastic workability. For example, {111} texture improves the deep drawability of sheets1) while the formation of {001} texture should be suppressed to avoid the earing at deep drawing.2)It has been recently suggested that the development of cube texture at the surface side of a sheet might increase the limit angle for bending.3) The control of texture is thus important for practical application of aluminum alloys, and the under-standing of the mechanisms of texture formation is important as well, from the viewpoint of the process construction to adjust textures.
Various textures appear in metals and alloys depending on deformation modes, deformation mechanisms and recrystal-lization mechanisms. In order to find the effect of deforma-tion mechanism on the texture development, two of the authors have been investigating the texture formation during high temperature deformation by uniaxial compression of Al-Mg binary alloys in a single phase state. It was found that {011} (compression plane) and {001} textures appeared depending on temperature, strain rate and the amount of strain. It was concluded that the texture transition from {011} to {001} with increasing strain should be attributed to the grain boundary migration during deformation.4,5)In this case, the formation process of {011} texture at the initial stage of deformation has two physical meanings; one is the lattice rotation towards the stable orientation for deformation and the other is the increasing process of stored energy in crystal grains. Grain boundary migration is triggered at the certain amount of deformation, then, texture transition from {011} to {001} occurs. It was concluded that {001} could be under-stood as the orientation with stability for deformation and
lower stored energy because of its low value of Taylor factor. Since the stable orientation for deformation and the orienta-tion preferential for grain boundary migraorienta-tion vary depend-ing on deformation mode,6)these results suggest that texture control of binary Al-Mg alloy is possible by changing deformation modes, such as rolling, extrusion and etc. at high temperatures.
The experimental results on Al-Mg binary alloys7,8) suggest the evolution of {001} texture in commercial AA5182 alloy bearing Mg as the primary alloy element by high temperature uniaxial compression, which implies the possibility of texture control by hot working as described above. However, the alloy elements other than Mg may retard the grain boundary migration, resulting in the change of texture development as reported on Al-Mg alloy with Al3Sc
precipitates.5)Thus the texture formation in AA5182 alloy is experimentally studied in this study.
2. Experimental Procedure
AA5182 alloy was produced by Furukawa-Sky Aluminum Corp. in the form of 70% hot rolled plate with 20 mm in thickness. Cylindrical specimens with a dimension of 18 mm in length and 12 mm in diameter were prepared by spark erosion machining for compression test. The specimens were annealed at 843 K for 1000 min in air, followed by the further annealing at 773 K for 50 min before water quenching. Since the quench from 843 K resulted in the small deformation in some cases, the annealing at 773 K was performed. The chemical composition of AA5182 alloy is given in Table 1. Figure 1 shows the grain structure map of the annealed AA5182 before the compression. The map was constructed by the electron back scattered diffraction (EBSD)
measure-Table 1 Chemical composition of AA5182 alloy in the present study.
mass(%) Mg Fe Cr Mn Si Cu Zn Ti Al
AA5182 4.54 0.30 0.04 0.45 0.12 0.09 — 0.04 bal.
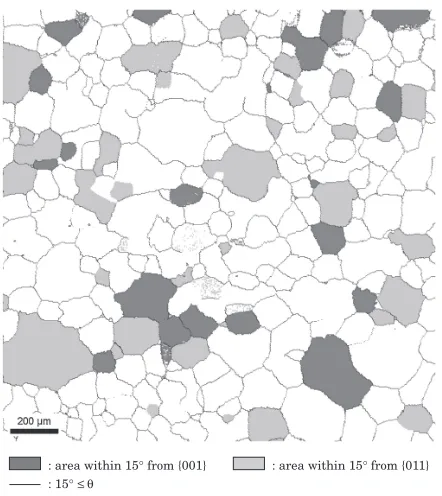
[image:1.595.302.549.757.785.2]ment from the transverse direction (TD). When the minimum rotation anglebetween the neighboring points of measure-ments is larger than 15, high angle grain boundaries are
drawn using black lines. The grains are marked with dark and light gray colors when the direction parallel to the compres-sion plane normal is within 15 from h001i and h011i,
respectively. The area of crystal grains with dark gray color and that with light gray color components are 6% and 19% of the measured area, respectively. The crystal grains are equiaxied with average diameter of 112mm.
Uniaxial compression tests were conducted under constant cross head speed conditions in air with temperatures and strain rates ranging from 673 K to 823 K and 5:0104 to
5:0102s1, respectively. Final strain rate was evaluated
on the basis of cross head speed and the height of specimens. The infrared ray furnace was used for heating. Specimens were kept for 1 h at the test temperatures before deformation, in order to decrease the influence of thermal expansion during deformation. After the deformation, the furnace was imme-diately opened and the power supply was switched off simultaneously, and then specimens were quenched into water, in order to prevent the change in microstructure after high temperature compression test.
For EBSD and texture measurement, the mid-plane sections of the deformed specimens were prepared by mechanical and electrolytic polishing. Local crystal orienta-tions were measured by the EBSD system equipped on JEOL JSM-5600 scanning electron microscope. The regions were scanned using the beam control option with a scan step of 4mm.
Texture measurements were conducted by the Schulz reflection method using nickel filtered Cu K radiation. The
diffracted X-ray intensities were measured on 111, 200 and 220 reflections and {111}, {001} and {011} pole figures were constructed. Based on these pole figures, orientation distri-bution function (ODF) was calculated by the Dahms-Bunge method.9) Textures were examined on the basis of pole figures and inverse pole figures derived from the ODF.
3. Results
3.1 Stress–strain curves
Figure 2 shows the true stress-true strain curves for the deformation at various temperatures and true strain rates, (a) 673 K, 5102s1, (b) 723 K, 5:0102s1, (c) 673 K,
5:0103s1and (d) 823 K,5:0104s1, respectively. It
is seen that flow stresses increase with decreasing temper-ature and increasing strain rate. So called high tempertemper-ature yielding is seen for the deformation at (b)(d). These flow behaviors are similar to Al-5.0 mass%Mg alloy. The flow stresses of Al-5 mass%Mg with almost same grain size are, however, much lower than those for AA5182 alloys.7)
3.2 Characteristics of texture
Figure 3 shows {011} pole figures after deformation at (a) 823 K, 5:0103s1 and (b) 673 K, 5102s1,
respectively. Strain is 1:0 for both cases. Pole densities are projected onto the compression plane. The average pole density is used as a unit. It is seen that the pole densities are distributed in a concentric circular manner in both figures. The concentric circular distribution of the pole densities appears in all the deformation conditions. This means the formation of fiber textures. The area of high pole density appears about 45 away from the center in Fig. 3(a) while
that for Fig. 3(b) appears in the center and 60away from the
center. This indicates that the main components of textures are different in these two specimens. Then the main com-ponent of the fiber texture is examined based on the ODF.
Table 2 shows the inverse pole figures showing the spatial distribution of poles for compression planes on the specimens : 15° θ
: area within 15° from {001} : area within 15° from {011}
Fig. 1 Grain structure map of AA5182 before compression measured by EBSD. The dark gray grains are within 15 degrees from {001}(compres-sion plane) and light gray grains are within 15 degrees from {011} orientation, respectively. High angle grain boundaries are drawn by a misorientation angle () greater than 15 degrees using black line.
AA5182, ε = -1.0
(a) 673K, ε = 5×10⁻²s-1
100
(b) 723K, ε = 5×10⁻²s-1
50
T
rue Stress,
(d) 823K, ε = 5 × 10⁻⁴s-1(c) 673K, ε = 5×10⁻³s-1
0
0.2
0.4
0.6
0.8
1
0
True Strain,
ε
/MPa
σ
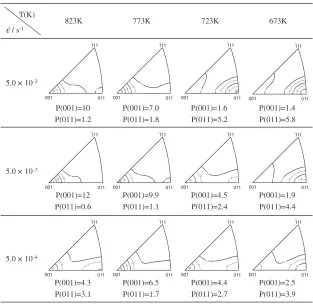
[image:2.595.59.280.69.317.2] [image:2.595.318.534.71.255.2]deformed at various temperatures and true strain rates up to a strain of1:0. The average pole density is used as a unit for drawing the contour lines. The pole densities at (001) and (011) are given below the inverse pole figure as P(001) and P(011). Although some general trend is seen, for example, {001} component evolves and {011} component weakens with increasing temperature for the same strain rate, it can be said that both texture components and their sharpness vary depending on temperature and strain rate in a complex manner.
3.3 Grain structure map
Figure 4 shows the grain structure maps examined at strains of (a)0:6, (b)0:8and (c)1:0for the deformation at 773 K with a strain rate of5:0103s1. Equiaxed grain
structures are constructed. The map was measured on the mid-plane section. Inverse pole figure for (c) is given in Table 2 where the pole density at (001) is 9.9 times of the random level. It is seen that the area fraction of {001} increases with an increase in strain while that for {011} decreases. It seems that the size of {001} oriented grains are
1 1
1
2 2
2 2
2
15 10
5
1 1 2
1
2 2
1
1
1
2
1 2
2
2 2
5
5
5
1 2
1 1 17
10
5
10
1 5
(a) (b)
45
°
60
°
Fig. 3 {011} pole figures after the deformation (a) at 823 K with a strain rate of5:0103s1and (b) at 673 K with a strain rate of
[image:3.595.84.516.71.262.2]5:0102s1, up to a true strain of1:0. The pole density is projected onto the compression plane. The average pole density is used as a unit.
Table 2 Inverse pole figures for compression planes of AA5182 under final true strain of1:0. The average pole density is used as a unit.
T(K)
ε' / s-1
823K 773K 723K 673K
5.0 × 10⁻²
5.0 × 10⁻³
5.0 × 10⁻⁴
P(001)=10 P(011)=1.2
P(001)=7.0 P(011)=1.8
P(001)=1.6 P(011)=5.2
P(001)=1.4 P(011)=5.8
001 011
111
001 011
111
001 011
111
001 011
111
P(011)=0.6 P(011)=1.1 P(011)=2.4 P(011)=4.4 P(001)=12 P(001)=9.9 P(001)=4.5 P(001)=1.9
001 011
111
001 011
111
001 011
111
001 011
111
P(001)=4.3 P(011)=3.1
P(001)=6.5 P(011)=1.7
P(001)=4.4 P(011)=2.7
P(001)=2.5 P(011)=3.9
001 011
111
001 011
111
001 011
111
001 011
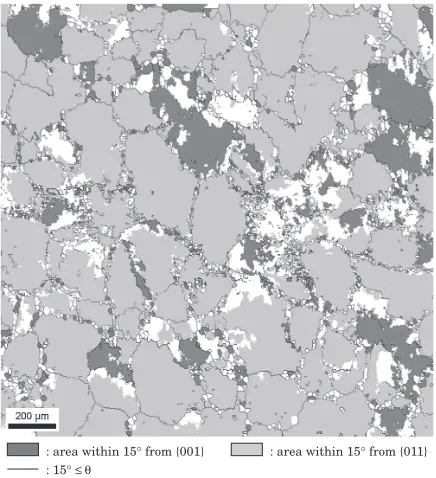
[image:3.595.141.454.338.642.2]larger than that of the other orientations. Figure 5 shows the microstructure after the deformation at 673 K with a strain rate of5:0102s1 up to a strain of1:0. The texture for
this deformation is given also in Table 2. In this case the pole density at (001) is 1.4 while that at (011) is 5.8; the texture transition from {011} to {001} does not proceed in this case. It is seen that the grains with {011} orientation is much larger than that before deformation. Different from Fig. 4, many small grains are generated along the grain boundaries. This suggests that large grains with {011} orientation are formed by the compression deformation with crystal rotation by f111gh110islip.
4. Discussion
4.1 Comparison of the textures formed in Al-5 mass%Mg and AAAl-5182
As shown in Table 1, AA5182 is the aluminum alloy containing Mg about 4.5 mass%. Okayasu et al.7) investi-gated the textures developed under high temperature uniaxial compression of Al-5 mass%Mg alloy in various temperatures and strain rates. It was found that {001} texture became sharpest by the deformation at 673 and 723 K with a strain rate of5:0104s1up to1:0in true strain. The textures
in these two deformation conditions are given in Table 3. Comparison of Table 3 with the results on AA5182 at the same deformation conditions given in Table 2 elucidates that the pole densities at (001) of AA5182 is much less than those for 5 mass%Mg; the pole densities of Al-5 mass%Mg are higher than 8 while those for AAAl-5182 are less than 5. Furthermore, the main component of AA5182 is
: 15° θ
: area within 15° from {001} : area within 15° from {011}
Fig. 5 Grain structure map of AA5182 on the mid-plane section from EBSD. The deformation is conducted at 673 K under a final strain rate of
5:0102s1up to a true strain of1:0. The dark gray grains are within 15 degrees from {001}(compression plane) orientation and light gray grains are within 15 degrees from {011} orientation, respectively. High angle grain boundaries are drawn by a misorientation angle () greater than 15 degrees using black line.
(c) (b) (a)
: 15
° θ
: area within 15
°
from {001}
: area within 15
°
from {011}
[image:4.595.67.270.70.704.2] [image:4.595.318.536.72.311.2]{011} for the deformation at 673 K, namely the development of {001} is suppressed in AA5182. Okayasu et al.5) investigated the texture formation in Al-3Mg alloys with Al3Sc precipitates and found that the formation of {001}
component was remarkably retarded. This suggests that the grain boundary migration enhances the development of {001} component.
According to Table 3 the flow stresses of Al-5 mass%Mg at 673 K and 723 K are 20 MPa and 13 MPa, respectively. The stresses for AA5182 at the same deformation conditions are 35 MPa and 19 MPa, which are much higher than those for binary alloys. As described above, Mg concentration is 4.5 mass% in AA5182. Therefore, the differences in the flow stresses between the binary alloy and AA5182 can not be attributed to the difference in Mg contents. However, AA5182 contains other solute elements such as Mn and Cu. Furthermore, particles might increase the flow stress, although their existence was not confirmed in this study. High temperature yielding was seen at the deformation of AA5182. This indicates that the solute atmosphere dragging is the dominant deformation mechanism. Hence it is considered that the higher flow stresses of AA5182 corre-spond to the higher dislocation densities10)which drive grain boundary migration. As no large difference in shear modulus is expected between the binary alloy and AA5182, the difference in flow stress indicates that the driving force for grain boundary migration in AA5182 might be higher than that for the binary alloy. However, the evolution of {001} component is not seen. Thus it can be said that the elements other than Al and Mg in AA5182 suppresses grain boundary migration resulting in the weak development of {001} component.
As shown in Table 2, {001} texture is sharpest at 823 K; the maximum pole density is 12 times of the random level. This indicates that the higher mobility of grain boundary is important in the formation of {001} texture in AA5182. The effects of temperature and strain rate on the development of {001} are discussed in detail in 4.2 and 4.3.
4.2 Effect of deformation condition on texture forma-tion
As already mentioned in 3.2, formation of fiber texture is confirmed in all the deformation conditions. Table 2 shows
that the area of high pole density appears in (001) and/or (011). It is seen that the pole densities vary depending on deformation temperature and strain rate at the same time. It is also seen that the pole densities between the two areas of high pole densities are quite low, in other words, the pole densities are not continuous between the two areas. This is one of the manifestations of the transition mechanism from {011} to {001}. If slip deformation generates the texture change, continuous distribution of the pole densities from (011) towards (001) should be observed.
The pole densities at (001) monotonically decrease with a decrease in temperature for the strain rate of5:0102s1. On the contrary, pole densities at (011) increase with decreasing temperatures. This tendency, however, is not seen for the strain rate of5:0104s1. Influence of strain
rate on the pole densities at (001) and (011) seems to be also complicated. For example, the pole densities at (001) increases with decreasing strain rate from5:0102s1 to
5:0103s1. However further decrease in strain rate to
5:0104s1 results in the decrease in the pole density
except for the results at 673 K. These results indicate that there are several factors which affect the development of {001} and the predominant factor varies depending on both temperature and strain rate.
Figure 6 shows the relationship between flow stress at a strain of1:0 and mean grain sizes for {001} grains and all grains on the deformation conditions showing the pole densities of (001) higher than 4. In the evaluation of grain size, grains smaller than 10mmwere omitted. In all the cases, the mean grain size for {001} is larger than that for all grains. Since the latter includes the grains with {001} orientation, this means that the grains other than {001} orientation are much smaller than those for {001}. This is the evidence that the preferential growth of {001} grains by grain boundary migration drives the development of {001} texture.
4.3 {001} texture map
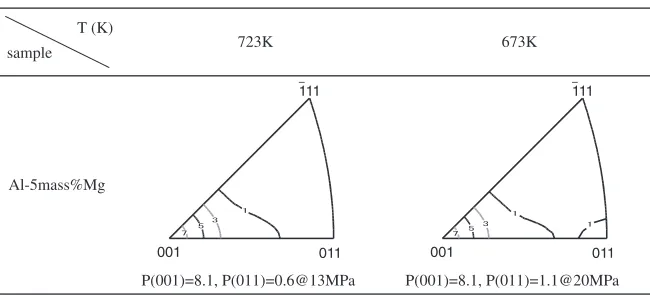
[image:5.595.135.460.94.242.2]The {001} texture has both negative and positive effects on the plastic workability of aluminum alloys. Thus it is important to clarify the deformation conditions for the development of {001} component. As discussed in 4.2, grain boundary migration is the key process for the development of {001} texture. Hence, texture sharpness is plotted against Table 3 Inverse pole figures for compression planes of Al-5 mass%Mg at a strain rate of5:0104s1up to a true strain of1:0.7ÞThe
average pole density is used as a unit.
T (K)
sample 723K 673K
Al-5mass%Mg
P(001)=8.1, P(011)=0.6@13MPa P(001)=8.1, P(011)=1.1@20MPa
001 011
111
001 011
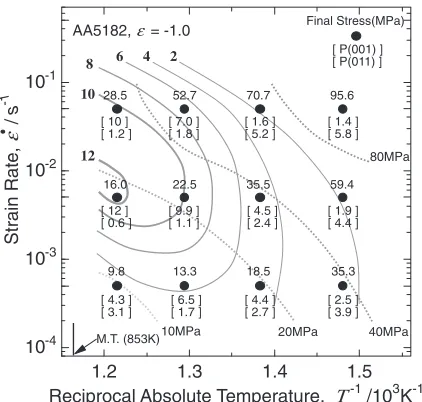
flow stress (stored energy) and deformation temperature (grain boundary mobility) in Fig. 7. Vertical and horizontal axes are strain rate and temperature, respectively. Constant flow stress contours are given by the broken lines. The numerical values under the closed circles express the pole densities at (001) and (011) in the inverse pole figures such as shown in Table 2. From these pole densities, contour lines for pole densities of 2, 4, 6, 8, 10 and 12 are drawn by gray solid line.
Comparison of the pole densities for (001) along the same flow stress elucidates the important aspects of the {001} formation. For example, pole densities for 20 MPa increase from 4.4 to 12 via 9.9. This means that if the stored energy is the same, higher temperature results in the sharper {001} texture. The same trend can be seen also for 40 MPa. For the higher stresses such as 80 MPa, such characteristic is not
seen, because of the change in deformation mechanism which is suggested by the grain structure map shown in Fig. 5. When the flow stress is lower than 10 MPa, the {001} texture becomes weak. As discussed in 4.1, it is considered that the development of {001} can be attributed to the mobility of grain boundary and driving force. Thus the weakening of the texture might be understood as the result of the decrease in the driving force. However, there is another possibility; the change in deformation mechanism which needs further examination.
5. Conclusions
The formation behavior of {001} texture (compression plane) by high temperature uniaxial compression is exper-imentally studied under the comparison with the results on Al-Mg binary alloys. The major results are as follows.
(1) Texture transition from {011} (compression plane) to {001} with increasing strain occurs also in AA5182. The texture in AA5182, however, is much weaker than that for the binary alloy with similar Mg content at the same deformation conditions.
(2) The size of {001} grains is much larger than that for all grains at the deformation conditions giving sharp {001} texture. This indicates that the formation of {001} texture after large amount of strain should be attributed to grain boundary migration.
(3) Sharpness of {001} component can not be simply given as a function of temperature or strain rate. For under-standing the behavior of texture formation, {001} texture map is proposed where the texture sharpness for {001} component is given by contours within the temperature-strain rate field with the additional con-tours for flow stresses. The texture map helps to identify the process condition for texture control.
(4) Examination of the {001} texture map elucidates that higher temperature gives the sharper {001} texture when flow stress is the same. This also suggests the key role of grain boundary migration for the development of {001} texture.
Acknowledgement
The authors appreciate The Japan Light Metal Educational Foundation, Inc. for the financial support.
REFERENCES
1) H. Inoue and T. Takasugi: Mater. Trans.48(2007) 2014–2022. 2) H. Murakami and T. Senuma: ISIJ Int.38(1998) 653–660.
3) S. Ikawa, M. Asano and S. Hirano: Abstracts of the 116th Annual Meeting of the Japan Institute of Light Metals (2009) pp. 301–302. 4) K. Okayasu and H. Fukutomi: J. Japan Inst. Metals70(2006) 562–567. 5) K. Okayasu, H. Takekoshi and H. Fukutomi: Mater. Trans.48(2007)
2002–2007.
6) K. Okayasu, M. Sakakibara and H. Fukutomi: Mater. Process. Texture: Ceramic Trans.200(2008) 679–685.
7) K. Okayasu and H. Fukutomi: J. Japan Inst. Metals73(2009) 58–63. 8) M. Otsuka and R. Horiuchi: J. Japan Inst. Metals36(1972) 809–817. 9) M. Dahms and H. J. Bunge: J. Appl. Crystallogr.22(1989) 439–447. 10) R. Horiuchi and M. Otsuka: Trans. Japan Inst. Metals13(1972) 284–
293.
10MPa 20MPa 40MPa
80MPa 12
10
8 6 4 2
1.2 1.3 1.4 1.5
10-4 10-3 10-2 10-1
Reciprocal Absolute Temperature, Τ-1 /103K-1
Strain Rate,
ε
/
s
-1
[image:6.595.64.277.69.282.2] [image:6.595.63.274.342.543.2]AA5182, ε = -1.0
[ 4.4 ] [ 2.7 ] [ 6.5 ]
[ 1.7 ]
[ 1.6 ] [ 5.2 ] [ 7.0 ]
[ 1.8 ]
[ 4.5 ] [ 2.4 ] [ 9.9 ]
[ 1.1 ]
[ 2.5 ] [ 3.9 ] [ 1.9 ] [ 4.4 ] [ 1.4 ] [ 5.8 ]
[ 12 ] [ 0.6 ] [ 10 ] [ 1.2 ]
[ 4.3 ] [ 3.1 ]
[ P(001) ] [ P(011) ]
M.T. (853K) 28.5
Final Stress(MPa)
52.7
16.0
9.8 13.3 18.5 35.3
59.4 35.5
22.5
95.6 70.7
Fig. 7 {001} texture map at1:0in true strain for AA5182 showing the effect of strain rate and temperature on the development of {001} texture.
µ
m
AA5182 ε at ε = -1.0
5 ×10 -2s-1
5 ×10 -3s-1
-4 -1
ε All
Grains
100
rain Size, /
5 ×10 s [{001} pole density] [{110} pole density]
50 Mean G [10] [1.2] [9.9] [1.1] [4.4] [2.7] [12] [0.6] [6.5] [1.7] [4.3] [3.1] 10 50 [7.0] [1.8] [4.5] [2.4] 823K 773K 723K
True Stress, σ /MPa
(001)