warwick.ac.uk/lib-publications
Original citation:
Gorfman, Semën, Keeble, Dean S., Bombardi, Alessandro and Thomas, Pam A.. (2015)
Topology and temperature dependence of the diffuse X-ray scattering in Na0.5Bi0.5TiO3
ferroelectric single crystals. Journal of Applied Crystallography, 48 (5). pp. 1543-1550.
Permanent WRAP URL:
http://wrap.warwick.ac.uk/80050
Copyright and reuse:
The Warwick Research Archive Portal (WRAP) makes this work of researchers of the
University of Warwick available open access under the following conditions.
This article is made available under the Creative Commons Attribution 4.0 International
license (CC BY 4.0) and may be reused according to the conditions of the license. For more
details see:
http://creativecommons.org/licenses/by/4.0/
A note on versions:
The version presented in WRAP is the published version, or, version of record, and may be
cited as it appears here.
Received 29 April 2015 Accepted 21 August 2015
Edited by G. Kostorz, ETH Zurich, Switzerland
Keywords:single-crystal diffuse X-ray scattering; lead-free ferroelectrics; high-resolution X-ray diffraction; perovskites; Na0.5Bi0.5TiO3.
Supporting information:this article has supporting information at journals.iucr.org/j
Topology and temperature dependence of the
diffuse X-ray scattering in Na
0.5Bi
0.5TiO
3ferroelectric single crystals
Seme¨n Gorfman,a* Dean S. Keeble,b Alessandro Bombardiband Pam A. Thomasc
a
Department of Physics, University of Siegen, Walter-Flex Strasse 3, Siegen 57072, Germany,bDiamond Light Source, Harwell Science and Innovation Campus, Didcot OX11 0DE, UK, andcDepartment of Physics, University of Warwick, Gibbet Hill Road, Coventry CV4 7AL, UK. *Correspondence e-mail: [email protected]
The results of high-resolution measurements of the diffuse X-ray scattering produced by a perovskite-based Na0.5Bi0.5TiO3 ferroelectric single crystal
between 40 and 620 K are reported. The study was designed as an attempt to resolve numerous controversies regarding the average structure of Na0.5Bi0.5TiO3, such as the mechanism of the phase transitions between the
tetragonal,P4bm, and rhombohedral | monoclinic,R3c|Cc, space groups and the correlation between structural changes and macroscopic physical properties. The starting point was to search for any transformations of structural disorder in the temperature range of thermal depoling (420–480 K), where the average structure is known to remain unchanged. The intensity distribution around the {032} pseudocubic reflection was collected using a PILATUS 100K detector at the I16 beamline of the Diamond Light Source (UK). The data revealed previously unknown features of the diffuse scattering, including a system of dual asymmetric L-shaped diffuse scattering streaks. The topology, temperature dependence, and relationship between Bragg and diffuse intensities suggest the presence of complex microstructure in the low-temperatureR3c|Ccphase. This microstructure may be formed by the persistence of the higher-temperature P4bmphase, built into a lower-temperatureR3c|Ccmatrix, accompanied by the related long-range strain fields. Finally, it is shown that a correlation between the temperature dependence of the X-ray scattering features and the temperature regime of thermal depoling is present.
1. Introduction
Na0.5Bi0.5TiO3 (NBT) is a ferroelectric material that is
inter-esting both as the foundation of many potential lead-free piezoelectrics (Takenakaet al., 2008) and as a model system for the crystallography of perovskites (Mitchell, 2003). NBT is unusual in showing at least two polymorphic structural phase transformations (Vakhrushev et al., 1985; Park et al., 1996; Jones & Thomas, 2002), formation of hierarchical domain systems and peculiar structural disorder (Yao et al., 2010; Levin & Reaney, 2012). Despite a significant number of X-ray and neutron diffraction studies (Jones & Thomas, 2000; Jones & Thomas, 2002; Aksel, Forrester, Kowalskiet al., 2011; Geet al., 2013; Rao, Fitch & Ranjan, 2013; Rao, Dattaet al., 2013; Carter et al., 2014), electron microscopy investigations (Beanland & Thomas, 2011; Dorcet & Trolliard, 2008; Dorcet et al., 2008; Liu et al., 2012; Ma et al., 2013) and density functional theory calculations (Gro¨ting et al., 2011, 2012; Meyer et al., 2015), considerable disagreement about the average structure of NBT remains.
The commonly accepted reference point stems from the seminal neutron powder diffraction study of Jones & Thomas (2002). They reported two temperature-induced phase
sitions, involving changes of average symmetry, realignment of polarization and the modification of oxygen octahedral tilt systems: (a) T ’ 840 K, the transition between the cubic paraelectric, Pm33m, phase and tetragonal ferro(i)electric, P4bm, phase with thea0a0cþoctahedral tilt system according
to the Glazer (1972) notation; (b) T’570 K, the transition between tetragonal ferro(i)electric,P4bm, and rhombohedral ferroelectric, R3c, phases (aaa octahedral tilt system). Despite the wide acceptance of this phase pattern as a framework, the fine structural details, especially those in the nominally rhombohedral R3c phase, are still the matter of revisions and apparent contradictions. Even the original work of Jones & Thomas (2002) documented local departures from theR3caverage structure in the form of significant disorder of the Bi positions. Furthermore, the mechanism of transition between the structures described by theR3candP4bmspace groups, which lack a group–subgroup relation, remains unex-plained.
A rapid reassessment of the NBT average structure began from the single-crystal X-ray diffraction work of Gorfman & Thomas (2010) and synchrotron X-ray powder diffraction work of Aksel, Forrester, Joneset al.(2011). Benefiting from the capabilities of modern instruments, both studies inde-pendently presented evidence of a lower-symmetry long-range monoclinic phase, withCcrather thanR3c symmetry. Subse-quently, Ma et al. (2013) have confirmed the long-range Cc symmetry of NBT by careful analysis of the half-integer pseudocubic reflections, using transmission electron micro-scopy. They noted, however, that the NBT structure evolves into R3c after a small addition of BaTiO3. Rao & Ranjan
(2012) and Rao, Fitch & Ranjan (2013) suggested a coex-istence of monoclinic and rhombohedral phases below570 K and reported that the monoclinic phase,Cc, can be irreversibly driven into the rhombohedralR3cphase by the application of an external electric field. Observation of optical birefringence in NBT single crystals by Gorfman et al. (2012) supplied further evidence of the monoclinic symmetry of the lower-temperature NBT phase. This work reported a 2 (1) K temperature window of optically isotropic phase just below the phase transition at 573 (20) K, which remains unexplained and suggests hidden and complex mechanisms driving this phase transition. However, Beanland & Thomas (2014) have carefully inspected NBT using a novel computer-controlled electron microscopy technique and concluded that any defect-free areas of NBT must be described by the R3c symmetry. The apparent bulk monoclinic symmetry of NBT was ques-tioned by Geet al.(2013), who suggested that it must be rather attributed to a skin effect. Considering all the existing controversies we will refer to the low-temperature phase here asR3cjCc.
Another puzzling problem is the mismatch between the reported temperature dependence of the average structure and physical properties: the piezoelectricity in poled NBT ceramics is irreversibly lost upon heating at 420–480 K (Hirumaet al., 2009; Akselet al., 2012; Forondaet al., 2014). None of the studies report any abrupt structural changes at these temperatures. Only recently, Rao, Datta et al. (2013)
performed temperature-dependent neutron powder diffrac-tion on poled NBT ceramics and suggested that the onset of thermal depoling might be caused by the appearance of regions with octahedral tilt systems matching that of the tetragonal symmetry, P4bm. Thus, the properties of NBT might be influenced by the local structural disorder and microstructure: the parameters which go beyond the average atomic structure.
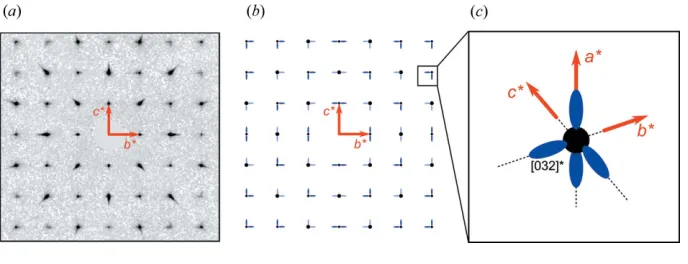
Indeed, NBT is known for a significant structural disorder. For example, the shortest Bi—O bond distance, calculated from the average structure as 2.53 A˚ , disagrees with the 2.2 A˚ bonds observed with EXAFS (Shuvaevaet al., 2005). Keeble et al.(2013) and Akselet al.(2013) analysed the total neutron scattering by means of reverse Monte Carlo simulation, concluding that accounting for total neutron scattering instead of isolated Bragg peaks resolves this controversy. Further direct evidence of structural disorder is provided by single-crystal diffuse X-ray scattering (DS) (Kreisel et al., 2003; Thomaset al., 2010) and singe-crystal neutron scattering data (Balagurovet al., 2006; Geet al., 2013). Although strong DS is quite common for perovskite-based ferroelectrics and relaxor ferroelectric single crystals (e.g. Xuet al., 2006; Stock et al., 2007; Pas´ciaket al., 2012; Bosaket al., 2012), X-ray DS in NBT is highly unusual. It exhibits a scheme of asymmetric DS streaks, emanating from the Bragg peaks and generally extending along the lower-angular h001i directions (the pseudocubic cell setting is used for indexing throughout this study). More specifically, fhklg reflections (h;k;l6¼0) are decorated by three DS streaks, extending towards decreasing absolute values of|h|,|k|and|l|;fhk0greflections (h;k6¼0Þare decorated by four streaks: one each extending towards decreasing |h| and |k|, and two others extending towards increasing|l|;fh00greflections (h6¼0) are decorated by four DS streaks towards increasing|k|and|l|. The intensity of these streaks is hkl dependent: for example, they are particularly strong around {032}-type peaks and can be easily observed using a laboratory-based single-crystal X-ray diffractometer, whereas they are barely visible arounde.g.{110}-type peaks. Fig. 1 shows (a) typical diffraction data as observed using a laboratory diffractometer, along with (b) a schematic of the DS in the 0klplane and (c) a schematic of the DS distribution around the [032]* reciprocal lattice point, highlighting the asymmetry of the DS. Kreiselet al.(2003) modelled this DS by including planar ‘island’ sheets in the rhombohedral ‘matrix’ of NBT, where Bi and Na atoms are displaced in h001i directions off the threefoldh111i axis. Although this model predicts the appearance of asymmetric DS streaks, it fails to reproduce the exact topology observed,e.g.the presence of local intensity maxima along the streaks (Thomaset al., 2010). It is also only an empirical model and therefore contains no intrinsic chemical or physical reasoning for the formation of such planar sheets. Furthermore, it is not known how the DS changes with temperature and, in contrast to the average structure, whether or not there is evidence in the DS of a structural transition that accompanies the loss of piezoelectric properties at 420–480 K. Finally, Geet al.(2013) reported that neutron diffuse scattering is qualitatively different from X-ray
1544
Seme¨n Gorfmanet al. Diffuse X-ray scattering in Nadiffuse scattering: while weak h001i-oriented streaks are observed using neutron scattering, their distribution around Bragg peaks exhibits twofold rotational symmetry.
The first aim of this work is to reinvestigate the exact topology of the X-ray DS by using a state-of-the-art high-resolution synchrotron X-ray diffractometer. The second aim is to probe the temperature dependence of this DS to assess the role of the structural disorder in the physical properties of NBT. Finally, we examine the role of structural disorder in the mechanism of the phase transition between theR3cjCcand P4bm phases. Understanding this mechanism in NBT may advance the understanding of structural mechanisms of phase transition in other functional ferroelectrics such as lead zirconate titanate (PbZr1xTixO3), as well as popular solid
solutions of NBT such as Na0.5Bi0.5TiO3–BaTiO3(NBT–BT).
2. Experiment
High-resolution measurements of the X-ray diffuse scattering were performed at the I16 beamline at Diamond Light Source, UK. An NBT single crystal was grown by the flux method as previously described by Jones & Thomas (2000). A fragment of straw-coloured crystal was selected, oriented and cut parallel to one of the pseudo-cubically equivalent (011) Miller planes. The crystal of approximately 1 1 0.1 mm was attached to a silicon wafer using conductive silver paint and then mounted in a Lakeshore cryofurnace. The orientation of the crystal on the silicon wafer ensured easy access to one of the {032} reflections on the I16 six-circle diffractometer. We collected reciprocal space volumes around the½032point of reciprocal space and in the temperature range 40–620 K (i.e. up to and beyond the transition to the tetragonal phase at 573 (20) K (Gorfmanet al., 2012) on both heating and cooling. The maps were taken every 20 K below 400 K, every 5 K between 400 and 560 K, and every 1 K above 560 K. We tuned the X-ray wavelength/energy to 0.93 A˚ /13.3 keV: this is close to the Bi LIIIabsorption edge (0.92 A˚ /13.4 keV) to balance
reciprocal space resolution and attenuation. At this energy and for the geometry of the 032 reflection, the average X-ray
penetration depth was 19.7mm. The scattered intensity in each slice of reciprocal space was measured using a PILATUS 100K detector (DECTRIS), and a reciprocal space volume was built up by taking sequential frames every 0.02 in!. The resolution in 2
andwas set by the pixel size of the PILATUS to 0.015. This
experi-mental methodology resulted in
sampling reciprocal space with a resolution of 0.0015 pseudocubic reciprocal lattice units (r.l.u.). Furthermore, we benefited from the high dynamic range of the PILATUS (Kraft et al., 2009) to capture the intensity extending over strong Bragg and weak diffuse scattering signal.
3. Results
3.1. Topology of the L-shaped diffuse scattering
Fig. 2 shows the reconstructed three-dimensional reciprocal space volume (RSV), with isosurfaces of three-dimensional scattering intensity distribution,IðHÞ, around theH0¼ ½032
reciprocal lattice point, collected at a temperature of 40 K. Fig. 2(a) compares the schematics of the RSV from the previous lower-resolution experiments with the result of the presented high-resolution experiments. Figs. 2(b) and 2(c) view the RSV along the [100]* and [001]* directions, respec-tively. The detailed RSV (in animated form) is available in the supporting information.
The collection of high-resolution RSVs gives us the added ability to extract reciprocal space maps (RSMs) from arbitrary planes, two of which are shown in Fig. 3. These RSMs highlight the fine details of the DS topology: they pass through the maximum of the three-dimensional scattering intensity and are parallel to the 0kl(Fig. 3a) andh0lr (Fig. 3b) reciprocal
[image:4.610.48.392.71.203.2]space planes, wherelr¼ ðH H0Þ=H0,i.e.the projection along
Figure 2
Three-dimensional reconstructions of the DS around the H0¼ ½032
point of the reciprocal lattice. (a)represents the schematic view of the DS scattering around this point of the reciprocal lattice and reconstructs the three-dimensional contour of the present high-resolution I16 DS measurement. (b), (c) represent the same contours, using different projections. An animated three-dimensional version of this reciprocal space volume is available in the supporting information.
Figure 1
An overview of the previously known information about the topology of the L-shaped DS streaks in NBT. (a) 0kl section of reciprocal space reconstructed from the data collected using a home-laboratory Gemini R diffractometer. (b) A schematic diagram showing the topology of the diffuse scattering streaks (blue) in relation to the Bragg scattering (black). (c) An enlarged three-dimensional schematic view of a smaller reciprocal space volume. The streaks extend along one of the
[image:4.610.318.563.573.672.2]the line connecting the origin of reciprocal space to theH0=
½032 reciprocal lattice point. These RSMs reveal previously unseen features of the DS, which are described below.
3.1.1. DS Streaks. There are two ‘systems’ of h001i DS
streaks: stronger streaks extend towards the lower scattering angles (larger d spacing), whilst weaker streaks extend towards the higher scattering angles (smallerdspacing). The stronger streaks were observed in all the previous measure-ments (Fig. 1). However, this is the first observation of the weaker streaks, which have never been accounted for in any model describing structural disorder in perovskite-based materials.
3.1.2. Bragg peaks. The Bragg peak is split into two
components: a stronger component (later referred to as the ‘matrix’ peak) and a second peak of weaker intensity closer to the origin (later referred to as the ‘island’ peak), separated from the stronger component by a plane of low intensity. Careful inspection of the temperature dependence of these peaks will suggest that their splitting cannot be accounted for by twinning/ferroelastic domains.
3.1.3. Relationship between the diffuse scattering streaks and the
Bragg peaks. We see that the
stronger DS streaks decorate the ‘island’ peak, whilst the weaker DS streaks decorate the ‘matrix’ peak. The two ‘Bragg’ peaks are separated by a plane of low-intensity scattering, which appears perpendicular to the ½032 reciprocal lattice direction. This feature is reminiscent of the plane of low intensity that results from so-called Huang scattering (Ekstein, 1945; Krivoglaz, 1996). Huang scattering is the DS produced by long-range elastic fields created by point defects in a crystal. For example, Huang scattering has been recently reported in the DS from single crystals of PbZr1xTixO3
(Burkovsky et al., 2012). The presence of the low-intensity plane suggests that the observed DS from NBT might occur as a result of a similar type of long-range elastic strain field. We should note, however, that there is an important difference between the observed DS and Huang scattering: Huang scattering is symmetrically distrib-uted around a Bragg node, whereas the observed DS in NBT is not.
3.2. Temperature dependence of the scattering intensity
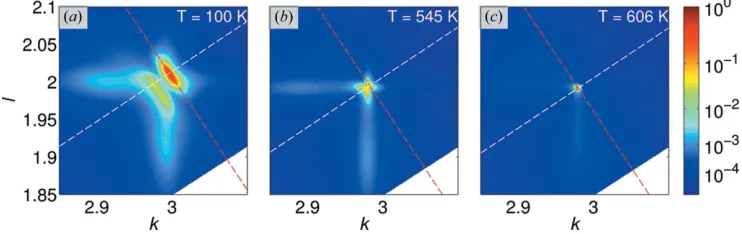
The observed intensity distributions are temperature dependent. Fig. 4 displays the RSMs [the same section as in Fig. 3(a)] at three temperatures upon heating: 100 K [below the R3cjCc–P4bm phase transition; Fig. 4(a)], 545 K [on approach to the phase transition; Fig. 4(b)] and 606 K [above the phase transition; Fig. 4(c)]. An animation of the temperature dependence of the RSVs (on both heating and cooling) is available in the supporting information. It shows that all of the scattering described above becomes weaker at higher temperature and below the phase transition. The RSV collected above the phase transition consists of a single Bragg
1546
Seme¨n Gorfmanet al. Diffuse X-ray scattering in Na [image:5.610.51.393.72.223.2]0.5Bi0.5TiO3 J. Appl. Cryst.(2015).48, 1543–1550
Figure 4
The temperature dependence of the RSMs around the½032reciprocal lattice point, as seen on the 0klplane in Fig. 3(a). The first two temperatures, (a) 100 K and (b) 545 K, correspond to the lower-temperatureR3cjCcphase; (c) 606 K corresponds to the tetragonalP4bmphase. The white and red dashed lines show the crystallographic½032and½0233directions, respectively [as in Fig. 3(a)]. An animated version of this figure is available in the supporting information.
Figure 3
[image:5.610.121.492.586.703.2]reflection decorated by some very weak DS streaks that extend towards the lower scattering angles; this Bragg peak appears extremely sharp, with a full width at half-maximum of only 0.003 r.l.u. In order to describe quantitatively the thermal evolution of the scattering we will discuss now in turn the behaviours of the Bragg and diffuse scattering features.
3.2.1. Temperature dependence of the Bragg scattering:
the evidence for low-temperature phase segregation. Fig. 5
summarizes the temperature dependence of the radial inten-sity profile, reconstructed along the ½032 reciprocal lattice direction and passing through the overall intensity maximum. For each temperature the one-dimensional radial intensity, RðlrÞ, is reconstructed from the three-dimensional data as
RðlrÞ ¼
R R
Iðh;Yr;lrÞdhdYr, where Yr represents the
coor-dinate parallel to the ½0233 reciprocal lattice direction. The integration was carried out over a 0.020.02 r.l.u. square. The radial direction lr is shown by the arrow in Fig. 5(a), the
borders of the integration are shown by the dashed lines, and the resultant radial profile for the 300 K data is shown in Fig. 5(b). The thermal evolution of this profile describes the radial splitting of the Bragg reflection as a function of temperature (Fig. 5c).
Fig. 5(c) shows that far from the phase transition both island and matrix Bragg peaks move to larger d spacing (lower lr
values) upon heating, which is consistent with thermal expansion. However, at455 K (i.e.120 K below the phase transition), some peculiarities appear: firstly, the position of the island peak reaches a point of inflection and begins to behave as though the corresponding sample volumes had
negative thermal expansion. This movement allows the island and matrix Bragg peaks to approach each other, yet as they do so the matrix peak disappears. The island peak continues into the high-temperature phase and becomes the very sharp single Bragg reflection associated with the tetragonal structure. Fig. 5(d) shows the details of the temperature dependence of the matrix and island intensities (IM and II), reconstructed
along the dashed lines in Fig. 5(c). It shows that the matrix peak decays linearly with the temperature, becoming immeasurably small a few kelvin before the nominal phase transition temperature. At the same time the island peak reduces by just 50% until it flows into the single sharp Bragg peak observed in the tetragonal phase.
Although the temperature dependence of the matrix and island peak positions looks similar to the behaviour expected for a ferroelastic phase transition, the temperature depen-dence of their intensities and the presence of diffuse scattering indicate a more complex picture. The continuation of the high-temperature Bragg peak into the island Bragg peak at lower temperatures and the absence of the matrix peak a few kelvin before the phase transition suggest that the island peak is a persistence of the tetragonal phase below the transition. We must assume some phase segregation, so that matrix peaks are diffracted by the dominating volumes of monoclinic/rhombo-hedral phase, whereas island peaks are diffracted from the tetragonal inclusions, remnants of the high-temperature tetragonal phase. Considering the lattice mismatch between higher- and lower-temperature phases we must also assume that such phase separation creates long-range deformation fields and produces the characteristic diffuse scat-tering pattern.
Note that similar phase segregation/local micro-structure models in NBT appear in the literature. For example, it resembles the model of tetragonal inclu-sions in a rhombohedral matrix suggested as a result of transmission electron microscopy imaging of NBT (Beanland & Thomas, 2011; Yaoet al., 2012). It agrees with the observation of Rao, Dattaet al.(2013) and Liuet al.(2012), who reported the appearance of in-phase octahedral tilt regions (a0a0c
þ octahedral tilt
systems), consistent with tetragonalP4bmsymmetry, in the R3cjCc phase. Similar formation of a0a0c
þ
planar defects was reported in 0.96NBT–0.04BT single crystals (Daniels et al., 2011, 2012), where h100i diffuse scattering rods were observed around half-integer reflections. Such planar defects were described as ‘stacking faults’, separating two rhom-bohedralaaadomains. The tetragonal symmetry
in such ‘stacking faults’ was also demonstrated by Beanland (2011). Alternatively, the segregations in the lower-temperature phase of NBT have been also discussed by Gro¨ting et al. (2011), who performed first-principle calculations to test the possible chemical ordering on theA site and suggested that such short-range ordering (with alternating layers of Bi and Na alongh100i) is possible below570 K and could provide nucleation sites for larger regions. Figure 5
The temperature dependence of the radial scattering intensity profile along the
[image:6.610.47.331.434.642.2]3.2.2. Thermal expansion coefficients of the matrix and island phases. This assumption of phase segregation below the phase transition is further supported by some simple macro-scopic strain analysis. The relative separation between the island and matrix Bragg peaks at 300 K (Fig. 5b) is lr=lr¼0:59 (4)%. It matches the separation between the
lattice parameters of the room-temperature phase and the lattice parameters of the high-temperature tetragonal phase reported by Jones & Thomas (2002): ðc673K
T a 273K R Þ=a
273K R ¼
0.52 (1)% [herec673K
T ¼3:9073 (2) A˚ is the tetragonalclattice
parameter at 673 K and a273K
R ¼3:8869 (2) A˚ is the
pseudo-cubicalattice parameter at room temperature]. We elaborated on this phase segregation idea by analysing the linear thermal expansion corresponding to each of the above phases. This
thermal expansion was calculated according to ¼
ð1=LrÞdLr=dT [Lrdenotes the positions of the maxima of
the peak(s)] and is shown in Fig. 6. The individual thermal behaviours of the phases differ. The position of the island peak appears almost temperature independent; it exhibits little overall thermal expansion between 40 and 573 K, reaching the maximum of 0.45105K1 at around 320 K. The position of the matrix peak adopts a more typical thermal expansion over this temperature range; it is comparable to the thermal expansion previously reported for NBT single crystals (1.50–1:75105K1) according to Park et al. (1996). This behavioural difference diverges further as the phase transition is approached, as the matrix peak enters a region of negative thermal expansion as previously mentioned. The system-atically lower thermal expansion of the tetragonal island phase suggests that the regions of this symmetry might be trapped by the monoclinic/rhombohedral structure that develops.
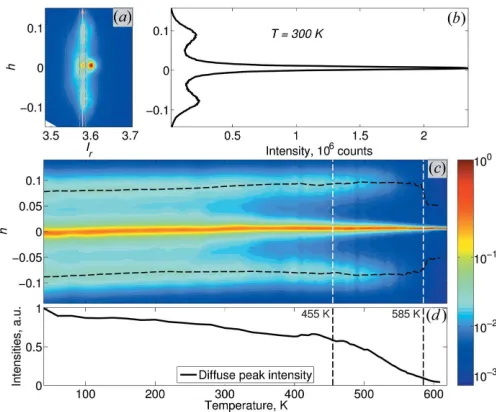
3.2.3. Temperature dependence of the diffuse streaks. Fig. 7 (organized in a similar way to Fig. 5) shows the temperature dependence of the diffuse scattering. The intensity profile in Fig. 7(b) is reconstructed from the three-dimensional data as DðhÞ ¼R RIðh;Yr;lrÞdYrdlr, where the integration was
carried out within a 0.0150.015 r.l.u. box. Fig. 7(a) indicates thehdirection and the corresponding integration box with an arrow and dashed lines, respectively. Fig. 7(b) shows the as-defined profile for the 300 K data. The temperature depen-dence of this profile is then displayed in Fig. 7(c). Fig. 7(d) follows the intensity of the diffuse streaks,IdðTÞ, reconstructed
along their maxima [shown by the dashed lines in Fig. 7(c)]. The intensity of the DS streaks decreases as the phase tran-sition is approached, in a fashion very reminiscent of the matrix Bragg peak.
3.2.4. Relationship between Bragg and diffuse scattering.
As a last step we investigated the relationship between the temperature dependences of the island and matrix Bragg peaks and the DS. We plot all these dependencies in the temperature range below 570 K, where the intensity of both peaks is measurable. Fig. 8 shows that the functional depen-dence of the DS intensity on the matrix Bragg peak intensity can be described by two linear regression intervals: below
1548
Seme¨n Gorfmanet al. Diffuse X-ray scattering in Na [image:7.610.86.256.68.198.2]0.5Bi0.5TiO3 J. Appl. Cryst.(2015).48, 1543–1550
Figure 7
The temperature dependence of the diffuse scattering intensity profile,
DðhÞ, along the [100]* direction. (a) The h0lr reciprocal space map, showing the direction along which theDðhÞprofile is taken (arrow) and the corresponding integration box (dashed lines); (b) the resulting intensity profile for the 300 K data; (c) false-colour map showing the temperature dependence of the intensity profile, the extracted peak positions of the DS streaks being highlighted by the dashed lines; (d) the extracted peak intensities (averaged over both streaks). The vertical dashed lines in both (c) and (d) mark the same temperatures as in Fig. 5.
Figure 8
Relationships between the intensities of the matrix Bragg peak, diffuse streaks (diamonds) and island (circles) Bragg peaks. The dashed red lines display the results of the linear regression in the two different temperature ranges: below 425 K and above 495 K. The change of the linear regression coefficient connecting the intensity of the diffuse scattering as a function of the matrix peak intensity points to the ‘virtual’ transition, involving the modification of the fine disorder parameter at these temperatures.
Figure 6
[image:7.610.47.295.447.653.2] [image:7.610.314.564.553.662.2]425 K and above495 K. The change of the linear regres-sion coefficient between these temperatures points to a possible ‘virtual’ phase transition, which describes the change of the balance between long-range-ordered structure (responsible for the Bragg peak) and structural disorder (responsible for the DS).
4. Conclusion
In conclusion, we have reconstructed the fine details of single-crystal DS from NBT with a resolution of103r.l.u. Then we have carefully inspected the topology and temperature dependence of the scattering and followed their evolution on the approach to and through theR3cjCctoP4bmstructural phase transition. Our data show that such a phase transition must generate the complex bulk microstructure of the R3cjCc phase and a correspondingly characteristic X-ray scattering pattern: the Bragg peak in the R3cjCc phase separates into two components, the weaker of which (‘island’ peak) behaves as a representative of the persistence of the tetragonalP4bmphase, while another, stronger peak (‘matrix’ peak) emerges just below the phase transition temperature. Both peaks are decorated by L-shaped DS streaks: the stronger streaks flow out of the island Bragg peak and extend towards lower scattering angles/higherdspacing; the weaker streaks flow out of the matrix Bragg peak, extending towards higher scattering angles/lowerdspacing. The two Bragg peaks, together with their associated DS, are separated by a plane of low intensity which is reminiscent of that observed because of Huang scattering. We have also found that the relative separation between the matrix and island Bragg peaks matches the relative separation between the lattice para-meters of the previously reported high-temperature (P4bmÞ and low-temperature ðR3cjCcÞ phases (Jones & Thomas, 2002).
The geometry and the temperature dependence of the scattering patterns suggest that the low-temperature phase may be a phase coexistence in which volumes of higher-temperature P4bm phase persist below the phase transition into the low-temperatureR3cjCcphase. Such microstructure must create a pattern of the long-range strain fields of monoclinic (m) point symmetry in bothR3cjCcmatrix and P4bmisland phase components. This model may account for the multiple controversies about the structure and symmetry of the low-temperature R3cjCc phase: ranging from purely rhombohedral R3c in the defect-free areas (Beanland & Thomas, 2014) to long-range monoclinic Cc (Gorfman & Thomas, 2010; Aksel, Forrester, Jones et al., 2011; Maet al., 2013) and the combination of both (Rao, Dattaet al., 2013). Considering this model of phase coexistence, it becomes possible to explain why the apparent symmetry depends on the length scale of the probe, the type of sample, doping and even the preparation history, in which case the local concen-tration of tetragonal inclusions may differ from sample to sample.
We must emphasize that more specific details of the struc-tural disorder responsible for the asymmetric L-shaped diffuse
scattering remain unknown. The topological similarity of the observed DS to Huang scattering suggests that the underlying structural disorder may originate from the long-range elastic deformation field, extending both inwards and outwards from the segregated tetragonal P4bm phase discussed above. However, Huang scattering does not account for the observed asymmetry of the DS streaks. Therefore, some essential modifications of the corresponding model of the structural disorder must be considered. For example, it is known that NBT may show significant positional disorder (e.g.Keebleet al., 2013) of the Bi atoms. We may assume that any long-range deformation field may trigger local atomic displacements, thus modifying the structural disorder. Such possible involvement of Bi displacements can be also supported by the fact that the reported X-ray diffuse scattering, which is highly dominated by Bi positions, strongly differs from neutron diffuse scattering (Geet al., 2013).
Despite remaining uncertainties, our studies evidence a ‘virtual’ phase transition that marks a change between two different temperature dependencies of the scattering inten-sities. The apparent match of the ‘virtual’ phase transition temperature in NBT with the temperature of thermal depoling is an interesting coincidence that merits further investigation.
Acknowledgements
We acknowledge Dr Dmitry Chernyshov (Swiss–Norwegian Beamlines at the ESRF, Grenoble, France) and Dr Alexei Bosak (ESRF, Grenoble, France) for stimulating discussions and Dr Steven Collins (Diamond Light Source, Didcot, UK) for experimental support.
References
Aksel, E., Forrester, J. S., Jones, J. L., Thomas, P. A., Page, K. & Suchomel, M. R. (2011).Appl. Phys. Lett.98, 152901.
Aksel, E., Forrester, J. S., Kowalski, B., Deluca, M., Damjanovic, D. & Jones, J. L. (2012).Phys. Rev. B,85, 024121.
Aksel, E., Forrester, J. S., Kowalski, B., Jones, J. L. & Thomas, P. A. (2011).Appl. Phys. Lett.99, 222901.
Aksel, E., Forrester, J. S., Nino, J. C., Page, K., Shoemaker, D. P. & Jones, J. L. (2013).Phys. Rev. B,87, 104113.
Balagurov, A. M., Koroleva, E. Y., Naberezhnov, A. A., Sakhnenko, V. P., Savenko, B. N., Ter-Oganessian, N. V. & Vakhrushev, S. B. (2006).Phase Transitions,79, 163–173.
Beanland, R. (2011).Acta Cryst.A67, 191–199.
Beanland, R. & Thomas, P. A. (2011).Scr. Mater.65, 440–443. Beanland, R. & Thomas, P. A. (2014).Phys. Rev. B,89, 174102. Bosak, A., Chernyshov, D., Vakhrushev, S. & Krisch, M. (2012).Acta
Cryst.A68, 117–123.
Burkovsky, R. G., Bronwald, Y. A., Filimonov, A. V., Rudskoy, A. I., Chernyshov, D., Bosak, A., Hlinka, J., Long, X., Ye, Z.-G. & Vakhrushev, S. B. (2012).Phys. Rev. Lett.109, 097603.
Carter, J., Aksel, E., Iamsasri, T., Forrester, J. S., Chen, J. & Jones, J. L. (2014).Appl. Phys. Lett.104, 112904.
Daniels, J. E., Jo, W. & Donner, W. (2012).JOM,64, 174–180. Daniels, J. E., Jo, W., Ro¨del, J., Rytz, D. & Donner, W. (2011).Appl.
Phys. Lett.98, 252904.
Dorcet, V. & Trolliard, G. (2008).Acta Mater.56, 1753–1761. Dorcet, V., Trolliard, G. & Boullay, P. (2008).Chem. Mater.20, 5061–
5073.
Foronda, H., Deluca, M., Aksel, E., Forrester, J. S. & Jones, J. L. (2014).Mater. Lett.115, 132–135.
Ge, W., Devreugd, C. P., Phelan, D., Zhang, Q., Ahart, M., Li, J., Luo, H., Boatner, L. A., Viehland, D. & Gehring, P. M. (2013).Phys. Rev. B,88, 174115.
Glazer, A. M. (1972).Acta Cryst.B28, 3384–3392.
Gorfman, S., Glazer, A. M., Noguchi, Y., Miyayama, M., Luo, H. & Thomas, P. A. (2012).J. Appl. Cryst.45, 444–452.
Gorfman, S. & Thomas, P. A. (2010).J. Appl. Cryst.43, 1409–1414. Gro¨ting, M., Hayn, S. & Albe, K. (2011). J. Solid State Chem.184,
2041–2046.
Gro¨ting, M., Kornev, I., Dkhil, B. & Albe, K. (2012).Phys. Rev. B,86, 134118.
Hiruma, Y., Nagata, H. & Takenaka, T. (2009).J. Appl. Phys.105, 084112.
Jones, G. O. & Thomas, P. A. (2000).Acta Cryst.B56, 426–430. Jones, G. O. & Thomas, P. A. (2002).Acta Cryst.B58, 168–178. Keeble, D. S., Barney, E. R., Keen, D. A., Tucker, M. G., Kreisel, J. &
Thomas, P. A. (2013).Adv. Funct. Mater.23, 185–190.
Kraft, P., Bergamaschi, A., Broennimann, Ch., Dinapoli, R., Eikenberry, E. F., Henrich, B., Johnson, I., Mozzanica, A., Schlepu¨tz, C. M., Willmott, P. R. & Schmitt, B. (2009). J. Synchrotron Rad.16, 368–375.
Kreisel, J., Bouvier, P., Dkhil, B., Thomas, P. A., Glazer, A. M., Welberry, T., Chaabane, B. & Mezouar, M. (2003).Phys. Rev. B,68, 014113.
Krivoglaz, M. A. (1996).X-ray and Neutron Diffraction in Nonideal Crystals. Berlin: Springer-Verlag.
Levin, I. & Reaney, I. M. (2012).Adv. Funct. Mater.22, 3445–3452. Liu, Y., Withers, R. L., Wang, J., Nore´n, L., Studer, A. J. & Li, Y.
(2012).J. Adv. Dielect.02, 1230012.
Ma, C., Guo, H. & Tan, X. (2013).Adv. Funct. Mater.23, 5261–5266.
Meyer, K.-C., Gro¨ting, M. & Albe, K. (2015).J. Solid State Chem.227, 117–122.
Mitchell, R. H. (2003).Perovskites: Modern and Ancient. Thunder Bay: Almaz-Press.
Park, S. E., Chung, S. J. & Kim, I. T. (1996).J. Am. Ceram. Soc.79, 1290–1296.
Pas´ciak, M., Heerdegen, A., Goossens, D. J., Whitfield, R. E., Pietraszko, A. & Welberry, T. R. (2012).Met. Mater. Trans. A,44, 87–93.
Rao, B. N., Datta, R., Chandrashekaran, S., Mishra, D. K., Sathe, V., Senyshyn, A. & Ranjan, R. (2013).Phys. Rev. B,88, 224103. Rao, B. N., Fitch, A. & Ranjan, R. (2013).Phys. Rev. B,87, 060102. Rao, B. N. & Ranjan, R. (2012).Phys. Rev. B,86, 134103.
Shuvaeva, V. A., Zekria, D., Glazer, A. M., Jiang, Q., Weber, S. M., Bhattacharya, P. & Thomas, P. A. (2005). Phys. Rev. B, 71, 174114.
Stock, C., Xu, G., Gehring, P. M., Luo, H., Zhao, X., Cao, H., Li, J. F., Viehland, D. & Shirane, G. (2007).Phys. Rev. B,76, 064122. Takenaka, T., Nagata, H. & Hiruma, Y. (2008).Jpn. J. Appl. Phys.47,
3787–3801.
Thomas, P. A., Trujillo, S., Boudard, M., Gorfman, S. & Kreisel, J. (2010).Solid State Sci.12, 311–317.
Vakhrushev, S. B., Isupov, V., Kvyatkovsky, B. E., Okuneva, N. M., Pronin, I. P., Smolensky, G. A. & Syrnikov, P. P. (1985).
Ferroelectrics,63, 153–160.
Xu, G., Zhong, Z., Bing, Y., Ye, Z.-G. & Shirane, G. (2006). Nat. Mater.5, 134–140.
Yao, J., Ge, W., Luo, L., Li, J., Viehland, D. & Luo, H. (2010).Appl. Phys. Lett.96, 222905.
Yao, J., Monsegue, N., Murayama, M., Leng, W., Reynolds, W. T., Zhang, Q., Luo, H., Li, J., Ge, W. & Viehland, D. (2012).Appl. Phys. Lett.100, 012901.