warwick.ac.uk/lib-publications
A Thesis Submitted for the Degree of PhD at the University of Warwick
Permanent WRAP URL:
http://wrap.warwick.ac.uk/101927/
Copyright and reuse:
This thesis is made available online and is protected by original copyright. Please scroll down to view the document itself.
Please refer to the repository record for this item for information to help you to cite it. Our policy information is available from the repository home page.
Understanding the formation and
responsive behavior of aqueous
polymer self-assemblies
Lewis David Blackman
Submitted for the degree of Doctor of Philosophy
University of Warwick
Department of Chemistry
I
Table of Contents
Table of Contents ... I
List of Figures, Schemes and Tables ... IV List of Figures ... IV
List of Schemes ... XVI
List of Tables ... XVII
Acknowledgements ... XVIII
Declaration of Authorship ... XXI Publications ... XXIII
Abbreviations ... XXVI
1. Introduction ... 1
1.1. Declaration of Authorship ... 2
1.2. Polymers and Synthetic Techniques ... 3
1.2.1. Introduction to polymers ... 3
1.2.2. Chain-growth polymerization and polymer architectures ... 5
1.2.3. Reversible deactivation radical polymerization (RDRP)... 8
1.2.4. RAFT polymerization ... 9
1.2.5. Photo-RAFT polymerization ... 15
1.3. Polymer Solution Self-Assembly ... 19
1.3.1. Polymer self-assembly under thermodynamic control. ... 19
1.3.2. Polymer self-assembly under kinetic control... 24
1.4. Polymerization-Induced Self-Assembly ... 29
1.4.1. Polymerization-induced self-assembly via thermal initiation ... 32
1.4.2. Polymerization-induced self-assembly via photoinitiation... 34
1.5. Stimuli-Responsive Polymers and Polymer Self-Assemblies ... 38
1.5.1. CO2 and pH-responsive polymer systems. ... 38
1.5.2. Light-responsive polymer systems ... 41
1.5.3. Polymer systems responsive to other stimuli ... 43
1.6. Analysis Techniques for Polymer Self-Assemblies ... 46
1.6.1. Light scattering techniques ... 46
1.6.2. Electron microscopy techniques ... 55
1.7. Summary ... 61
1.8. References ... 62
II
2.1. Declaration of Authorship ... 67
2.2. Abstract ... 68
2.3. Introduction ... 69
2.4. Results and Discussion ... 80
2.4.1. Polymer synthesis and micelle preparation ... 80
2.4.2. Critical micelle concentration (CMC) determination ... 83
2.4.3. Variable temperature light scattering analysis ... 86
2.4.4. Variable temperature turbidimetry and microcalorimetry analysis ... 88
2.4.5. Discussion of micelles with longer pNIPAM coronas ... 94
2.5. Conclusion ... 97
2.6. Experimental Section... 98
2.6.1. Methods and materials ... 98
2.6.2. Polymer synthesis ... 99
2.6.3. Particle analysis ... 101
2.7. References ... 104
3. Probing the causes of thermal hysteresis using tunable Nagg micelles with linear and brush-like thermoresponsive coronas ... 107
3.1. Declaration of Authorship ... 108
3.2. Abstract ... 109
3.3. Introduction ... 110
3.4. Results and Discussion ... 117
3.4.1. Polymer synthesis and micelle preparation ... 117
3.4.2. Multiple angle light scattering analysis. ... 121
3.4.3. Thermoresponsive behavior ... 122
3.5. Conclusion ... 133
3.6. Experimental Section... 134
3.6.1. Methods and materials ... 134
3.6.2. Synthetic procedures ... 136
3.7. References ... 150
4. Comparison of photo- and thermally initiated polymerization-induced self-assembly: a lack of end group fidelity drives the formation of higher order morphologies ... 153
4.1. Declaration of Authorship ... 154
4.2. Abstract ... 155
4.3. Introduction ... 156
4.4. Results and Discussion ... 160
4.4.1. Construction and Comparison of Isothermal Phase Diagrams ... 160
III 4.4.3. The influence of post-synthetic light and heat irradiation on the pre-formed
PISA morphologies. ... 172
4.4.4. Investigation into the equilibrium morphologies formed at 37 °C ... 179
4.5. Conclusion ... 182
4.6. Experimental Section... 183
4.6.1. Methods and materials ... 183
4.6.2. Synthetic procedures ... 185
4.7. References ... 192
5. PISAylation: Confinement of functional and therapeutic proteins in selectively permeable polymersomes ... 194
5.1. Declaration of Authorship ... 195
5.2. Abstract ... 196
5.3. Introduction ... 197
5.4. Results and Discussion ... 206
5.4.1. Polymer synthesis ... 206
5.4.2. Preparation of GFP-loaded vesicles for direct fluorescence imaging... 208
5.4.3. Preparation of catalytic HRP-loaded vesicles ... 211
5.4.4. Preparation of GOx-loaded vesicles and enzymatic cascade activity ... 214
5.4.5. Calculation of loading efficiency ... 218
5.4.6. Preparation of ASNS-loaded vesicles as an alternative to PEGylation ... 222
5.4.7. In vitro efficacy of ASNS-loaded vesicles towards a cancer cell line ... 228
5.5. Conclusion ... 232
5.6. Experimental Section... 233
5.6.1. Methods and materials ... 233
5.6.2. Recombinant GFP expression and purification ... 236
5.6.3. Particle synthesis ... 238
5.6.4. Kinetic colorimetric analyses ... 239
5.6.5. Calculation of protein loadings ... 240
5.6.6. In vitro cell studies ... 241
5.7. References ... 243
6. Conclusions and Outlook ... 245
7. Appendix ... 250
7.1. Technical note ... 250
IV
List of Figures, Schemes and Tables
List of Figures
Figure 1.1. Examples of some common chain architectures. Colored spheres represent different monomers and gold stars or triangles represent different initiators or initiating groups. ... 7 Figure 1.2. Compatibility of the R- and Z-groups with different monomers. The groups are listed in order of decreasing of fragmentation rates (R-groups) or addition rates (Z-groups). A bold line shows good control over both molar mass and dispersity. A dashed line shows partial control or significant retardation. Abbreviations: MMA=methyl methacrylate, HPMAM=2-hydroxypropyl methacrylamide, St=styrene, MA=methyl acrylate, AM=acrylamide, AN=acrylonitrile, VAc=vinyl acetate, NVP=N-vinylpyrrolidone, NVC=N-vinylcarbazole. Adapted from ref.15 ... 12
Figure 1.3. Outline of the species obtained from a homopolymerization and single chain extension by a RAFT polymerization process at full monomer conversion. Taken from ref.8 ... 13 Figure 1.4. LHS: Chemical structures of some common photoinitiators and photocatalysts. RHS: The mechanism of PET-RAFT in the absence (oxidative quenching) and presence (reductive quenching) of a sacrificial electron donor, TEA. Adapted from ref.18 ... 16 Figure 1.5. Illustration of the effect of the packing parameter, p, on the equilibrium morphology based on geometric arguments for diblock copolymers. Taken from ref.32 20 Figure 1.6. Isothermal equilibrium phase diagram for PS-b-PAA nanostructures formed at various SDS concentration and water content at a polymer concentration of 1.0 wt%. The phase regions are separated by solid black lines, the dashed lines are a guide for the eye. Key: S = spheres, R = rods, V = vesicles. Adapted from ref.36 ... 22 Figure 1.7. Illustration of the unimer exchange mechanism between “dynamic” particles to reach an equilibrium state in a given timeframe, and of the particle-particle fusion mechanism. ... 24 Figure 1.8. A: Non-equilibrium trapped structures and B: mixed and hybrid morphologies observed for various PS-b-PAA and poly(styrene)-b-poly(ethylene oxide) (PS-b-PEO) polymers. Adapted from ref.44 ... 25
Figure 1.9. Formation of non-equilibrium non-spherical polymersome structures. A: Morphological transition from a spherical polymersome towards a stomatocyte during dialysis with representative cryo-TEM images. B: TEM images showing the transition from a lyotropic phase towards tubular polymersomes and finally spherical polymersomes with time during thin film rehydration. Adapted from ref.45 and ref.46 .. 27
V Figure 1.11. Chemical structures of some corona-forming and core-forming blocks compatible with PISA in aqueous solution. ... 31 Figure 1.12. Functionalization of PISA-derived nano-objects formed by thermal initiation. A: Surface functionalization of PISA nano-objects with negative MRI contrast agents. B: Core functionalization of PISA nano-objects with fluorescent moieties. Adapted from ref.67 ... 33 Figure 1.13. Structures of some typical PISA initiators and their corresponding initiator mechanisms. Key: TI = thermal initiator, PI = photoinitiator, PC = photocatalyst. Adapted from ref.53 ... 35
Figure 1.14. Top: Mechanism for photoinitiation in the presence of dissolved oxygen using EY as the dye molecule and ascorbic acid as the reducing agent. Bottom: SEC traces and stained TEM images of some formed nano-objects under non-degassed conditions using ultra low volumes. Adapted from ref.24 ... 37
Figure 1.15. Examples of some pH- and CO2-responsive polymers outlined in the main
text. ... 39 Figure 1.17. Structures of some light-responsive polymers with photo-labile side chain moieties that undergo either reversible or irreversible phase transitions. In each case the aqueous solubility is indicated. ... 41 Figure 1.18. Structures of some multi-stimuli responsive polymers prepared by Thayumanuvan and co-workers. Adapted from ref.104 ... 43 Figure 1.19. A: Structure of the PEO-b-PAGMA hydrogen sulfide-responsive block copolymer used by Yan et al. and the H2S-triggered cascade elimination reaction. B:
Schematic of the self-assembly into polymersomes and disruption in the presence of H2S.
Taken from ref.111... 44
Figure 1.20. Illustration of the relationship between the scattering wave vector and the incident and scattered wave vector. Taken from ref.116 ... 47 Figure 1.21. Illustration of how q affects the window of observation in a sample of polymer coils in solution. Larger q values probe a higher magnification (smaller features) of the sample. Taken from ref.116 ... 47 Figure 1.22. A: Example of an intensity autocorrelation function obtained from polymer 8 from Chapter 3 at an angle of 80°. B: The distribution of relaxation times obtained from fitting the autocorrelation function shown in A using the REPES algorithm. ... 49 Figure 1.23. Plot of τ-1 vs. q2 for polymer 8 in Chapter 3 at a concentration of 1 mg·mL -1 to determine the apparent diffusion coefficient, D. The error bars represent 10% error.
... 50 Figure 1.24. Partial Zimm plot of polymer 8 at a concentration of 1 mg·mL-1 in Chapter 3. The reciprocal of the Mw, particle is shown. The error bars represent 10% error. ... 53
Figure 1.25. Relationship between the intensity-weighted size distribution obtained from fitting the autocorrelation function of an equal mixture of two spheres of sizes one order of magnitude apart and the corresponding physical volume-weighted and number-weighted distributions. Taken from ref.118 ... 54 Figure 1.26. Dry state TEM images of PEG113-HPMA300 formed by PISA at 10 wt%
VI region with a greater coverage of the uranyl acetate stain, resulting in negative staining. ... 57 Figure 1.27. Cryo-TEM images of some common contaminants. A: Empty vitreous ice. B: Hexagonally packed ice. C: Large ice crystals (white arrow). D: Probable ethane contamination (white arrows). The scale bars represent 200 nm. Taken from ref.122 ... 59
Figure 2.1. Hypothetical phase diagram for a polymer system in solution that exhibits both LCST and UCST behavior. Blue chains represent solvated chains and red, collapsed chains represent solvophobic, collapsed chains that precipitate and macroscopically phase separate from the surrounding solvent. The coexistence (solid lines) and spinodal (dashed lines) curves are shown. φ = composition. ... 69 Figure 2.2. Chemical structures of some typical homopolymers derived from vinylic monomers that exhibit either LCST or UCST-type behavior.1 ... 70 Figure 2.3. Left: Post-polymerization route to thermoresponsive homo-, co- and terpolymers from a common pVDMA precursor polymer scaffold. Abbreviations of the monomers shown in blue, green and red are shown along with their role on the overall phase behavior. Right: Turbidimetry data showing UCST (A), LCST (B) and both LCST and UCST (C) behavior. Arrows indicate the solubility of the polymer at a given point along the turbidimetry curve. Adapted from ref.41 ... 71
Figure 2.4. End group modification of thermoresponsive polymers to produce dual-responsive polymers. A: Chemical structure of catechol-functionalized pNIPAM (top) and soluble-to-insoluble transition induced by either increasing the temperature or the addition of Fe3+ (bottom). Adapted from ref.44 B: Chemical structure of azobenzene-functionalized pOEGMA (top) and illustration of how the soluble-to-insoluble transition induced by increasing the temperature could be reversed by either cooling, or 365 nm light irradiation to undergo the trans-to-cis isomerization of the end group (bottom). Adapted from ref.45 ... 73 Figure 2.5. Triple fluorescent overlaid confocal microscopy images of fluorescently labelled p(NIPAM-co-DMA)-b-pLA) micelles (green channel) incubated with bovine epithelial cells with selectively stained nuclei (blue channel) and either lysosomes (A and B, red channel) or golgi apparatus and ER (C and D, red channel). Incubation at 37 °C (A and C) and 42 °C (B and D) are shown. Areas where green and red overlap are indicated in yellow. Taken from ref.21 ... 75 Figure 2.6. Turbidimetry analysis showing the thermal transition of pNIPAM in aqueous solution. The polymer’s solubility in different temperature regimes is shown, along with the hysteresis. Adapted from ref.49 ... 76 Figure 2.7. Left: Chemical structure of doubly pH-responsive p(DMAEMA-co-DEAEMA)-b-DMAEMA used in the study by O’Reilly and co-workers. Right: Increasing Nagg with decreasing α for a series of block copolymers with increasing
DEAEMA incorporation, denoted here as 1-4. Adapted from ref.62 ... 79 Figure 2.8. 1H NMR spectrum of mCTA1, analyzed at 400 MHz in CDCl3. ... 81
Figure 2.9. SEC RI chromatograms of mCTA1 using 5 mM NH4BF4 in DMF as the
eluent and calibrated against poly(methyl methacrylate) standards. ... 81 Figure 2.10. SEC RI chromatograms of mCTA1 and polymer 1 using 5 mM NH4BF4 in
VII Figure 2.12. Fluorescence emission spectra of polymer 2 at 0.2 μM PNA dye concentration at varying polymer concentrations. The excitation wavelength was 340 nm.
Imicelle and Iwater are shown with dashed arrows illustrating the decrease or increase in
intensity with decreasing polymer concentration. ... 84 Figure 2.13. Plot of Imicelle/Iwater against log[polymer] for micelles comprised of polymer
1 (black squares), 2 (red circles), 3 (blue triangles), 4 (pink triangles) and 5 (green diamonds) using 0.2 μM PNA dye. The data in each series was normalized to the maximum intensity of the highest polymer concentration in that series. ... 85 Figure 2.14. Multiple-angle light scattering analysis of micelles 1-5 in water. A. Autocorrelation function of polymer 2 at 20 °C analyzed at an angle of 150°. The inset shows the y-axis as a log scale. B. Plot of the τ-1 values obtained by DLS analysis against
q2 for polymer 2 at 20 °C with 10 % error bars. C. Partial Zimm plot of polymer 2 at 20 °C with 10% error bars obtained using SLS analysis. D. Plot of Nagg with varying nBA
units in the micellar core determined by SLS analysis for the micellar series 1-5 at 20 °C with 10% error bars. ... 86 Figure 2.15. Left: Variation of RH of micelles composed of polymers 1 (black squares),
2 (red circles), 3 (blue triangles) and 4 (pink triangles) with temperature as determined by DLS analysis. Inset: Variation of RH (filled circles) and Rg (empty circles) of a
pNIPAM-stabilized dendritic core particle as determined by DLS and SLS, taken from ref.69 Two
clear transitions were observed in the referenced work. Right: Variation of Rcore of
micelles composed of polymers 1 (black squares), 2 (red circles), 3 (blue triangles) and 4 (pink triangles) with temperature as determined by SLS analysis. Error bars represent 10% error in Rcore. ... 88
Figure 2.16. Thermal analysis of micelles comprised of polymer 1. Heating traces from the turbidimetry (A) and microcalorimetry (B) analysis are shown along with the cloud point from turbidimetry and Tp from microcalorimetry. The inset images show digital
photographs of the micelles before and after heating above the transition temperature. Both were performed at 1 mg·mL-1 with a temperature ramp of 1 °C·min-1. ... 89
Figure 2.17. A: Temperature of phase transitions measured by variable temperature techniques at 1 mg·mL-1 with 10% error bars. Black squares represent cloud points determined by turbidimetry. Red circles represent Tp values determined by
microcalorimetry. B: Degree of hysteresis observed by turbidimetry analysis. Error bars represent the standard deviation over 3 repeats. C: Heating (solid) and cooling (dashed) turbidimetry traces at 1 mg·mL-1 for micelles comprised of polymer 1 D: Heating (solid) and cooling (dashed) turbidimetry traces at 1 mg·mL-1 for micelles comprised of polymer 5. In all experiments, the heating and cooling rate was 1 °C·min-1. ... 90 Figure 2.18. A. Turbidity of micelles comprised of polymer 5 with time at 30 °C after being heated to 40 °C. Error bars represent the standard deviation over 3 repeats. B. Schematic representation of higher chain density in high Nagg micelles leading to higher
interchain entanglement in the globular state, above the transition temperature. C. Schematic representation of increased water exclusion in highly hydrophobic micelles above the transition temperature, compared to less hydrophobic cores, which exhibit more hydrated precipitates. ... 91 Figure 2.19. Plot of η0 against polymer concentration. η0 values were calculated from the
VIII using η0 = (η - ηs)/ ηs. Error bars represent the standard deviation across the shear rates.
In each case the error bars are smaller than the data point marker. ... 93 Figure 2.20. A. Triple detection SEC of mCTA1a using 5 mM NH4BF4 in DMF as the
eluent. B. SEC RI traces of mCTA1a (solid line) and polymer 5a (dashed line) using 2% triethylamine in chloroform as the eluent and calibrated against poly(styrene) standards. C. Quantitative 13C NMR spectrum of polymer 5a with the integrals set relative to carbon environment e. ... 95 Figure 2.21. Turbidimetry analysis of mCTA1a (A) and polymers 5a (B) and 5 (C) at 1 mg mL-1. In each case the heating (solid lines) and cooling traces (dashed lines) are shown
and the polymer composition has been included for comparison. ... 96 Figure 2.22. 1H NMR spectra of micelles comprised of polymer 4 (top) and polymer 1 (bottom) obtained at 500 MHz in D2O. Proton signals from the side chains have been
indicated in each case. ... 96 Figure 3.1. Chemical structures of various LCST-type polymers discussed, which show poor reversibility. pMPA, a polymer that shows good reversibility, has been included for comparison purposes. ... 113 Figure 3.2. Illustration of the thermoresponsive diblock copolymers used in this study. Key: x = mol% nBA in the core-forming block. Below is a table outlining the differences in the corona blocks’ properties. ... 115 Figure 3.3. A: Schematic of one series of diblock copolymers with identical corona-forming blocks and tunable p(nBA-co-DMA) core compositions that self-assemble in water to yield micelles with a tunable Nagg. The resulting particles show identical cloud
points but different thermal hysteresis when heated in solution. B: Design of four micellar series with different corona-forming blocks with distinct chemistry and architecture, but whose cores contain the same p(nBA-co-DMA) compositions. In each case, the chemical structure of the corona block is shown. C: Studying the thermoresponsive behaviors of the four micellar series gives information on the structure-property relationships regarding thermal hysteresis in thermoresponsive self-assemblies. ... 116 Figure 3.4. SEC RI chromatograms of diblock copolymers with pNIPAM coronas (A), pDEAm coronas (B), pDEGMA coronas (C) and pOEGMA coronas (D) alongside their corresponding mCTAs. For mCTA1 and polymer 1 (panel A), 5 mM NH4BF4 in DMF
was used as the eluent. For all other experiments, 2% TEA in THF was used as the eluent. In each case, the distributions were calculated using the RI traces calibrated against poly(methyl methacrylate) standards. ... 119 Figure 3.5. 1H NMR spectra of mCTA2 (top) and polymer 8 (middle). The bottom spectrum is that of mCTA2 subtracted from that of polymer 8 used to calculate the core composition; the peaks at 4.00 and 3.22 - 2.77 ppm corresponding to pnBA and pDMA, respectively, are clearly resolved. ... 120 Figure 3.6. Representative multiple angle dynamic (above) and static (below) light scattering data of micelles comprised of polymers 10 (A), 15 (B) and 17 (C), each at 1 mg·mL-1. Error bars represent 10% error. ... 121 Figure 3.7. Variation in the particles’ Nagg with the molar fraction of hydrophobic nBA
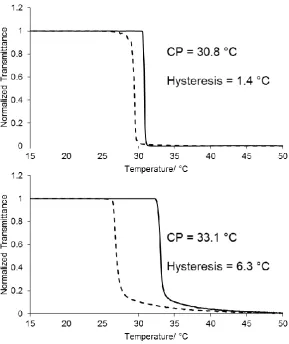
IX (polymers 11-15, purple squares) and pOEGMA coronas (polymers 16-17, cyan squares) are shown. Error bars represent 10% error... 122 Figure 3.8. A: Variation of the cloud point transition temperatures of polymers 1-5 (orange circles), 6-10 (blue triangles) and 11-15 (purple squares) with the molar fraction of hydrophobic nBA in the core-forming block, as determined by turbidimetry. Error bars represent 10% error. B: Variation of thermal hysteresis of micelles comprised of pDEAm coronas, which cannot form hydrogen bonds between polymer chains (polymers 1-5, orange bars), and pNIPAM coronas, which can (polymers 6-10, blue bars). Values determined by turbidimetry and plotted as a function of mol% nBA in the core-forming block. Error bars represent the standard deviation across 3 repeats. ... 123 Figure 3.9. Variable temperature turbidimetry analysis of micelles comprised of polymers 1 (A), 5 (B), 6 (C) and 10 (D) at 1 mg·mL-1 with a heating and cooling rate of 1 °C·min-1. In each case, the solid trace represents the heating cycle and the dashed trace
represents the cooling cycle. ... 124 Figure 3.10. Turbidimetry analyses of micelles with pDEGMA coronas. Turbidimetry curves for polymers 11 (red) and 15 (black) are shown. In each case, solid lines represent heating cycles and dashed lines represent cooling cycles. The insets show photographs of solutions before heating (A) and after heating followed by storage at 4 °C for 13 months (B). ... 127 Figure 3.11. Chain density of micelles comprised of polymers 11-15. Error bars represent 10% error. The two distinct regimes of reversible and irreversible phase transitions are marked with dashed lines. Note that polymer 14 (88% nBA in the core forming block) shows the highest chain density because its RH is smaller than that of polymer 15 (100%
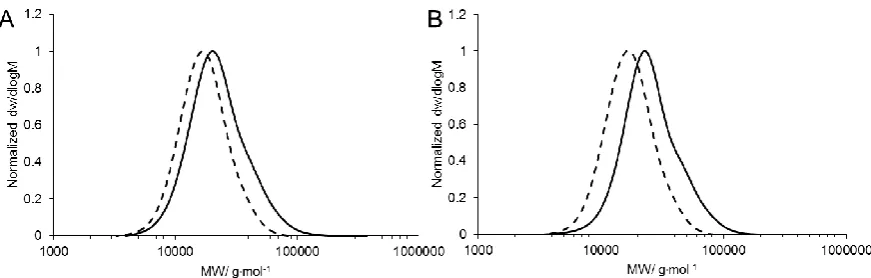
nBA in the core forming block). ... 128 Figure 3.12. Turbidimetry analyses of micelles with pOEGMA coronas. Turbidimetry curves for polymers 16 (red) and 17 (black) are shown. In each case, solid lines represent heating cycles and dashed lines represent cooling cycles. For clarity, some instances of macroscopic precipitation and sedimentation have been labelled and the cooling curve for polymer 17 has been smoothed. ... 129 Figure 3.13. A: SEC RI chromatograms of polymer 17 before (black dashed line) and after (red solid line) three heating and cooling cycles from 50 - 95 °C. 2% TEA in THF was used as the eluent and the instrument was calibrated against PMMA standards. In each case, the distributions were calculated using the RI traces. B: Variable temperature turbidimetry analysis of micelles comprised of polymer 17 at 1 mg·mL-1 heated from 50 - 70 °C so as to reduce the thermal annealing time. In each case, the solid trace represents the heating cycle and the dashed trace represents the cooling cycle. The 1st cycle (black traces), 2nd cycle (red traces) and 3rd cycle (blue traces) are shown. ... 130
Figure 3.14. 1H (top) and 13C DEPT (bottom) NMR spectra of DEAm, analyzed at 400
and 100 MHz respectively, in CDCl3. ... 137
Figure 3.15. 1H (top) and 13C DEPT (bottom) NMR spectra of 2-Cyano-2-propyl dodecyl trithiocarbonate analyzed at 400 and 100 MHz respectively, in CDCl3. ... 140
Figure 3.16. 1H (above) and 13C DEPT (below) NMR spectra of 4-cyano-4-(((ethylthio)
carbonothioyl)thio) pentanoic acid, analyzed at 400 and 100 MHz respectively, in CDCl3.
X Figure 3.17. 1H (above) and 13C DEPT (below) NMR spectra of methyl 4-cyano-4-(((ethylthio) carbonothioyl)thio) pentanoate, analyzed at 300 and 75 MHz respectively, in CDCl3. ... 144
Figure 3.18. 1H NMR spectrum of mCTA2, analyzed at 400 MHz in CDCl
3. ... 145
Figure 3.19. 1H NMR spectrum of mCTA3, analyzed at 400 MHz in CDCl
3. ... 146
Figure 3.20. 1H NMR spectrum of mCTA4, analyzed at 400 MHz in CDCl3. ... 147
Figure 4.1. Chemical structure and representative 1H NMR spectra of PEG113-PHPMAx
diblock copolymers formed at 10 wt% HPMA by route B analyzed at 300 MHz in CD3OD. The spectral intensities were normalized to the PEG mCTA at 3.63 ppm (signal
“b”) and their baselines off-set for clarity. ... 160 Figure 4.2. Representative RI SEC traces for PEG113-b-PHPMAx diblock copolymers
formed at 10 wt% HPMA using 5 mM NH4BF4 in DMF as the eluent. Data for route A
(I) and route B (II) are shown along with the Ɖ values. Key: In each case, PEG113 (black
trace), PEG113-b-PHPMA100 (red trace), PEG113-b-PHPMA200 (green trace), PEG113
-b-PHPMA300 (magenta trace) and PEG113-b-PHPMA400 (blue trace) are shown. Panel III
shows the calculated Mn values for route A (red circles) and route B (black squares)
derived diblock copolymers shown in panels I and II, using PMMA standards. Error bars represent 10% error. The black linear trend shows the theoretical Mn values. Panel IV
shows SEC data from the kinetic study of PEG113-b-PHPMA300 formed by routes A (red)
and B (black). Left axis: Mn values of polymers formed by route A (red circles) and route
B (black squares), the black linear trend shows the theoretical Mn values. Right axis: Ɖ
values of polymers formed by route A (red diamonds) and route B (black diamonds). ... 162 Figure 4.3. UV-Vis spectrum of PP-OH (black) with the wavelength range of the light source indicated with a purple box. Below are examples of PEG113-b-PHPMA400
formulations at 10 wt% formed by route A either in the presence or absence of the photoinitiator. ... 162 Figure 4.4. Kinetic plots of formulations formed by routes A (red circles) and B (black squares). In each case an inflection point has been indicated by the intercept of the two gradients, which shows the onset of particle aggregation. ... 163 Figure 4.5. Phase diagrams of PISA formulations synthesized by routes A (I) and B (II) with accompanying stained TEM images. Scale bars represent 0.5 μm, except where marked with an asterisk, in which case the scale bar represents 0.2 μm. Key: S = spheres, W = worms, L = lamellae, ULV = unilamellar vesicles, MLV = multilamellar vesicles. Formulations highlighted with red boxes will be discussed further in this section. ... 164 Figure 4.6. Photograph of PEG113-b-PHPMA100 formulations formed by thermally
initiated PISA (route B). From left to right: 10 wt% HPMA, 15 wt% HPMA, 20 wt% HPMA and 25 wt% HPMA. ... 165 Figure 4.8. Stained TEM images of the PEG113-PHPMAx copolymers, where x is denoted
in each image, formed by thermally initiated PISA at 10 wt% HPMA. The scale bars represent 500 nm. ... 166 Figure 4.9. Histograms of PEG113-b-PHPMA400 diblock copolymer unilamellar vesicles
XI Figure 4.10. A: Kinetic study of the PEG113-b-PHPMA300 formulation at 10 wt% formed
by route C (blue triangles) overlaid with the kinetic data previously obtained for that formed by route B (black squares). B: SEC data for the kinetic studies. Left axis: Mn
values of polymers formed by route C (blue triangles) and route B (black squares), the black linear trend shows the theoretical Mn values. Right axis: Ɖ values of polymers
formed by route C (blue triangles) and route B (black diamonds). ... 169 Figure 4.11. Representative TEM images showing no morphology change in formulations formed by route C (photoinitiation 20% light intensity at 37 °C) post-synthetically treated with route F (irradiation with 20% light intensity at 37 °C for 18 h). PEG113-b-PHPMA300 at 10 wt% HPMA (top) and PEG113-b-PHPMA200 at 15 wt% HPMA
(bottom) are shown. Scale bar = 500 nm. ... 170 Figure 4.12. Stained TEM images of particles from various formulations formed from route C (bottom row), shown in comparison to identical formulations formed from routes A (top row) and B (middle row). The scale bars each represent 500 nm. ... 171 Figure 4.13. Post-synthetic heat and light irradiation experiments. Stained TEM images of PEG113-b-PHPMA300 formulations obtained at [HPMA] = 10 wt% by route A (I) or
route B (II), treated by route D (LHS) or route E (RHS). The scale bars represent 500 nm. III: DLS analysis (top) and photographs (bottom) of formulations formed by route A and routes A+D. Key: Route A – photoinitiated PISA at 100% light intensity at 37 °C. Route B – thermal initiation at 37 °C. Route D – photoirradiation at 100% light intensity at 37 °C for 18 h. Route E – incubation at 37 °C for 18 h. ... 173 Figure 4.14. SEC traces of PEG113-b-PHPMA300 at [HPMA] = 10 wt% formed by various
synthetic and post-synthetic routes. I: Normalized RI traces of formulations formed by routes A, A+D and A+E. II: Normalized 309 nm traces of formulations formed by routes A, B and A+D. III: Normalized 309 nm traces of formulations formed by routes A and A+E. IV: Normalized 309 nm traces of formulations formed by routes C and C+F. Routes C and C+F are analogous experiments to A and A+D but at the lower light intensity irradiation. In each of the UV traces shown in II, III and IV the traces were normalized relative to the formulation formed by route B. The end group fidelity relative to route B is shown, along with the observed morphology determined by TEM. ... 175 Figure 4.15. Normalized SEC UV traces of PEG113-b-PHPMA400 formed at 10 wt%
HPMA by route A (black) compared with those further irradiated with 100% light intensity for 18 h at 37 °C (route A+D) either with (green) or without (red) degassing the solution prior to irradiation. ... 176 Figure 4.16. MALDI-ToF MS analysis of PHPMA oligomers before (black) and after (blue) irradiation with heat and light at 100% light intensity for 18 h. ... 177 Figure 4.18. Representative stained TEM images showing morphology change of PEG113-b-PHPMA300 at 20 wt% obtained by route A and route A+D. Key: Route A =
100% light intensity photoinitiation at 37 °C. Route D = 100% light intensity photoirradiation at 37 °C for 18 h. ... 178 Figure 4.17. 1H NMR spectroscopic analysis of PHPMA oligomers at 400 MHz in acetone-d6 before (bottom) and after (top) irradiation with heat and light at 100% light
XII Figure 4.19. Stained TEM images of equilibrium structures of diblock copolymers formed at 37 °C and 1 mg·mL-1. The block ratio for each sample is indicated above the corresponding TEM image. The unlabeled scale bars = 200 nm. ... 179 Figure 4.20. Representative TEM images of the new equilibrium structure at 1 mg·mL-1
of PEG113-b-PHPMA300 obtained by route A+D at 10 wt%. ... 180
Figure 4.21. 1H NMR spectrum of the PEG113 mCTA, analyzed at 300 MHz in CDCl3.
... 186 Figure 4.22. 1H NMR spectrum of PHPMA oligomers analyzed at 300 MHz in
(CD3)2CO. ... 191
Figure 5.1. Various features of biomimetic self-assemblies. A: A multi-compartmentalized polymersome-in-polymersome system consisting of enzyme-loaded PS-b-PIAT polymersomes encapsulated within a larger PB-b-PEO polymersome. Taken from ref.6 B: Time-resolved confocal microscopic analysis showing glycosylated giant
polymersomes (red) binding with a cluster of ConA-functional PS beads (green). Taken from ref.5 C: Enzyme-loaded PEO-b-PS stomatocytes catalyze the production of gases to achieve directional autonomous propulsion. Taken from ref.7 D: Fatty acid liposomes allow the transport of external activated nucleotides into the lumen, which in turn results in template copying. Addition of externally applied amphiphiles results in insertion into the membrane and subsequent formation of daughter protocells. Taken from ref.8 ... 198
Figure 5.2. Outline of some methods for achieving polymersome permeability found in the literature. A: PS-b-PIAT polymersomes with intrinsic permeability towards small molecules. Taken from ref.10 B: Post-synthetic chemical modification of PMOXA-b-PDMS-b-PMOXA vesicle membranes using a photoinitiator. Taken from ref.11 C:
Incorporation of OmpF into PMOXA-b-PDMS-b-PMOXA vesicles to afford size-selective permeability. Adapted from ref.12 D: PNIPAM-b-PNBOCA vesicles show an irreversible enhancement in permeability in response to UV light irradiation. Adapted from ref.13 ... 199 Figure 5.3. Illustration of the artificial peroxisomes developed by Palivan and co-workers. A: A cell with its organelles. B: A natural peroxisome is a spherical liposome containing enzymes to break down ROS. C: Structure of the artificial peroxisome with enzymes in the lumen and OmpF in the membrane. D: Schematic of the enzymatic cascade reaction facilitated by the artificial peroxisomes. Taken from ref.20 ... 201 Figure 5.4. SEC RI traces of the PEG113 mCTA (gray dashed line) and the PEG113
-b-PHPMA400 diblock copolymers (solid lines) comprising the protein-loaded vesicles used
in this study. Empty vesicles (black trace), GFP-loaded vesicles (green trace), ASNS-loaded vesicles (purple trace), HRP-ASNS-loaded vesicles (red trace) and GOx-ASNS-loaded vesicles (blue trace) are shown, along with their calculated Mn and Ð values. 5 mM NH4BF4 in
XIII diameter (DH) and polydispersity (PD) are shown. The error represents the standard
deviation from 5 repeat measurements. ... 207 Figure 5.6. Characterization of GFP-loaded vesicles after purification. DLS autocorrelation function (A) and distribution (B) of GFP-loaded vesicles in pH 5.5 phosphate buffer. The DH and PD are shown. The error represents the standard deviation
from 5 repeat measurements. Representative dry state TEM images of samples stained with 1 wt% uranyl acetate (C and D). Representative cryo-TEM image of GFP-loaded vesicles in pH 5.5 phosphate buffer (E) and distribution of membrane thicknesses measured from statistical analysis (F). The error shows the standard deviation from 200 particle membranes. ... 209 Figure 5.7. A: Fluorescence spectra of the 1st supernatant (red traces) and an identical concentration of the untreated protein (black traces). Insert: Photograph of the crude GFP-loaded vesicle solution immediately after the PISA reaction under a UV lamp. B: Fluorescence spectra of the 1st supernatant (black traces), disassembled vesicle solution
(red traces) and 2nd supernatant (gray traces) in a 5:1 methanol:water solvent mixture. In each case the excitation spectra (λEm = 512 nm, dashed traces) and the emission spectra
(λEx = 495 nm, solid traces) are shown. ... 210
Figure 5.8. Fluorescence micrographs of free GFP (A), empty vesicles (B), empty vesicles purified from an identical GFP solution after light irradiation (C) and GFP-loaded vesicles (D). The scale bars represent 5 μm. ... 211 Figure 5.9. Characterization of HRP-loaded vesicles after centrifugation/resuspension and preparative SEC. Column A: Representative dry state TEM images of samples stained with 1 wt% uranyl acetate. Column B: Representative cryo-TEM image of HRP-loaded vesicles in pH 5.5 phosphate buffer (top) and distribution of membrane thicknesses measured from statistical analysis (bottom). The error shows the standard deviation from 200 particle membranes. Column C: DLS analysis of HRP-loaded vesicles in pH 5.5 phosphate buffer. The DH and PD are shown. The error represents the standard
deviation from 5 repeat measurements. ... 212 Figure 5.10. Enzymatic activity of loaded vesicles. A: Schematic showing the HRP-catalyzed oxidation of DMB to its colored dimer product detected in the colorimetric assay. B: Activity of the HRP-loaded vesicles, empty vesicles and the empty vesicles purified from an identical HRP solution after 70 min light irradiation, measured by a change in absorbance at 492 nm. Reaction conditions: [Vesicles] = 3.3 mg·mL-1, [H
2O2]
= 3.5 % w/w, [DMB] = 0.4 mM in 80 mM pH 5.5 phosphate buffer. The error represents the standard deviation from 4 repeats. ... 213 Figure 5.11. Normalized preparative SEC RI traces of HRP-loaded vesicles (black trace) and that of the free HRP enzyme (red trace) in 100 mM pH 5.5 phosphate buffer. In each case, the injection volume was 1 mL. ... 214 Figure 5.12. Characterization of GOx-loaded vesicles after centrifugation/resuspension and preparative SEC. A and B: DLS analysis of GOx-loaded vesicles in pH 5.5 phosphate buffer. The DH and PD are shown. The error represents the standard deviation from 5
cryo-XIV TEM image in pH 5.5 phosphate buffer of vesicles loaded with GOx previously purified by dialysis, and distribution of membrane thicknesses measured from statistical analysis. In each case, the error shows the standard deviation from 200 particle membranes. ... 215 Figure 5.13. Enzymatic activity of loaded vesicles. A: Schematic showing the GOx-catalyzed oxidation of D-glucose to δ-glucono-1,5-lactone and hydrogen peroxide. Excess HRP in solution was then used to catalyze the oxidation of DMB using the rate-limiting reagent hydrogen peroxide product from the first step. B: Activity of the GOx-loaded vesicles, empty vesicles, and empty vesicles purified from GOx after 70 min light irradiation (empty circles), measured by a change in absorbance at 492 nm. Reaction conditions: [Vesicles] = 3.3 mg·mL-1, [D-glucose] = 17 mM, [free HRP] = 20 U·mL-1, [DMB] = 0.4 mM in 70 mM pH 5.5 phosphate buffer. The error represents the standard deviation from 4 repeats. ... 216 Figure 5.14. Enzymatic activity of the HRP- and GOx-loaded vesicle cascade reaction. A: Schematic showing the HRP- and GOx-loaded vesicle cascade reaction using D-glucose as an initiating species resulting in production of the colored dimer after two steps. B: Activity of the HRP- and GOx-loaded vesicle cascade with all components present (orange circles), measured as an increase in absorbance at 492 nm. Negative control experiments with GOx-loaded vesicles alone (blue circles), HRP-loaded vesicles alone (red circles), or both vesicles with DMB but without D-glucose (gray circles) show no activity. Insets show end point photographs of the plate wells after 1.5 h. Reaction conditions (when all components present): [HRP vesicles] = 1.9 mg·mL-1, [GOx vesicles] = 1.9 mg·mL-1, [D-glucose] = 17 mM, [DMB] = 0.4 mM in 80 mM pH 5.5 phosphate buffer. The error represents the standard deviation from 4 repeats. ... 217 Figure 5.15. Example data from BCA (A) and HPLC (B) analysis of the destroyed vesicles. A: A dilution series of known HRP concentrations in 5% SDS/ pH 5.5 phosphate buffer (black squares) was compared to the destroyed vesicles in 5% SDS/ pH 5.5 phosphate buffer (red circle). The data was not blank corrected. B: HPLC analysis of HRP at known concentrations. ... 218 Figure 5.16. Western blot analysis of disassembled GOx-loaded vesicles. A: Image of the developed blot. B: Obtained calibration curve of the dilution series. ... 219 Figure 5.17. Comparison of the enzyme-loaded vesicles to the free enzymes. Activity data for HRP (A), GOx (B) and the HRP and GOx cascade (C) are shown. Panel D shows the residual activities calculated by comparing the slopes. The error bars represent the standard deviation from 4 repeats. ... 221 Figure 5.18. Characterization of ASNS-loaded vesicles after purification. Column A: Representative dry state TEM images of samples stained with 1 wt% uranyl acetate. Column B: Representative cryo-TEM image of ASNS-loaded vesicles in pH 5.5 phosphate buffer (top) and distribution of membrane thicknesses measured from statistical analysis (bottom). The error shows the standard deviation from 200 particle membranes. Column C: DLS analysis of ASNS-loaded vesicles in pH 5.5 phosphate buffer. The DH and PD are shown. The error represents the standard deviation from 5
L-XV asparaginase, the supply of L-asparagine to healthy cells is achieved through biosynthesis inside the cell. B: Leukemia cells with low L-asparagine synthetase expression levels predominantly rely on circulating L-asparagine in the blood serum. In the presence of external L-asparaginase, the supply of L-asparagine to these cells is limited, thereby resulting in decreased proliferation. ... 224 Figure 5.20. A: Activity of the ASNS-loaded vesicles. The error bars represent the standard deviation across 4 repeats. B: Photographs of the end point wells of the first 6 supernatants, the empty vesicles purified from an ASNS solution after 70 min light irradiation, and the ASNS-loaded vesicles. C: Comparison of the free enzyme activity against the encapsulated enzyme. D: Comparison of the untreated ASNS activity to that of the first supernatant. Reaction conditions for vesicle solutions and free enzymes: [analyte mixture] = 85% v/v, [Nessler’s reagent] = 15% v/v. Reaction conditions for discarded supernatants shown in panel B: [analyte mixture] = 10% v/v, [Nessler’s reagent] = 15% v/v in deionized water. See experimental section for more details. .... 225 Figure 5.21. Proteolytic stability of ASNS-loaded vesicles. A: Activity of the α-CT-treated species (patterned bars) normalized to the activity of the unα-CT-treated species (solid bars) after 18 h incubation for the ASNS-loaded vesicles, free ASNS and the PEGylated conjugate. B: Normalized activity after a 7 day incubation period. The error bars represent the standard deviation from 4 repeated measurements. C: Dry state TEM image of the ASNS-loaded vesicles after 7 days incubation with α-CT. The sample was stained with 1 wt% uranyl acetate. ... 226 Figure 5.22. Stability of the ASNS-loaded vesicles in human blood plasma. A and B: DLS size distribution and autocorrelation function after 4 days in blood plasma. The z-average DH and PD are shown, with the error representing the standard deviation from 5
repeated measurements. Key: Intensity = red, volume = green, number = black. C: Stained TEM image of the ASNS-loaded vesicles after 4 days in blood plasma. ... 227
Figure 5.23. Preparation of gene silenced A549 cells as a model for lymphobastic leukemia cells. A: Western blot analysis of lyzed cultures of A549 cells, either untreated or treated with various siRNA (top). The pixel densiometry plots (bottom) are shown along with their average peak intensities. The error represents the standard deviation across 3 repeat (A549) or 2 repeat (siRNA groups) measurements. B: Proliferation in normal medium for A549 cells incubated with various siRNA. The error represents the standard deviation across at least 3 repeat experiments (control A549 cells, n = 6). Key: * p ≤ 0.05, ** p ≤ 0.01. ... 228
Figure 5.24. Schematic of the cell proliferation assay employed. After incubating the growth medium with either ASNS-loaded vesicles or empty vesicles, the polymer was removed by centrifugation and the treated growth media in the supernatants were used to replace the normal growth medium in the L-asparagine synthetase gene silenced A549 cells. The metabolic activity of the cells was assessed after a proliferation period. ... 229 Figure 5.25. Metabolic activity over time for gene silenced A549 cells treated with normal medium (black squares), or media exposed to the empty vesicles (11 mg·mL-1, cyan diamonds), PEG-ASNS (0.18 U·mL-1, red circles), native ASNS (0.18 U·mL-1,
green diamonds), and ASNS-loaded vesicles (11 mg·mL-1 polymer, 0.18 U·mL-1 protein,
XVI Figure 5.26. Western blot analysis of E. coli cells and GFP elutions from a Nickel-sepharose column. Purified GFP is observed in the RHS lane and non-purified GFP in the center lane. The numbers on the left represent the molar mass in kilodaltons, relative to Precision Plus ProteinTM Standards (LHS lane). ... 237
Figure 7.1. Turbidimetry curves of polymer 9 at 1 mg·mL-1 at a programmed heating and
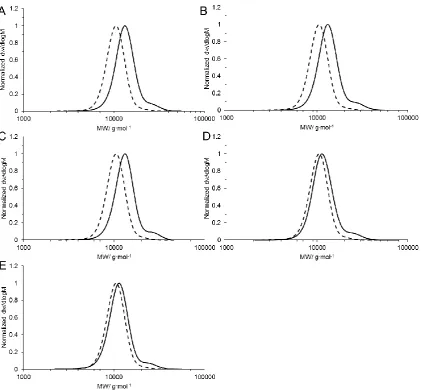
cooling rate of 1 °C·min-1 measured on a Perkin Elmer Lambda 6 instrument (top) and an Agilent Cary 60 instrument (bottom). ... 251 Figure 7.2. SEC RI traces for the pNIPAM block copolymers in Chapter 2. mCTA1 (dashed lines in each case) and polymers 1 (A), 2 (B), 3 (C), 4 (D) and 5 (E) are shown. 5 mM NH4BF4 in DMF was used as the eluent in each case and the molar mass
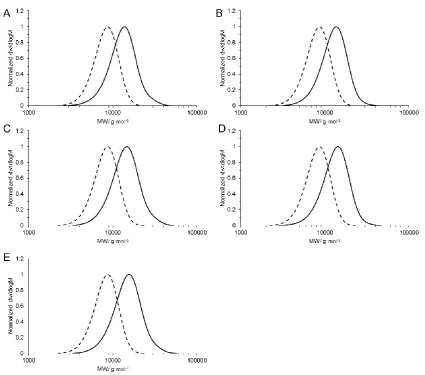
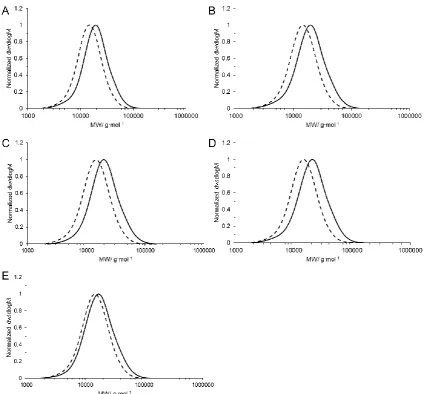
distributions were calculated against poly(methyl methacrylate) standards. ... 252 Figure 7.3. SEC RI traces for the pDEAm block copolymers in Chapter 3. mCTA2 (dashed lines in each case) and polymers 6 (A), 7 (B), 8 (C), 9 (D) and 10 (E) are shown. 2% TEA in THF was used as the eluent in each case and the molar mass distributions were calculated against poly(methyl methacrylate) standards. ... 253 Figure 7.4. SEC RI traces for the pDEGMA block copolymers in Chapter 3. mCTA3 (dashed lines in each case) and polymers 11 (A), 12 (B), 13 (C), 14 (D), and 15 (E) are shown. 2% TEA in THF was used as the eluent in each case and the molar mass distributions were calculated against poly(methyl methacrylate) standards. ... 254 Figure 7.5. SEC RI traces for the pOEGMA block copolymers in Chapter 3. mCTA4 (dashed lines in each case) and polymers 16 (A) and 17 (B) are shown. 2% TEA in THF was used as the eluent in each case and the molar mass distributions were calculated against poly(methyl methacrylate) standards. ... 255
List of Schemes
Scheme 1.1. Outline of the free radical polymerization of styrene to yield poly(styrene) using a thermally activated radical initiator, AIBN, as the radical source. ... 6 Scheme 1.2. Generic mechanism for ATRP using a metal-ligand complex (ML) and an alkyl halide initiator. Pn represents the polymer chain. The rate constants in the main
XVII Scheme 3.1. Synthesis of the four corona-forming macroCTA blocks (mCTA1-4) and their subsequent chain extension to yield the amphiphilic diblock copolymers (1-17). ... 117 Scheme 4.1. Outline of the synthetic and post-synthetic routes employed in this work. Isothermal photoinitiated PISA at 100% light intensity (route A), thermally initiated PISA (route B) and photoinitiated PISA at 20% light intensity (route C) lead to PEG-b-PHPMA nano-objects. Additionally, irradiation of the pre-formed nano-objects formed by either of routes A, B or C, with 100% light intensity (route D), no light (route E) and irradiation at 20% light intensity (route F) leads to a morphological transition in some instances. The morphology diagrams depict the morphologies of PEG113-b-PHPMA300 at 10 wt%, as an
example formulation. ... 159 Scheme 5.1. Preparation of PEG-b-PHPMA polymersomes with size-selective permeability in a one-pot aqueous photoinitiated RAFT dispersion PISA. ... 204
List of Tables
Table 2.1. Block copolymer and resultant particle characterization. Key: a determined by 1H NMR spectroscopy, b determined by SEC (DMF) analysis, c R
H of resultant micelles
determined by DLS analysis at 20 °C. d Rcore of resultant micelles determined by SLS
analysis at 20 °C. ... 82 Table 3.1. Properties of the polymers studied in this chapter and in Chapter 2. Key: * Mn
calculated from conversion 1H NMR spectroscopy. a Calculated using 1H NMR
spectroscopy relative to the polymer end group (mCTA1, 3 and 4) or known mCTA DP (1-17) (see experimental section for details). b Calculated from SEC analysis using 2% TEA in THF (mCTA2, mCTA3-4, 6-17) or 5mM NH4BF4 in DMF (mCTA1 and 1-5)
as the eluent against poly(methyl methacrylate) standards. c Calculated from multiple
angle DLS analysis using the Stokes Einstein equation. d Calculated from multiple angle
SLS analysis. ... 118 Table 3.2. Nagg and turbidimetry data for polymers 11-17. Key: a Mean cloud point upon
heating the micellar solutions determined using turbidimetry data across from three heating and cooling cycles. b For micelles with irreversible transitions, the cloud point
from the first heating cycle is shown. c The degree of hysteresis from solutions exhibiting
XVIII
Acknowledgements
Firstly, I would like to thank my supervisors, Prof. Rachel O’Reilly and Prof. Matthew
Gibson, for their mentorship, advice and guidance throughout my time spent at Warwick.
I have been very grateful for the scientific freedom they granted me, as well as their
eagerness to support me in future endeavors, for which I am extremely appreciative.
Thank you both for giving me this opportunity, and for collaborating together on this
project. Working with both of you in such a way has been a highlight of my PhD.
I would like to thank all the members of both the O’Reilly and Gibson groups. Having
access to your combined expertise and span of scientific research has made my PhD
incredibly interesting and engaging. I’m not sure I will ever have a chance to work with
such a talented, diverse team of people again and I greatly value this experience. In
addition, I would like to thank Dr. Gemma Davies and Prof. Andrew Dove, as well as the
members of their research groups. I’d like to also give a special thanks to Mrs. Annie
Morton. I would like to acknowledge members both past and present and wish you all the
very best for the future.
I would like to thank Dr. Daniel Wright and Dr. Matthew Robin for collaborating with
me on my first project and for sharing their knowledge in light scattering analysis and
polymer self-assembly, both key components of this thesis. I would like to thank Dr.
Helen Willcock and Dr. Craig Bell for all their help at the start of my PhD and for
answering every synthetic question I could possibly throw at them. I am also grateful for
Dr. Kay Doncom for her advice when starting to work with polymerization-induced
XIX I would like to thank Dr. Saskia Bakker and Dr. Muhammad Hasan for their training and
expertise in cryogenic transmission electron microscopy and Western blot analysis,
respectively. Dr. Chiara Arno also deserves a massive “thank you!” for all of the cell work
and advice on anything bio-related. Additionally, I would like to thank Mr. Rod Wesson
for his time in designing and building the photoreactor used to perform all of the
light-mediated polymerizations carried out in this Thesis.
Though the work has not been included in this Thesis, I am also grateful for the
opportunity to work with all those with which I have had the pleasure of collaborating on
projects outside of my own scope. These include Dr. Ignacio Insua and Dr. Francisco
Fernandez-Trillo, Miss Emma Brisson, Dr. Daniel Phillips, Dr. Heather Findlay and Prof.
Paula Booth, Dr. Elena Lestini, Mr. Robert Keogh, Mr. Spyridon Varlas and Prof. Robert
Mathers.
Those of you who have proof-read parts of this thesis: Dr. Rebecca Williams, Miss Maria
Inam, Dr. Joseph Jones, Dr. Benoit Couturaud, Mr. Robert Keogh, Mr. Spyridon Varlas,
Mr. Jon Husband, Dr. Tom Wilks and Dr. Anne Mabire, you have done an excellent job.
All of your advice and discussion has really helped me look at the work from an outsider’s
perspective and has undoubtedly improved its contents.
Away from the science, I’d like to thank all of you who have enabled me to work through
the times when things didn’t work, helped me accept when papers and grants got rejected,
and joined me in celebration when results got published. Those of you at Warwick know
who you are. I’d also like to take the opportunity to thank the Tennyson Terriers and all
my friends and family back in London for allowing me to escape every now and then, and
for reminding me that life exists outside of the Warwick bubble! A special thanks goes to
XX I’d like to thank my parents, Julia and David Blackman, for their support throughout my
undergraduate course at the University of Southampton and my postgraduate studies at
the University of Warwick. I’m sure they still have no idea about the contents of this
thesis, however they have always listened to my explanations with pride, and for that I
am very grateful.
Finally, I would like to thank Charlotte Davison for all the love and patience you have
shown me over the past five and a half years. This thesis truly would not have been written
without your constant support and kindness. Everywhere I go I’m a tourist but when I’m
XXI
Declaration of Authorship
This thesis was composed by myself and has not been submitted previously for the award
any degree. The work presented was carried out by myself, except in the following cases:
Chapter 2: Light scattering analysis of micelles comprised of polymers 1 and 4 was
performed by Dr. Daniel Wright at the University of Warwick. Rheological analysis was
performed with assistance from Miss Laura MacDougall. All differential scanning
microcalorimetry experiments were performed by application specialists at Malvern
Instruments Ltd. The quantitative 13C NMR spectrum of polymer 5a and the 500 MHz 1H
NMR spectra of polymers 1 and 4 in deuterium oxide were obtained by Dr. Ivan Prokes
at the University of Warwick.
Chapter 3: The synthesis of the RAFT agents 2-Cyano-2-propyl dodecyl trithiocarbonate
and 4-cyano-4-(((ethylthio)carbonothioyl)thio) pentanoic acid were performed by Mr.
Robert Keogh and Dr. Craig Bell at the University of Warwick, respectively. High
resolution electrospray ionization time of flight mass spectrometry was performed byDr.
Lijiang Song at the University of Warwick.
Chapter 4: MALDI-ToF analysis of the PHPMA oligomers was performed by Mr. Jon
Husband at the University of Warwick. The synthesis of
4-cyano-4-(((ethylthio)carbonothioyl)thio) pentanoic acid was performed by Dr. Craig Bell,
University of Warwick. The design and construction of the photoreactor used for all the
light-mediated polymerizations was carried out by Mr. Rod Wesson at the University of
Warwick.
Chapter 5: Expression and purification of GFP was carried out by Miss Alice Fayter at
the University of Warwick. The in vitro assessment of ASNS-loaded vesicles, including
XXII the University of Warwick. Western blot analysis of the enzyme-loaded vesicles was
performed with assistance from Dr. Chiara Arno at the University of Warwick. The
experimental sections for the in vitro studies and the GFP expression and purification
were prepared with assistance from Dr. Chiara Arno and Miss Alice Fayter, respectively.
Fluorescence microscopy was performed by Dr. Chiara Arno at the University of
Warwick. Cryo-TEM analysis was performed with assistance from Mr. Spyridon Varlas
and Mr. Robert Keogh at the University of Warwick, except in the case of the salt-free
GOx vesicles, whereby the analysis was performed with assistance from Dr. Saskia
Bakker at the University of Warwick. The design and construction of the photoreactor
used for all the light-mediated polymerizations was carried out by Mr. Rod Wesson at the
University of Warwick.
XXIII
Publications
1. Effect of micellization on the thermoresponsive behavior of polymeric
assemblies. L. D. Blackman, D. B. Wright, M. P. Robin, M. I. Gibson and R. K.
O’Reilly, ACS Macro Lett., 2015, 4, 1210-1214.
2. Probing the causes of thermal hysteresis using tunable Nagg micelles with linear
and brush-like thermoresponsive coronas. L. D. Blackman, M. I. Gibson and R.
K. O'Reilly, Polym. Chem., 2017, 8, 233-244.
3. Comparison of photo- and thermally initiated polymerization-induced
self-assembly: a lack of end group fidelity drives the formation of higher order
morphologies. L. D. Blackman, K. E. B. Doncom, M. I. Gibson and R. K.
O'Reilly, Polym. Chem., 2017, 8, 2860-2871.
4. Dispersity effects in polymer self-assemblies: a matter of hierarchical control. K.
E. B. Doncom, L. D. Blackman, D. B. Wright, M. I. Gibson and R. K. O'Reilly,
Chem. Soc. Rev., 2017, 46, 4119-4134.
5. Permeable protein-loaded polymersome cascade nanoreactors by
polymerization-induced self-assembly. L. D. Blackman, S. Varlas, M. C. Arno, A. Fayter, M. I.
XXIV
Summary of Thesis
This thesis explores the self-assembly and responsive behavior of block copolymer
amphiphiles in aqueous solution. In Chapter 1, an overview of the modern synthetic
methods used for preparing such materials will be given, as well as the parameters
governing block copolymer self-assembly in solution. An introduction into
polymerization-induced self-assembly will be given, as well as an overview of
stimuli-responsive polymers and polymer self-assemblies. Finally, an outline of the analytical
techniques used throughout this thesis for studying polymer self-assemblies will be given.
Chapter 2 will introduce thermoresponsive polymers, which can respond to changes in
temperature, before investigating the solution behavior of a series of thermoresponsive
polymer self-assemblies. These micelles have a tunable average number of chains per
particle and will used as a platform to investigate the thermoresponsive behavior of the
system using a range of complementary solution-based characterization techniques.
Chapter 3 will build on the knowledge gained in the previous chapter and will explore the
effects of factors such as the glass transition temperature and hydrogen bonding ability
on the thermoresponsive behavior of such systems. This will give an insight into the
reversibility of thermoresponsive phase transitions, more generally, and provide a unique
tool with which to probe structure-property relationships in stimuli-responsive
self-assemblies.
Chapter 4 will uncover the differences between the two initiation pathways for
polymerization-induced self-assembly, thermally and photoinitiated, discussed in this
Chapter. Isothermal non-equilibrium phase diagrams will be constructed using thermally
initiated and photoinitiated polymerization-induced self-assembly. The effects of light
post-XXV synthetic light irradiation, both are aspects that have not been widely explored in the
literature.
Chapter 5 will explore the use of polymerization-induced self-assembly to prepare
selectively permeable biohybrid vesicular nanoreactors. Functional proteins with
fluorescent or enzymatic capabilities will be encapsulated inside hollow polymersomes
and the selective permeability of the membrane will be demonstrated. A clinically
relevant therapeutic protein will also be investigated as the encapsulated species and the
formed nanoreactors’ ability to prevent cancer cell proliferation will be validated. The
non-covalent, yet protective nature of this protein compartmentalization will also provide
several distinct advantages over covalent attachment of poly(ethylene glycol), the current
state-of-the-art for this clinical therapeutic.
Finally, Chapter 6 will summarize the conclusions gained from the research herein, as
well as offer some insights into possible areas of new research directed by the findings
XXVI
Abbreviations
[M] monomer concentration
[M]0 initial monomer concentration
Ð dispersity
α degree of ionization α-CT α-chymotrypsin
β experimental correction factor in the Siegert relation
δ chemical shift
η viscosity
η0 specific viscosity
ηs viscosity of the solvent
θ angle
λ wavelength
ν wavenumber
ρ density
τ relaxation time
φ composition
χ interaction parameter
a0 area of a surfactant’s polar head group
A2 second virial coefficient
AA acrylic acid
Absx absorbance at a wavelength of x nm
ACVA 4,4’-azobis(4-cyanopentanoic acid)
Afast relative amplitude of the fast mode in a light scattering experiment
AM acrylamide
AN acrylonitrile
AIBN 2,2′-azobis(2-methylpropionitrile)
AP alkaline phosphatase
ARGET activators regenerated by electron transfer
Aslow relative amplitude of the slow mode in a light scattering
experiment
ASNS L-asparaginase
ATRP atom transfer radical polymerization
XXVII B 1,3-butadiene
bCA-II bovine carbonic anhydrase II
bpy 2,2'-bipyridine
br broad
BSA bovine serum albumin
BzMA benzyl methacrylate
c concentration
c* critical entanglement concentration
CAT catalase
ccorona effective mass concentration of coronal chains
CMC critical micelle concentration
ConA Concanavalin A
Cp heat capacity
cryo-TEM cryogenic transmission electron microscopy
CTA chain transfer agent
D deuterium
D apparent diffusion coefficient
d doublet
D0 absolute diffusion coefficient
DAAM diacetone acrylamide
DC direct current
DCC N,N’-dicyclohexylcarbodiimide
dd doublet of doublets
DEAEA N,N-diethylamino acrylate
DEAm N,N-diethylacrylamide
DEAMA N,N-diethylamino methacrylate
DEGMA diethylene glycol monomethyl ether methacrylate
DEPT distortionless enhancement by polarization transfer
DH hydrodynamic diameter
DLS dynamic light scattering
DMA N,N-dimethylacrylamide
DMAEA N,N-dimethylamino acrylate
DMAEMA N,N-dimethylamino methacrylate
DMAP 4-(dimethylamino)pyridine
XXVIII DMDMA (2,2-dimethyl-1,3-dioxolan-4-yl)methyl acrylate
DMF N,N-dimethylformamide
DMPA 2,2-dimethoxy-2-phenylacetophenone
dn/dc refractive index increment
DNA deoxyribonucleic acid
DP degree of polymerization
dt doublet of triplets
E. coli Escherichia coli
ER endoplasmic reticulum
ESI-MS electrospray ionization mass spectrometry
ESI-ToF electrospray ionization time of flight
EY eosin Y
F frictional force
FITC fluorescein isothiocyanate
FT-IR Fourier transform infra-red
g1(q,t) electric field autocorrelation function
g2(q,t) scattering autocorrelation function
GFP green fluorescent protein
GOx glucose oxidase
GSH glutathione
HEA hydroxyethyl acrylate
HPMA 2-hydroxypropyl methacrylate
HPMAM 2-hydroxypropyl methacrylamide
HRMS high resolution mass spectrometry
HRP horseradish peroxidase
I0 intensity of scattered light at time = 0
ICAR initiators for continuous activator regeneration
Ig immunoglobulin
Imicelle intensity of dye fluorescence emission at a wavelength
corresponding to the sequestered dye
IPTG isopropyl β-D-1-thiogalactopyranoside
Isample intensity of scattered light from the sample
Isolvent intensity of scattered light from the solvent
XXIX
Iwater intensity of dye fluorescence emission at a wavelength
corresponding to the unsequestered dye in aqueous solution
It intensity of scattered light at time = t
K contrast factor in SLS analysis
𝑘⃗ 0 incident wave vector
kB Boltzmann constant
kD dynamic virial coefficient
𝑘⃗ s scattered wave vector
L lamellae
LB lysogeny broth
LAM less activated monomer
lc length of a surfactant’s hydrophobic tail
LCST lower critical solution temperature
LED light emitting diode
LHS left hand side
LPO lactoperoxidase
m multiplet
m/z mass to charge ratio
MADIX macromolecular design via interchange of xanthate
MALDI-ToF MS matrix-assisted laser desorption/ionization time of flight mass
spectrometry
MAM more activated monomer
mCTA macromolecular chain transfer agent
MDO 2-methylene-1,3-dioxepane
Mi mass of chain of length “i”
Mn number average molar mass
Mn, corona number average molar mass of the corona-forming block
Mn, NMR number average molar mass determined by nuclear magnetic
resonance spectroscopy
Mn, SEC number average molar mass determined by size exclusion
chromatography
mcorona mass of the corona chains
MLV multilamellar vesicles
XXX MRI magnetic resonance imaging
Mw weight average molar mass
Mw, core weight average molar mass of the core-forming block
Mw, particle weight average molar mass of the particle
Mw, polymer weight average molar mass of the unimer
n refractive index
n0 refractive index of the solvent
NA Avogadro’s constant
Nagg aggregation number
NaTFA trifluoroacetic acid sodium salt
nBA n-butyl acrylate
Ni number of chains of length “i”
NIPAM N-isopropylacrylamide
NMP nitroxide-mediated polymerization
NMR nuclear magnetic resonance
NVC N-vinylcarbazole
NVP N-vinylpyrrolidone
OEGA oligo(ethylene glycol acrylate)
OEGMA oligo(ethylene glycol) monomethyl ether methacrylate
OmpF outer membrane protein F
p dimensionless packing parameter
P4VP poly(4-vinyl pyridine)
PAA poly(acrylic acid)
PAD poly((N-amidino)dodecylacrylamide)
PAEMA poly(2-azepane ethyl methacrylate)
PAGMA poly(o-azidomethyl benzoyl glycerol methacrylate)
PAMAM poly(amido amine) dendrimer
PAME poly(L-arginine methyl ester acrylamide)
PAPBA poly(3-acrylamidophenylboronic acid)
PAZo poly[6-(4-((4-nitrophenyl)diazenyl)phenoxy)hexyl methacrylate]
PBS phosphate buffered saline
PBzMA poly(benzyl methacrylate)
PD polydispersity
PDAAM poly(diacetone acrylamide)
XXXI PDEAEA poly(N,N-diethylamino acrylate)
PDEAm poly(N,N-diethylacrylamide)
PDEAMA poly(N,N-diethylamino methacrylate)
PDEGMA poly(diethylene glycol monomethyl ether methacrylate)
pDMA poly(N,N-dimethylacrylamide)
PDMAEA poly(N,N-dimethylamino acrylate)
PDMAEMA poly(N,N-dimethylamino methacrylate)
PDPMA poly(2-(diisopropylamino)-ethyl methacrylate)
PEHA poly(2-ethyl hexyl acrylate)
PEG poly(ethylene glycol)
PEG-ASNS L-asparaginase poly(ethylene glycol) conjugate
PEO poly(ethylene oxide)
PET photoinduced electron transfer
PGA poly(glyceryl acrylate)
PGlyMA poly(glycidyl methacrylate)
PGMA poly(glyceryl methacrylate)
pH negative base 10 logarithm of the molar proton concentration
PHPMA poly(2-hydroxypropyl methacrylate)
PHPMAM poly(2-hydroxypropyl methacrylamide)
PIAT poly(3-(isocyano-L-alanyl-aminoethyl)thiophene))
pKa negative base 10 logarithm of the acid dissociation constant
pKaH negative base 10 logarithm of the acid dissociation constant of the
conjugate acid
PLMA poly(lauryl methacrylate)
Pm• growing radical chain
PMAA poly(methacrylic acid)
pMeOxVAc poly(oligo(ethylene glycol) vinyl acetate)
PMMA poly(methyl methacrylate)
PMOXA poly(2-methyloxazoline)
PMPC poly(2-(methacryloyloxy)ethyl phosphorylcholine)
Pn• growing radical chain
PNA N-phenyl-1-naphthylamine
pnBA poly(n-butyl acrylate)
PNBOCA poly(2-((((2-nitrobenzyl)-oxy)carbonyl)amino)ethyl acrylate)