2 ABSTRACT.
Objective/aim: In the field of verticality on consumer responses, research largely consist of studies that investigated the influence of single design features as verticality cues and vertical oriented images in packaging on consumer responses. The influence and congruence between verticality cues and longitudinality in packages is understudied. Therefore, this research aims to examine whether different combinations of verticality (vertical vs. horizontal cues) and longitudinality (longitudinal, lateral and neutral packaging) in packaging influences consumer responses, like taste experience, perceived attractiveness and purchase intention. This leads to the following research question: What is the effect of verticality and longitudinality in packaging on consumer responses?
Method: A taste experiment with questionnaire was set out to measure the relationship between the two dependent variables (verticality and longitudinality) and three dependent variables (taste experience, perceived attractiveness and purchase intention) in a 2 x 3 design. In total 185 Dutch participants participated in this study.
Findings: Results from this study showed no significant effect of verticality cues and longitudinality on consumer responses. However, results showed that taste experience and perceived attractiveness have a strong contribution on purchase intention. On this basis, it can be concluded that verticality cues in combination with longitudinality in packaging have no effect on consumer responses for products with an intense taste.
Practical implications: It is interesting for companies and marketers to invest in designing attractive packages, because this will positively influence the purchase intention of consumers. Furthermore, it might be interesting for companies to further investigate the effects of verticality in packaging for less intense taste products.
3 TABLE OF CONTENTS.
1 -INTRODUCTION ...4
2 – THEORETICAL FRAMEWORK ...6
2.1 Impact of packaging for fast moving consumer goods ...6
2.2 Influence of verticality cues ...6
2.3 Influence of longitudinality...8
2.4 Congruency ...9
2.5 Taste evaluation ... 10
2.6 Perceived attractiveness ... 11
2.7 Purchase intention ... 11
2.8 Conceptualization ... 12
3 -METHOD ... 13
3.1 Research design ... 13
3.2 Pre-test ... 14
4 -MAIN STUDY ... 19
5 -RESULTS... 26
5.1 Taste experience... 26
5.2 Perceived attractiveness ... 27
5.2 Purchase intention ... 27
5.3 Hypotheses ... 30
6 -DISCUSSION AND CONCLUSION ... 31
6.3 Main findings ... 31
6.3 Limitations and future research ... 33
6.3 Practical implications ... 35
6.3 Conclusion ... 35
REFERENCES ... 37
APPENDIX A – RESULTS PRE-TEST 1 ... 41
4 1. INTRODUCTION.
Nowadays, consumers have a number of choices while shopping for their everyday food and beverages. Almost every product is available from multiple types of brands. What triggers us to choose one brand over another? What does packaging tell us when we are standing in front of a product shelf? This study elaborates the effect of verticality and longitudinality in packaging on consumer responses.
With a plethora of brands in the marketplace, marketers use many different ways to engage customers with their brand (Cian, Krishna & Elder, 2014). Particularly, packaging received the attention of organizations, because it is the main tool of sales promotion for their product (Amin, Imran, Abbas & Rauf, 2015). Without any ‘spoken sales-man’, the brand can talk to consumers through the design of the package. Packaging will affect consumers response and purchase intentions, because it allows consumers to form expectations about the product, its attributes and its taste (Ares & Deliza, 2010; Becker, van Rompay, Schifferstein & Galetzka, 2010). As suggested above, the effect of a packaging is extremely important and can be influenced by its aesthetics. This study focusses on ‘Verticality’, a very new concept in aesthetics in packages.
The theory behind verticality has been used in metaphorical association for a long time. Examples of such metaphors are cases of ‘control is up’ and ‘lack of control is down’, which means: high power equals up. In other words, these metaphors describe power in a vertically related dimension (Schubert, 2005; Machiels & Ort, 2017).However, it has been found that the theory behind ‘verticality’, in addition to textual metaphor, also can be applied visually in packaging design.
Previous research on verticality in packaging on consumer behavior showed that upward movement is perceived as being more powerful and luxurious instead of horizontal movement (van Rompay, Fransen, & Borgelink, 2014). Another study in the field of verticality tested 2 ad-displays with vertical and horizontal visual cues. Results showed that participants gave higher ratings on taste intensity and luxury perception when they were exposed to an ad-display with vertically oriented visual cues, as opposed to horizontally oriented visual cues (van Rompay, van Hoof, Rorink and Folsche, 2019). However, the impact of longitudinality for these cues is not take into account. Longitudinality occurs through the form of the package. For example, vertical stripes on a standing rectangular package form have longer stripes, which means that the cues are longitudinal, as opposed to lateral. Assuming that longer is stronger, longitudinal designs might positively effect consumer responses. However, as far as the author knows, this effect has never been tested before.
5 verticality (horizontal vs. vertical designs) and longitudinality (longitudinal vs. lateral vs. neutral) in packaging influences consumer responses (taste evaluation, perceived attractiveness and purchase intention). To examine the effects of verticality and longitudinality, an experimental 2x3 design, with the use of a taste test and questionnaire were applied in order to answer the following research question: What is the effect of verticality and longitudinality in packaging on consumer responses?
In this paper, first a literature review is presented to introduce the reader to all relevant literature concerning the effects of verticality and longitudinality in packaging on consumer responses. Subsequently, the methodology of this study is described. Thereafter, the main results of this study gathered from the questionnaire will be presented. Finally, results, limitations and implications for further research are discussed.
Definition box:
Longitudinality:
In the direction of the length (of the package)
Laterality:
In the direction of the width (of the package)
6 2. THEORETICAL FRAMEWORK.
This chapter evaluates previous literature that is related to the independent (verticality and longitudinality) and the dependent variables (taste experience, attractiveness of package and purchase intention) for fast-moving consumer. This will lead to a conceptualization of all the hypotheses of this study.
2.1 Impact of packaging for fast-moving consumer goods
In a world where many similar products are competing to gain consumer interest and must perform in a wide variety of retail venues, packaging is becoming increasingly important. Companies are looking for unique packaging, because not only does this capture awareness but packages also serves as a means of communicating with consumers. Packages frequently are the first exposure consumers have to products (Cian, Krishna & Elder, 2014). This first exposure can lead to several consumer responses, for example price expectations, taste expectations or purchase intention. Specifically, for fast-moving consumer goods (e.g. daily purchased products) the first exposure is extremely important, because consumers are low involved with these products. The fast decision-making processes of FMCG lack on product information and are moreover based on package design or other visual appearances (van Rompay et al., 2014). Packaging are often the most distinguished and important marketing effort influencing the decision-making process of the consumer, as 40 to 70 per cent of purchase intention is formed in the store (Van Ooijen, 2016). Therefore, companies spend more money on packaging than on advertising (Schoormans & Robben, 1997).
Because of these effects, packaging for FMCG-products are very important, it consists of typographical, figurative and abstract images, or a combination of these elements and is intended to create positive associations in the minds of consumers (Buttle & Westoby, 2006; Aaker & Keller, 1990). The current study focuses on these communicative functions of a product’s appearance through its packaging rather than on technical packaging functions. The effects of two variables (verticality and longitudinality) in packaging on consumer response are described in the following sections.
2.2 Influence of verticality cues
7 information that can be placed on packages, marketers spend a lot of money on finding new ways that have a positive effect on consumers’ responses (Cian, Krishna & Elder, 2014; Aaker & Keller, 1990; Machiels & Orth, 2017). According to Machiels and Orth (2017) metaphorical concepts in packaging are gaining interest, especially metaphors involving spatial representations.
For a long time, we have been using metaphorical associations, like vertical-space positioning ( i.e., the number of printed books every year is going up’ and ‘if you are too hot, turn the heat down’) (Lakoff & Johnson, 1980). Several studies have investigated the relation between constructs, such as power, valance, luxury and metaphorical associations (Cian, 2016). Schubert stated that these metaphors are cases of ‘control is up’ and ‘lack of control is down’, which means: high power equals up (2005). In other words, these metaphors describe power in a vertical related dimension (Schubert, 2005; Machiels & Ort, 2017). Since this study will focus on verticality cues in designs to influence ‘taste intensity’ perception, up and down are mostly used as metaphor when we talk about ‘more and less (intensity)’ (Lakoff & Johnson, 1980), but how can marketers implement visual metaphors into packaging? Deng and Kahn, for instance, showed that the location of the product image (top or bottom) on a package influences consumers’ perception of the visual heaviness of the product (2009). Subsequently, van Rompay et al., (2014) showed that also the purchase intention of the consumer was higher when the imagery on the package design was located in the top-left, instead of bottom-right. Besides, this study showed also that a package design with an upward movement was evaluated as more attractive and beautiful, rather than downward. Additionally, Machiels and Ort (2017) demonstrated that consumers perceive a product as more powerful when the label on the package is placed in a higher (vs. lower) vertical position. Verticality also plays a role in perceived attractiveness. A study of Meier and Dionne (2009) showed that females rated males as more attractive when their images appeared near the top of a screen.These findings mentioned above, showed that spatial positions in designs (more specific: upwards movements) have a positive influence on consumer responses. Speaking of verticality in spatial positions, verticality can also be implemented in visual design, such as vertical cues (stripes). For example, study of van Rompay, van Hoof, Rorink and Folsche (2019) tested 2 ad-displays with vertical and horizontal visual cues. Results showed that participants gave higher ratings on taste intensity and luxury perception when they were exposed to an ad-display with vertical oriented visual cues rather than horizontal oriented visual cues.
8 H1: Packaging with vertical visual cues, as opposed to horizontal visual cues, will positively influence consumer responses
H1a: Packaging with vertical visual cues, as opposed to horizontal visual cues, will lead consumers to experience the product taste as more intense.
H1b: Packaging with vertical visual cues, as opposed to horizontal visual cues, will positively influence taste liking.
H1c: Packaging with vertical visual cues, as opposed to horizontal visual cues, will lead consumers to experience the product taste as more complex.
H1d: Packaging with vertical visual cues, as opposed to horizontal visual cues, will lead consumers to experience the package as more attractive.
H1e: Packaging with vertical visual cues, as opposed to horizontal visual cues, will positively influence consumers’ purchase intention.
2.3 Influence of longitudinality
The physical form or design of a product is an important determinant of its marketplace success. A good design attracts consumers to a product and communicates with them (Bloch, 1995). Therefore, more and more researchers investigate the effects of form or design of product packaging. In this section the role of longitudinality in packaging cues will be described. Longitudinality will occur when cues are presented on a packaging that is stretched. For example, when vertical cues are presented on a standing rectangular packaging, the cues are longitudinal (e.g. relating to the length). When vertical cues are presented on a lying rectangular package, the cues are lateral (e.g. lateral is to the side, pertaining to the side). To understand the effect of longitudinality in packaging, literature in the field of package form and shapes are studied.
Earlier studies showed that the shape of a package has an impact on taste evaluations and consumer responses (Van Doorn, Woods, Levitan, Wan, Velasco, Bernal-Torres & Spence, 2017). According to literature, consumers’ product evaluations and choices are influenced by the visual appearance of product design (Creusen & Schoormans, 2005). Several authors considered the role of verticality cues in packaging on consumers’ evaluations, such as taste experience or purchase intention. (Machiels & Orth, 2017; van Rompay, de Vries, Bontekoe & Tanja-Dijkstra, 2012).
9 H2: Longitudinality, as opposed to laterality, in packaging will positively influence consumer responses.
H2a: Longitudinality, as opposed to laterality, in packaging will lead consumers to experience the product taste as more intense.
H2b: Longitudinality, as opposed to laterality, in packaging will positively influence consumers’ perceptions of taste liking.
H2c: Longitudinality, as opposed to laterality, in packaging will lead consumers to experience the product taste as more complex.
H2d: Longitudinality, as opposed to laterality, in packaging will lead consumers to experience the packaging as more attractive.
H2e: Longitudinality, as opposed to laterality, in packaging will positively influence consumers’ purchase intentions.
2.4. Congruency
There are different properties and features of product packages that influences consumer responses. Besides the individual product features, congruence between different elements is also an important determinant of consumer responses (van Rompay & Pruyn, 2011). Based on the processing fluency theory, congruency is perceived when different elements are: unity and visually fluent, this generally leads to more positive evaluations (Reber, Schwarz & Winkielman, 2014; van Rompay & Pruyn, 2011). Various studies show that congruence between visual elements have a positive effect on consumers’ responses like perceived attractiveness, product value and purchase intention (Hekkert, 2006; Winkielman, Schwarz, Reber & Fazendeiro, 2000). Moreover, findings suggest that elements that are high in congruence can be effortlessly processed and are generally visually more attractive, credible and solid evaluated, as opposed to incongruent elements. (Reber et al., 2004). Elements that are incongruent need more elaborate cognitive thinking, and are therefore seen as thrilling and interesting (Dahlén, Lange, Sjödin & Törn, 2005; van Rompay & Pruyn, 2011). For example, van Rompay et al. (2010) showed that congruence between image portrayal and textual descriptions in an online hotel advertisement had more positive attitude ratings, as opposed to incongruence between text descriptions and image portrayal.
10 influence on taste experience, perceived attractiveness and purchase intention. Hence, the following hypothesis is formulated:
H3: Congruency between verticality cues and longitudinality in packaging positively influences taste experiences, perceived attractiveness and purchase intention.
2.5 Taste evaluation
Product design is an important determinant in consumers preferences and choices. Even though design (inclusive or aesthetic) has been studied for centuries, there continues to be a great deal of uncertainty or ambiguity concerning design and people’s reaction to it (Veryzer, 2010). According to Westerman, Sutherland, Gardner, Baig, Critchtley, Hickey, Mehigan, Solway, & Zervos (2013), aesthetic preferences related to packaging design influence consumers’ product attitude and with that taste evaluation.
Humans are able to distinguished their taste perception into five different taste categories: sweet, sour, salty, bitter and umami (i.e. “tasty” or “delicious”) (Ikeda, 2002). Even though we consume food and beverages on a daily basis, it is hard to differentiate one taste from another by using only taste (Krishna, 2012). This food evaluation is described as the awareness of the psychological effects of interacting with a product (Schifferstein et al., 2012), wherein one can see large individual different experiences (Chen & Engelen, 2012). Since this research focusses on the effect of packaging on taste evaluations, it is already known for a long time that consumers’ taste evaluation is influenced by packaging through text, color and images (Cardello, 1994; Schifferstein, Fenko, Desmet, Labbe & Martin, 2012). Smets and Overbeeke tested if taste of a dessert can be expressed on packaging. To test this hypothesis subjects were asked if they could match ten dessert and ten packaging designs. The results show that people are able to match deserts and packaging design. This might be an indication that designers are able to transpose information from one perceptual system to another and that people are sensitive to this information (1995). More research showed the influence of packaging on taste experiences. A study by Becker, van Rompay, Schifferstein & Galetzka, demonstrated that an angular packaging shape positively influenced the taste intensity perception of yoghurt (2011). Looking into the concept of lay-outs of designs, verticality cues in packaging designs creates a more intense and liking taste evaluation of coffee (van Rompay et al., 2019).
11 2.6 Perceived attractiveness
Perceived attractiveness is usually defined in literature as “the appreciation of an object in terms of beauty” (Celhay & Trinquecoste, 2014, p. 1015). The perceived attractiveness is based on the visual aspects of product design that lead to hedonic responses with the customer. Packaging are mostly meant to be visually attractive to customers, because attractiveness guides behavior (Orth & Crouch, 2014). Attractive packages capture awareness (Cian, Krishna & Elder, 2014), generate liking (Cho & Schwarz, 2010), lead to a higher willingness to pay for (Bloch, Brunel & Arnold, 2003) and trigger an immediate desire to purchase the product (Reimann, Zaichkowsky, Neuhaus, Bender & Weber, 2010). The positive influence of perceived attractiveness of a product design on purchase intention was already earlier hypothesized by Bloch (1995). Nowadays, “a considerable amount of research also suggest that visual appreciation is an important determinant of consumer preferences, with many studies demonstrating the positive impact on product perceived value, and therefore on consumer purchase intention, satisfaction and loyalty” (Celhay & Trinquecoste, 2014, p. 1015). For example, van Rompay et al., (2014) showed that an imagery located in the top left on the packaging, instead of bottom-right, lead to higher purchase intention of the consumer. Thereby, results showed also that a packaging with an upward movement was evaluated as more attractive and beautiful.
Knowing this, it is expected that high perceived attractiveness lead to a higher purchase intention of the product.
2.7 Purchase intention
12 This study aims to investigated the importance of an extrinsic characteristic (packaging) of throat pastilles on consumer intention to purchase by taking into account consumers’ taste evaluation (intrinsic characteristic) and perceived attractiveness. Finally, the following hypotheses are conducted:
H4a: Taste experience will have a contribution on purchase intention H4b: Perceived attractiveness will have a contribution on purchase intention
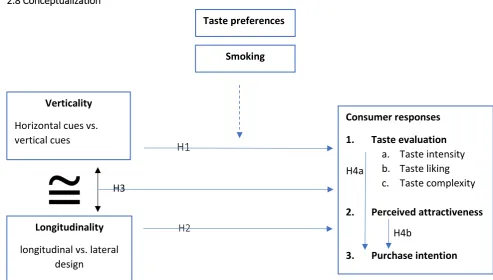
2.8 Conceptualization
H1
H3
[image:12.595.64.558.241.521.2]
H2
Figure 1. Conceptual model Verticality
Horizontal cues vs. vertical cues
Longitudinality longitudinal vs. lateral
design
Consumer responses 1. Taste evaluation
a. Taste intensity b. Taste liking c. Taste complexity 2. Perceived attractiveness
3. Purchase intention Taste preferences
Smoking
H4a
13
.
3. METHOD
.
The purpose of this study is to investigate the effect of verticality of cues and packaging on taste experiences. This section of the paper elaborates the research design and accountability of the stimulus material used in this research.
3.1 Research design
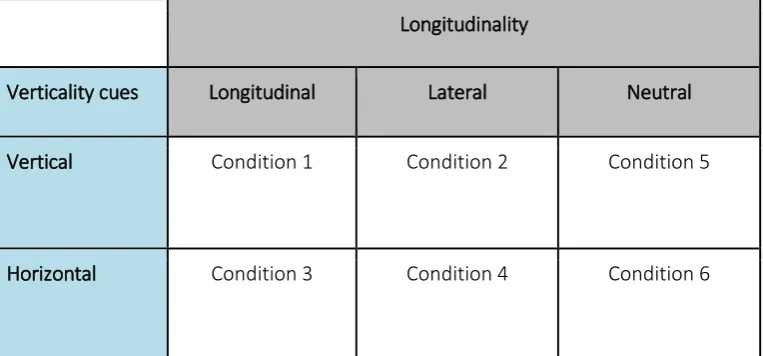
[image:13.595.73.455.470.648.2]The conducted research is an experimental 2x3 design with six conditions. An experiment has been chosen because it gives a good insight in the cause-and-effect relationship by manipulating each condition and demonstrating which outcome occurs. The goal of this experimental research is to answer the main question: What is the effect of verticality and longitudinality in packaging on consumer responses? Two independent variables are included, namely verticality (vertical cues vs. horizontal cues) and longitudinality (longitudinal vs. lateral vs. neutral packaging) The dependent variables of this research are ‘taste experience, ‘attractiveness of packaging’ and ‘purchase intention’. Hence, the study design looks as follow: 2 (horizontal cue vs. vertical cue) x 3 (longitudinal vs. lateral vs. neutral packaging). All 6 conditions of this research are shown in table 1 below.
Table 1. Experimental conditions
Longitudinality
Verticality cues Longitudinal Lateral Neutral
Vertical Condition 1 Condition 2 Condition 5
14 3.2 Pre-tests
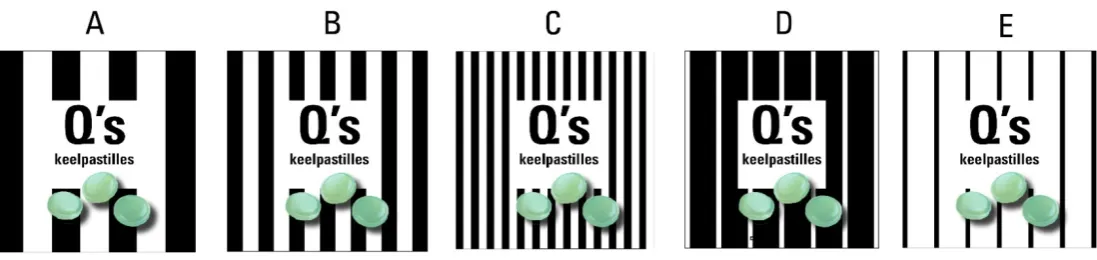
To develop reliable stimuli two pre-tests are conducted. In the first pre-test the influence of the design of different vertical cues on the expected taste experience is tested. In total, 10 different cues were designed (5 vertical cues and 5 horizontal cues) in order to measure which design gives the most expected intense/powerful taste feeling. To eliminate the possible effect of longitudinality and laterality of the cues, which occurs by horizontal or vertical packaging, only a neutral packaging (squared) is used in the pre-test. With this, the level of intensity is only influenced by the design of the cues. Each design has the same picture of pastilles on its cover and the same brand logo (Q’s).
3.2.1 Pre-test 1
The pre-test is distributed in two conditions. In condition 1, the respondents only saw the designs with vertical cues and in condition 2, only the designs with horizontal cues. To choose the most representative design, that is associated with intensity, 5 different designs were ranked on dimensions as strong, weak, powerful, savorless, intense, boring, fresh and mild. Respondents were asked to rank the 5 visual elements, from 1 to 5, according to their expectations. (1: fits the best with their expectation … 5: fits most badly with their expectation) The used stimulus material is showed in figures 2 and 3, below.
[image:14.595.26.575.522.652.2]In total, a number of 30 respondents with an age from 16 to 61 (mean age was 30), have participated in the pretest. 63% were female. The results of the pretest are presented in appendix A and show no significant difference between the expected taste experiences for the different stimuli.
15 Figure 3. Stimuli horizontal cues pre-test 1.
3.2.2 Pre-test 2
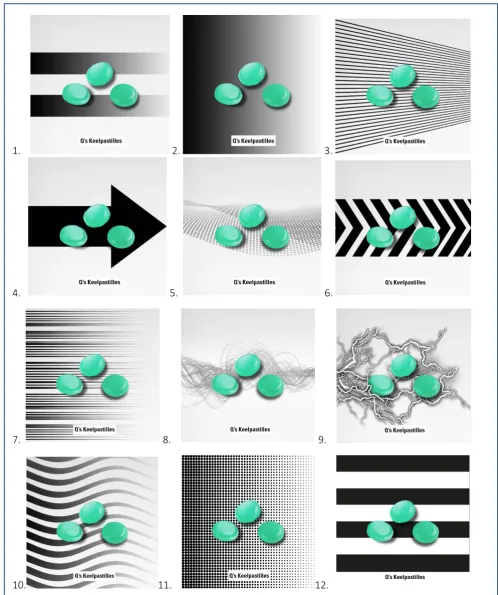
A second test was conducted to see if a suggestion of movement in designs will lead to more powerful designs. In the second pre-test 14 designs, presented both horizontally and vertically, were tested (28 stimuli in total). In the second pre-test, 3 of the designs were re-used from the first pre-test (without suggestion of movement) and the other 11 were new (with suggestion of movement). The second pre-test was set out in a Q-sort. Respondents were asked to rank the designs based on a scale from -3 (less intense taste expectation) till 3 (most intense taste expectation). To choose the most representative design, that is associated with intensity, respondents were asked to rank the designs by the Q-sort method with a range from -3 till 3 (-3= weak, boring, mild taste expectation…3= strong, powerful and intense taste expectation). The used stimulus material is showed in figures 3 and 4, below.
In total, a number of 15 respondents with an age from 20 to 54 (mean age was 31), have participated in the pretest. 60% were female.
Figure 4.: Vertical designs 1 till 14 pre-test 2.
[image:15.595.52.536.566.763.2]16
4. 5. 6.
7. 8. 9.
10. 11. 12.
17 Figure 5. Horizontal designs 1 till 14 pre-test 2.
1. 2. 3.
4. 5. 6.
7. 8. 9.
18
13. 14.
[image:18.595.72.504.288.545.2]3.2.3 Results and discussion
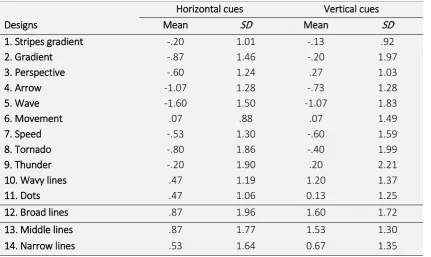
Table 2. Results Q-sort most powerful design pre-test 2
Horizontal cues Vertical cues
Designs Mean SD Mean SD
1. Stripes gradient -.20 1.01 -.13 .92
2. Gradient -.87 1.46 -.20 1.97
3. Perspective -.60 1.24 .27 1.03
4. Arrow -1.07 1.28 -.73 1.28
5. Wave -1.60 1.50 -1.07 1.83
6. Movement .07 .88 .07 1.49
7. Speed -.53 1.30 -.60 1.59
8. Tornado -.80 1.86 -.40 1.99
9. Thunder -.20 1.90 .20 2.21
10. Wavy lines .47 1.19 1.20 1.37
11. Dots .47 1.06 0.13 1.25
12. Broad lines .87 1.96 1.60 1.72
13. Middle lines .87 1.77 1.53 1.30
14. Narrow lines .53 1.64 0.67 1.35
The outcomes of the conducted pre-test were analyzed and the results are presented in table 2 above. Results from the second pre-test show that design 12 (‘Broad lines’) was considered to be as most intense/powerful. This design scored highest in both, vertical (M = 1.60, SD = 1.72), and horizontal (M
= .87, SD = 1.96) design. Therefore, design 12 will be used in the main study.
19
4. MAIN STUDY
.
In the main study, the possible effects of verticality cues in packaging on the taste experiences is investigated. In this section, the stimulus material, procedure, measures, participants and reliability is described.
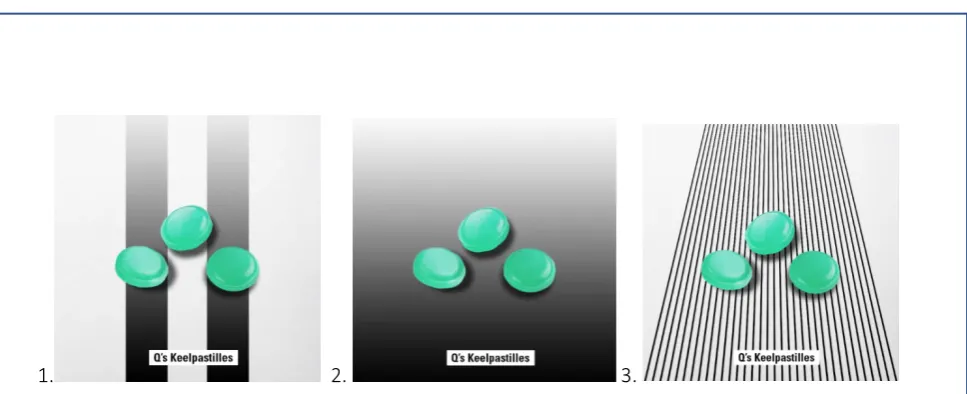
4.1 Stimulus material and design
For the main study, verticality cues were used in different designs: Vertical design, squared design and horizontal design. In total, 6 packages (stimuli) will be tested. This study uses a fictitious brand
[image:19.595.69.372.311.521.2]name/logo and all packages have the same color and volume, to exclude any other variable that might interfere with the stimuli of interest.
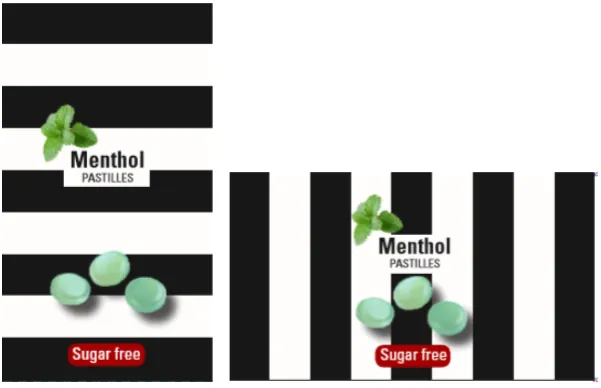
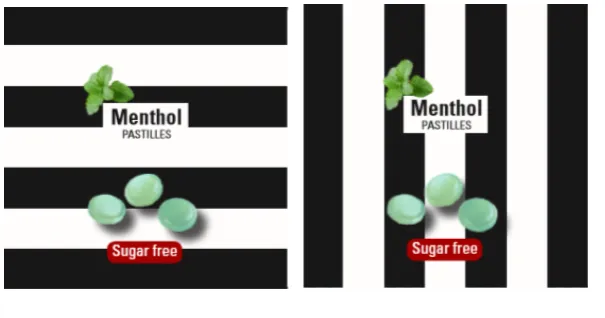
Figure 6. Congruent condition: longitudinal (vertical vs. horizontal cues).
Figure 7. Incongruent condition: Lateral (vertical vs. horizontal cues).
[image:19.595.70.371.555.749.2]20 Figure 8. Neutral condition (vertical vs. horizontal cues).
4.2
Procedure
The used tool for this research is Qualtrics, because this is easy in use and can automatically converse the answers of the questionnaire into a SPSS file. Furthermore , this tool prevents an interviewer bias. The questionnaire was dived into 6 conditions according to the stimuli. The respondents were exposed to 1 of the 6 stimuli and were asked to taste the throat pastille and fill in the questionnaire. The respondents were told that a new brand of throat pastilles is in development and that their opinion about the taste experience is valuable. However, it was not told that the survey measured the effect of verticality cues in packaging on consumer responses, to ensure the reliability of the study. In the introduction, participants were informed about the anonymity of their answers and that participation for this study was voluntarily. Respondents remained the right to terminate the participation at any time in the study. Furthermore, in the introduction the following demographic questions are asked: Gender (Male/Female), Age (18-25, 26-33, 33-41, 42-65), level of education (vmbo, havo, vwo, mbo, hbo, wo, wo-master).
21
4.3 Measures
In this section the dependent variables, manipulation check and control questions are described. The complete survey can be found in Appendix B.
4.3.1 Taste experience
The construct taste experience measures the evaluation of the throat pastilles on 3 different levels, namely taste intensity, taste complexity and taste liking.
To measure the effect of the independent variables on taste experience, multiple items were
formulated. These items measures how the participants perceived the taste of the throat pastille. The taste intensity, based on a study of van Rompay, van Hoof, Rorink, & Folsche (2018), was measured using the dimensions, ‘strong’, ‘powerful’, ‘weak’ (r), ‘intense’ and ‘flat’ (r). Participants had to indicate to what extent they considered these items descriptive for the taste of the throat pastille. The
responses of the participants were recorded on a 7-point Likert scale (1= Strongly disagree ... 7= Strongly agree).
The second construct contains items to measure the taste liking based on a study of Fenko, Backhaus & Van Hoof (2015). Four, seven-point Likert-type items are used in this scale to measure the degree to which a person describes a food or beverage as being pleasurable to consume (1= Strongly disagree ... 7= Strongly agree). The items included good taste, unpleasant to eat (r), enjoy eating the throat pastille and the pastille has a pleasant structure. Respondents had to rank the items on a 7-point Likert scale, ranging from strongly disagree to strongly agree.
The last indicator of taste experience is ‘Taste complexity’, which is measured by the items ‘The taste is complex’, ‘The throat pastille has a rich taste’ and ‘The taste of the throat pastille is balanced’. This is also measured on a 7-point Likert scale (1= Strongly disagree ... 7= Strongly agree).
4.3.2 Attractiveness of packaging
22
4.3.3 Purchase intention
To measure the purchase intention, a set of three items was formulated. This construct measure the degree a consumer intends to buy the product. This will be measured on a 7 point-Likert scale (1= Strongly disagree ... 7= Strongly agree) by 3 item: ‘I would consider buying this throat pastille at the supermarket’, ‘I would recommend this throat pastille to my friends’ and ‘I would like to receive a test package’.
4.4. Control questions
To test whether the study measured the experimental stimuli effectively, a manipulation check was used. Respondents were exposed to two manipulation check questions at the end of the questionnaire and were asked if the stripes on the package were horizontal or vertical and if the package was standing, lying or squared.
4.5 Covariates
To be able to draw conclusions from the answers given and to explain possible outliers, one has to gain insight in the taste preferences of the participants. Taste preferences and current behavior towards eating mint is seen as a covariate in this research. To measure the taste preferences, the participants had to indicate to what extent they agreed with the statements ‘I like eating mint’, ‘I like strong flavors’ and ‘I like intense flavors’. Responses will be measured on a 7-point Likert scale ranging from 1= totally disagree – 7= totally agree. Additionally, the participants had to fill in how many times a week they consume food or beverages with mint taste, because this could influence their perception of intensity or likeness. At last, participants were asked if they smoke on a daily basis, in case this will influence their taste ability.
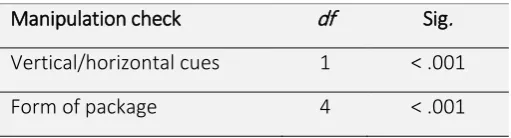
4.6 Manipulation check
23 manipulation check it can be concluded that all the manipulations succeeded, because the differences of the first question were significant χ2 (1, N = 185) = 165.56, p <.001). Furthermore, results from the
manipulation check showed that the differences of the second control question were also significant χ2
[image:23.595.71.327.214.283.2](4, N = 185) = 329.79, p < .001).
Table 3. Manipulation check
Manipulation check df Sig. Vertical/horizontal cues 1 < .001 Form of package 4 < .001
4.7 Participants and randomization check
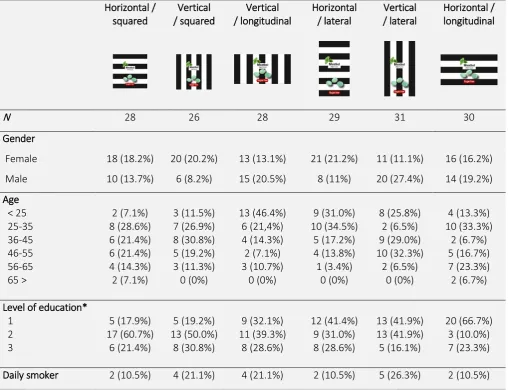
For the main study, 185 respondents participated in this research, distributed over six experimental conditions. 12 respondents were removed after the manipulation check and 1 outlier was removed. After cleaning up the data set, 172 respondents were involved in the further data analysis. Gender (73 male, 99 female) was not equally distributed in the population, χ2(5, N = 172) = 14.95, p = .01. The
average age of participants was between 36 and 45 years old, with the youngest participant being 25 or younger and the oldest 65 or older. The age was also not equally distributed in the population, χ2(25,
N = 172) = 45.73, p = .01). The level of education is categorized into 3 labels: low (N = 64), middle (N = 66) and high (N = 42) level of education (CBS, 2017). These frequencies were significant different among the conditions, χ2(10, N = 172) = 25.69, p = < .001). The percentage of participants that smoked did not
differ by conditions, χ2(5, N = 172) = 3.14, p = .68). Of all 172 respondents, 28 respondents were exposed
24 Table 4. Demographics of participants for each condition of packaging.
Horizontal /
squared / squared Vertical / longitudinal Vertical Horizontal / lateral Vertical / lateral Horizontal / longitudinal
N 28 26 28 29 31 30
Gender
Female 18 (18.2%) 20 (20.2%) 13 (13.1%) 21 (21.2%) 11 (11.1%) 16 (16.2%) Male 10 (13.7%) 6 (8.2%) 15 (20.5%) 8 (11%) 20 (27.4%) 14 (19.2%) Age < 25 25-35 36-45 46-55 56-65 65 > 2 (7.1%) 8 (28.6%) 6 (21.4%) 6 (21.4%) 4 (14.3%) 2 (7.1%) 3 (11.5%) 7 (26.9%) 8 (30.8%) 5 (19.2%) 3 (11.3%) 0 (0%) 13 (46.4%) 6 (21,4%) 4 (14.3%) 2 (7.1%) 3 (10.7%) 0 (0%) 9 (31.0%) 10 (34.5%) 5 (17.2%) 4 (13.8%) 1 (3.4%) 0 (0%) 8 (25.8%) 2 (6.5%) 9 (29.0%) 10 (32.3%) 2 (6.5%) 0 (0%) 4 (13.3%) 10 (33.3%) 2 (6.7%) 5 (16.7%) 7 (23.3%) 2 (6.7%)
Level of education* 1 2 3 5 (17.9%) 17 (60.7%) 6 (21.4%) 5 (19.2%) 13 (50.0%) 8 (30.8%) 9 (32.1%) 11 (39.3%) 8 (28.6%) 12 (41.4%) 9 (31.0%) 8 (28.6%) 13 (41.9%) 13 (41.9%) 5 (16.1%) 20 (66.7%) 3 (10.0%) 7 (23.3%)
Daily smoker 2 (10.5%) 4 (21.1%) 4 (21.1%) 2 (10.5%) 5 (26.3%) 2 (10.5%) * 1= low level of education, 2= middle level of education, 3 = high level of education.
4.8 Reliability
25 the construct ‘taste complexity’, only the item ‘The taste of the throatpastille is complex’, will be used in further analysis, because of the reliability of the construct.
Table 5. Construct reliability
Construct α N Items removed
Taste experience
Taste intensity .81 6 0
Taste liking .82 4 0
Taste complexity n/a 1 2
Perceived attractiveness .90 3 0
26
.
5. RESULTS
.
This chapter describes the main results gathered from the survey. The data is analyzed using the ANOVA test in SPSS, which test the influence of verticality cues and longitudinality in packaging on taste experience, perceived attractiveness and purchase intention. The findings of these analyses are presented below for each construct and summarized in table 6.
5.1 Taste experience
Taste intensity
There was no significant main effect of verticality on taste intensity, F(1, 172) = .004, p = .95. Thereby, further analysis of the results show no significant effect of longitudinality in design on taste
intensity, F(1, 172) = .83, p = .44. Also no interaction effect was visible between verticality * longitudinality on taste intensity, F(1, 172) = 1.77, p = .17. Additionally, a significant effect of the covariates on taste intensity is visible, F(1, 172) = 3.92, p = .05). This result shows that taste preferences and being a smoker or not, influences the perceived taste intensity.
Taste liking
The verticality cues in packaging seems to have no significant main effect on taste liking, F(1, 172) = 0.64, p = 0.43). Also, longitudinality showed no significant effect on taste liking, F(1, 172) = 0.19, p = .83. Furthermore, no interaction effect was visible between verticality * longitudinality on taste intensity, F(1, 172) = 1.67, p = .19). Additionally, results showed a significant effect of the covariates on taste liking, F(1, 172) = 43.2, p = < .001). This means that taste liking is influenced by respondent’s taste preferences and being a smoker or not.
Taste complexity
As for the dependent variable ‘taste complexity’, an univariate ANOVA was conducted. This demonstrated no significant effect of verticality on taste complexity, F(1, 172) = .18, p = .68. Also, longitudinality showed no significant effect on taste complexity, (F(1, 172) = 1.13, p = .33. In this case, the covariates had no significant effect on taste complexity, F(1, 172) = .37, p = .55. Further, there is no significant main effect between the independent variables (verticality * longitudinality), F(1, 172) = .18
27
5.2 Perceived attractiveness of packaging
The influence of verticality cues in packaging seems to have no significant main effect on the perceived attractiveness of the packaging, (F(1, 172) = 2.33, p = .13. Also, longitudinality showed no significant effect on taste liking, F(1, 172) = 0.44, p = .64. The interaction effect between verticality * longitudinality was not significant, F(1, 172) = 0.15, p = .86.
5.3 Purchase intention
[image:27.595.71.475.430.621.2]Lastly, the effect of verticality cues in packaging on purchase intention was not statistically significant, F(1, 172) = .35, p = .56. Further analysis revealed no main effect of longitudinality on purchase intention, F(1, 172) = .004, p = .99. Thereby, there is no significant interaction effect (verticality * longitudinality) on purchase intention, F(1, 172) = .21, p = .81. However, there was a significant effect visible from the covariates on purchase intention, F(1, 172) = 18.58, p = < .001). This effect shows that purchase intention is influenced by taste preferences and smoker status.
Table 6. Results of the univariate ANOVA for all variables
Factor Verticality cues Longitudinally design Verticality * Longitudinality
F Sig. F Sig. F Sig.
Taste intensity .001 .97 .94 .39 1.77 .17
Taste liking .64 .43 .19 .83 1.67 .19
Taste complexity .18 .68 1.13 .33 .18 .84
Perceived attractiveness
2.33 0.13 .44 .64 .15 .86
28 Table 7. Mean scores per manipulation
Verticality Longitudinality
Factor Vertical
cues
Horizontal cues
Longitudinal Lateral Squared
Taste intensity M = 5.20
SD = .10 MSD = .10 = 5.20 MSD = .12 = 5.28 MSD = .12 = 5.08 MSD = .13 = 5.26
Taste liking M = 5.41
SD = .09 MSD = .09 = 5.31 MSD = .11 = 5.38 MSD = .11 = 5.39 MSD = .12 = 5.30 Taste complexity M = 3.34
SD = .41 MSD = .41 = 3.26 MSD = .17 = 3.50 MSD = .17 = 3.15 MSD = .18 = 3.24
Perceived attractiveness M = 3.83 SD = .16 M
= 4.17
SD = .15 M
= 4.11 SD = .19
M = 3.86 SD = .19
M = 4.03 SD = .19 Purchase intention M = 4.59
SD = .14 M = 4.70 SD = .13
M = 4.64 SD = .163 M
= 4.66 SD = .16
M = 4.65 SD = .17
5.4 Additional analyses
To see if there are significant main effects for congruent combinations (longitudinal conditions) a univariate ANOVA test was performed. This analyses showed no significant effect of congruence on the dependent variables. See table 8 for the mean scores per condition.
Table 8. Congruence between variables
Horizontal /
squared / squared Vertical / longitudinal Vertical Horizontal / lateral Vertical / lateral Horizontal / longitudinal
Taste intensity M = 5.20
SD = 1.00 MSD = .82 = 5.30 MSD = 1.12 = 5.11 MSD = 1.04 = 4.92 MSD = .77 = 5.23 MSD = .73 = 5.46 Taste liking M = 5.21
SD = 1.05 MSD = .90 = 5.37 MSD = .80 = 5.60 MSD = .78 = 5.40 MSD = 1.00 = 5.40 MSD = 1.09 = 5.12 Taste complexity M = 3.18
SD = 1.31 MSD = 1.26 = 3.31 MSD = 1.12 = 3.61 MSD = 1.42 = 3.21 MSD = 1.41 = 3.13 MSD = 1.10 = 3.37 Perceived
attractiveness MSD = 1.13 = 4.12 MSD = 1.51 = 3.92 SD = 1.51 M = 3.83 MSD = 1.46 = 4.06 MSD = 1.49 = 3.72 MSD = 1.33 = 4.34 Purchase intention M = 4.60
[image:28.595.44.557.515.755.2]29 5.5 Regression analysis
[image:29.595.72.524.212.521.2]A multiple regression was calculated to predict participants purchase intention based upon their taste intensity, taste liking, taste complexity and perceived attractiveness. The regression analysis, see table 9, showed that taste intensity, taste liking and perceived attractiveness have an effect on purchase intention. However, taste complexity have no significant contribution to predict purchase intention.
Table 9. Linear model of predictors of purchase intention. 95% confidence intervals reported in parentheses.
b SE B β p
Model 1
Constant -1.30
(-2.39, .21)
.55 .02
Taste intensity Taste liking Taste complexity .25 (.09, .41) .88 (.72, 1.03) -.01 (-.13, 1.00) .08 .08 .06 .18 .64 -0.1 < .001 < .001 0.83 Model 2
Constant -1.42
(-2.37, -.47) .48 0.1
Taste intensity .13
(-.01, .27)
.07 .09 .07
Taste liking Taste complexity Perceived attractiveness .76 (.63, .90) -.03 (-0.13, .06) 0.35 (.26, .44) .07 .05 .05 .55 -.03 .38 < .001 .49 < .001
Note. R2 = .47 for model 1: ΔR2 = .61 for step 2 (ps < .001)
Individually, taste intensity, t(167) = 1.83, p = .07 and taste complexity, t(167) = -.69, p = .49, are no significant predictors of purchase intention. On the other hand, taste liking, t(167) = 10.86, p = < .001, and perceived attractiveness ,t(167) = 7.31, p = < .001, are significant predicters of purchase intention. From the magnitude of the t-statistics, it can be seen that taste liking had more impact than perceived attractiveness.
30 5.6 Overview of hypotheses
Hypotheses Supported
H1a Packaging with vertical visual cues, as opposed to horizontal visual
cues, will positively influence consumer responses No
H1a Packaging with vertical visual cues, as opposed to horizontal visual cues, will lead consumers to experience the product taste as more intense.
H1b Packaging with vertical visual cues, as opposed to horizontal visual cues, will positively influence taste liking.
No
H1c Packaging with vertical visual cues, as opposed to horizontal visual cues, will lead consumers to experience the product taste as more complex.
No
H1d Packaging with vertical visual cues, as opposed to horizontal visual cues, will lead consumers to experience the product design as more attractive.
No
H1e Packaging with vertical visual cues, as opposed to horizontal visual
cues, will positively influence consumers’ purchase intention. No
H2 Longitudinality, as opposed to laterality, cues in packaging will
positively influence consumer responses No
H2a Longitudinality, as opposed to laterality, cues in packaging will lead
consumers to experience the product taste as more intense. No H2b Longitudinality, as opposed to laterality, cues in packaging will
positively influence consumers’ perceptions of taste liking. No
H2c Longitudinality, as opposed to laterality, cues in packaging will lead
consumers to experience the product taste as more complex. No H2d Longitudinality, as opposed to laterality, cues in packaging will lead
consumers to experience the packaging as more attractive. No H2e Longitudinality, as opposed to laterality, cues in packaging will
positively influence perceptions of consumers’ purchase intention.
No
H3 Congruency between verticality cues and longitudinality in packaging positively influences taste experiences, perceived attractiveness and purchase intention.
No
H4a Taste experience will have a contribution on purchase intention Yes
31
.
5. DISCUSSION AND CONCLUSION
.
5.1 Main findings
The aim of this study was to find out what impact verticality cues and longitudinality in packaging have on consumer’s taste evaluation and purchase intention. The focus was mainly on manipulating the taste intensity of the throat pastille, and subsequently the perceived taste complexity, taste liking, perceived attractiveness and purchase intention. Based on previous research, it was hypothesized that taste evaluations would be influenced by verticality (van Rompay et al., 2019). However, the effect of longitudinality in packaging has not been tested before.
This study did not find any significant effects for the relationship between verticality cues, horizontal cues, longitudinality, and/or laterality in packaging on the taste experience, perceived attractiveness and purchase intention.
The verticality cue manipulation did not have a significant effect on either taste experiences or perceived attractivenessand purchase intention. This in contrast to previous literature in the field of verticality, such as studies of van Rompay et al., (2019), van Rompay, Fransen, & Borgelink (2014), Machiels & Orth (2017) and Schubert (2005), where verticality evoked perceptions of power (taste intensity) and perceived attractiveness.
32 cues on perceived attractiveness. Though, it is remarkable that the horizontal scored higher than vertical condition. This can be explained by the fact that perceived attractiveness can be very personal. At last, the ratings of purchase intention were above average, with a little tendency to horizontal cues, but no significant effect could be detected. The fact that participants who saw the horizontal cues ranked higher, might be because of that horizontal cues are also perceived as more attractive. Perceived attractiveness is a strong determinant of purchase intention, which is explained later on.
Also, longitudinality did not have a significant effect on either taste experience or perceived attractiveness and purchase intention. Since no research was conducted before that measures the effect of longitudinality in designs, results of this study will enrich knowledge in this field. The results concerning the interaction effects demonstrates that the type of verticality cue in combinations with longitudinality (longitudinal, lateral or neutral packaging), had no significant effect on taste experience, perceived attractiveness and purchase intention. A possible explanation could be that the package was too small to experience the effect of longitudinality. When participants are exposed to a larger package, they will possible experience the effect of longitudinality more intense.
Remarkably, covariate ‘taste preferences’ showed a significant effect on taste intensity and taste liking. Participants that scored higher on the likeness of the taste mint did also rate the taste liking of the throat pastille more positive, because they have a positive feeling with this taste. When people do not like the taste of mint at all, they will evaluate the taste of the throat pastille less positive. Thereby, taste preferences also had an influence on the perceived taste intensity In other words, if you like the taste of mint, the intensity could be perceived less intense. This might be because the participant eats a lot of mint or intense products and is used to intense tastes.
33 and Weber stated that attractive designs trigger an immediate desire to purchase the product (2010). This is also visible in this study. When consumers evaluated the package as attractive, they are more willing to buy the product. Thus it can be concluded that when consumers have the opportunity to try the product before purchasing, the purchase intention is higher. Thereby, when a package is perceived as attractive the purchase intention most likely increases. Therefore, investigating in attractive packaging, for fast-moving consumer goods, is really important for companies to influence purchase intention.
5.2 Limitations and future research
As a reflection on the research, the limitations should be elaborated. The limitations have to be taken into account when considering recommendations that are derived from the research. This study adds value to the existing theoretical knowledge, especially of longitudinality, due to limited research in the field of longitudinality and its influence on consumer responses. Although, there was no research conducted before, hypotheses were based on assumptions.
At first, only Dutch respondents were recruited for this study, therefore the findings of this study cannot be generalized to other cultures than Western Europe. Due to the fact that the theory of the verticality perception (‘sky is the limit’) can be different across cultures. Moreover, respondents who participated in this study were mainly females between 36 – 45 years old. Findings of this study would be more representative if gender and age were equally distributed among the conditions.
34 the package, otherwise participants will realize that the experiment is about the packaging instead of the taste of the throat pastille. However, the limitation of less attention for the packaging might have an effect on the effectiveness of the manipulation. Furthermore, it has not been checked if the manipulated packaging were credible. The packaging were designed by a researcher and not by a designer. Therefore, participants could experience the packaging not professional or credible and that can influence their product evaluation. Conversely, the throat pastille, used in the experiment, is an existing throat pastille from the supermarket (Aldi). Participants might have recognized the taste, which could influence their opinion in a negative or positive way. For future research it is recommended that a professional packaging is used with a unknown, new throat pastille, in order to prevent a bias. Thereby, a more realistic shopping environment with a direct buying opportunity is recommended for future research, in order to draw better conclusions about the effect of packaging on purchase intention. Furthermore, in the study of van Rompay et al. (2019), participants were exposed to pictures of the packaging. However, in this study a real packaging was developed and showed to participants. This way of measuring might have been affected consumer responses since participants could have been influenced by cues other than the verticality manipulation (e.g. how the package feels or how credible it is, ingredients information on backside). Additionally, a relative small package is used in this study. It might be interesting to test the effect of verticality cues in combination with longitudinality in a somehow larger packaging, which might cause significant differences.
Another limitation is that the used taste stimuli in this study was a menthol throat pastille. The taste of this product is already intense. Therefore, an even more intense taste perception is hard to achieve through external manipulations. It would be interesting for future research to use a product with a more neutral taste, causing external manipulations (e.g. packaging) to have a stronger influence on taste evaluations.
Finally, the used designs in the pre-test all were in black and white. However, the contrast of the used designs differs, which might influence the perception of a strong package. It could be interesting for future research to test the effects of verticality in combinations with color on consumer responses. For more future research into the effect of verticality in packaging, it could be interesting to use package designs with suggestions of movement instead of static stripes, in order to influence taste intensity perception.
35 and possible intensity perception, when respondents do a taste test. Verticality can also be implemented in smell. An intense smell can be implemented in the supermarket in order to influence the taste intensity perception. Another suggestion is to implement verticality in spatial high. For example, the manipulated product high placed in the product shelf might be experienced more intense instead of a product placed low in a product shelf. Another idea is to ask people to stand on a stair during the taste test. It might be that people standing high on the stair would experience the taste more intense rather than people lower on the stair. Further, it could be interesting to put the advertisement poster high on the wall. Participants that do a taste test and evaluate the advertisement high on the wall (and look up) might be influenced more positively instead of participants who see the advertisement low on the wall (and loop down). This effect is also described by Lakoff and Johnson, which stated that high power equals up (1980), At least there are still enough options to test the effect of verticality on consumer responses, which might be interesting for companies to investigate.
5.3 Practical implications
Knowing that companies deal with a lot of competitors in the marketplace by reaching the consumer (Creusen & Schoorman, 2005; Krishna, Cian & Aydinoglu, 2017), packaging is really important, because this is the first contact companies have with their audience. The results of this study are of great value for companies and marketers and yield some interesting results in the area of purchase intention. The findings of this study suggest that taste evaluations and perceived attractiveness of packaging are important determinant of purchase intention. However, taste experience for new products is hard to evaluated without tasting the product. Therefore, it could be interesting to let consumer try the product for free in the supermarket, because a positive taste evaluation will influence their purchase intention. Furthermore, investing in an attractive package can positively influence purchase intention. Especially this effect can be of great importance for marketers who are responsible for sales optimization. However, companies should place the results of this study in the right context. This study was performed with low-involvement products. An attractive package might not have the same contribution on purchase intention when exposed to a high-involvement product.
5.4 Conclusion
37 .REFERENCES.
Aamin, M., Imran, M., Abbas, N., & Rauf, U. (2015). Impact of the product packaging on the consumer buying behavior. Journal of Marketing and Consumer Research, 16. 59-64.
Abadio Finco, F.D.B., Deliza, R., Rosenthal, A., & Silva, C.H.O. (2009). The effect of extrinsic product attributes of pineapple juice on consumer intention to purchase. Journal of International Food & Agribusiness Marketing, 22. 125-142.
Ares, G., & Deliza, R. (2010). Studying the influence of package shape and colour on consumer expectations of milk desserts using word association and conjoint analysis. Food Quality and Preference, 21. 930-937.
Becker, L., Van Rompay, T.J.L., Schifferstein, H.N.J., & Galetzka, M. (2011). Tough package, strong taste: The influence of packaging design on taste impressions and product evaluations. Food Quality of Preference, 22. 17-23.
Bernués, A., Olaizola, A., & Corcoran, K. (2003). Extrinsic attributes of red meat as indicators of quality in Europe: an application for market segmentation. Food Quality and Preference, 14 (4). 265-276.
Bloch, P. H. (1995). Seeking the ideal form: Product design and consumer response. Journal of Marketing, 59(3), 16–29.
Bloch, P.H., Brunel, F.F., & Arnold, T.J. (2003). Individual differences in the centrality of visual product aesthetics: concept and measurement. Journal of Consumer Research, 29 (4). 551-565.
Bruner, G.C. (2012). Marketing scales handbook. GCBII Productions. Fort Worth, Texas USA (volume 6).
Cardello, A.V. (1994). Consumer expectations and their role in food acceptance. In measurement of food preferences. 253-297. Boston, MA: Springer
Celhay, F., & Trinquecoste, J.F. (2014). Package graphic design: investigating the variables that
moderate consumer response to atypical designs. Journal of Product Innovation Management, 32 (6). 1014-1032.
Centraal Bureau Statistiek. (2017). Standaard onderwijsindeling 2016. Retrieved on 06-06-2019,
https://www.cbs.nl/nl-nl/onze-diensten/methoden/classificaties/onderwijs-en-beroepen/standaard-onderwijsindeling--soi--
Chen, J., & Engelen, L. (2012). Food Oral Processing: Fundamentals of Eating and Sensory Perception. Hoboken, NJ: John Wiley & Sons.
Chen, H. & Huang, K. (2018). Consumer-driven design approach based on multiple psychological responses to product form. Journal of Integrated Design and Process Science. 1-15.
Cho, H., & Schwarz, N. (2010). I like those glasses on you, but not in the mirror: fluency, preference, and virtual mirrors. Journal of Consumer Psychology, 20. 471-175.
38 Cian, L., Krishna, A. & Elder, R.S. (2014). This logo moves me: Dynamic imagery from static images.
Journal of Marketing Research, 184–197
Cian, L. (2016). The conceptual effects of verticality in designs. The psychology of design: creating consumer appeal. New York, USA, Routledge.
Creusen, M.E.H., & Schoormans, J.P.L. (2005). The different roles of product appearance in consumer choices. Journal of Product Innovation. 2-8.
Dahlén, M., Lange, F., Sjödin, H., & Törn, F. (2005). Effect of ad-brand incongruence. Journal of Current Issues & Research in Advertising, 27(2). 1-12.
Deng, X., & Kahn, B.E. (2009). Is your product on the right side? The “location effect” on perceived product heaviness and package evaluation. Journal of Marketing Research, 46 (6). 725-738.
Fandos, C., Flavian, C. (2006). Intrinsic and extrinsic quality attributes, loyalty and buying intention: an analysis for a PDO product. British Food Journal, 108 (8). 646-662
Fenko, A., Backhaus, B. W., & van Hoof, J. J. (2015). The influence of product-and person-related factors on consumer hedonic responses to soy products. Food Quality and Preference, 41, 30- 40.
Hekkert, P. (2006) Design aesthetics: principles of pleasure in design. Psychology Science, 48(2). 157.
Ikeda, K. (2002) New seasonings. Chemical senses., 27 (9), 847-849
Krishna, A. (2012). An Integrative review of sensory marketing: Engaging the senses to affect perception, judgment and behaviour. Journal of Consumer Psychology, 22, 332-351.
Krishna, A., Cian, L., & Aydinogly, N.Z. (2017) Sensory aspect of package design. Journal of Retailing, 93(1). 43-54
Lakoff, G., & Johnson, M. (1980). Metaphors we live by. The University of Chicago press, Ltd., London.
Lidón, I., Rebollar, R., Gil-Pérez, I., Martin, J., & Vicente-Villardón, J.L. (2018). The influence the image of the product shown on food packaging labels has on product perception during tasting: Effects and gender differences. Packaging Technology and Science, 31 (10). 689-697.
Machiels, C.J.A., & Orth, U.R. (2017). Verticality in product labels and shelves as a metaphorical cue to quality. Journal of Retailing and Consumer services, 37. 195-203.
Meier, B.P., & Dionne, S.G. (2009). Downright sexy: verticality, implicit power, and perceived physical attractiveness. Social Psychology Commons. 883-892.
Morwitz, V. (2014). Consumers’ purchase intention and their behavior. Foundations and Trends in Marketing, 7 (3). 181-230.
Park, C.W., Eisingerich, A.B., Pol, G., & Park, J.W. (2014). The role of brand logos in firm performance.
39 Reber,R., Schwarz, N., & Winkielman, P. (2004). Processing fluency and aesthetic pleasure: Is beauty in
the perceiver’s processing experience? Personality and Social Psychology Review, 8(4). 364-382.
Reimann, M., Zaichkowsky, J., Neuhaus, C., Bender, T., & Weber, B. (2010). Aesthetic package design: a behavioral, neural and psychological investigation. Journal of Consumer Psychology, 20 (4). 431-441.
Russel, C.A. (2002). Investigating the effectiveness of product placements in television shows: The role of modality and plot connection congruence on brand memory and attitude. Journal of Consumer Research, 29(3). 306-318.
Ryynänen, T., & Hakatie, A. (2012). Low-involvement, low price and low quality image renegotiated – a case study of staple food package design. Retail, Distribution and Consumer Research, 23 (2).
204-219.
Schoormans, J.P.L., & Robben, H.S.J. (1997). The effect of new package design on product attention, categorization and evaluation. Journal of Economic Psychology, 18. 271-287.
Schubert, T.W. (2005). Your highness: vertical positions as perceptual symbols of power. Journal of Personality and Social Psychology, 89. 1-21
Smets, G.J.F., & Overbeeke, C.J. (1995) Expressing tastes in packages. Design Studies, 16. 349-365.
Tanner, J.F., & Raymond, M. (2013). Principles of marketing. 9780982361825
Van den Bosch, A.L.M. & De Jong, M.D.T., & Elving, W.J.L. (2006). Exploring the differences between manufacturing and service, and profit-making and non-profit organizations. Journal of Business Communication, 43, 138-157.
Van Doorn, G., Woods, A., Levitan, C.A., Wan, X., Velasco, C., Bernal-Torres, C., & Spence, C. (2017). Does the shape of a cup influence coffee taste expectations? A cross-cultural, online study.
Food Quality and Preference, 56. 201-211.
Van Grinsven, B. & Das, E. (2016). Logo design in marketing communications: Brand logo complexity moderates exposure effects on brand recognition and brand attitude. Journal of Marketing Communications, 22, 256-270.
Van Ooijen, I. (2016). Packaging design as communicator of product attributes: Effects on consumers’ attribute inferences (Research conducted at: University of Amsterdam). Retrieved from https://ris.utwente.nl/ws/portalfiles/portal/47694357
Reber, R., Schwarz, N., & Winkielman, P. (2004). Processing fluency and aesthetic pleasure: is beauty in the perceiver’s processing experience? Personality and Social Psychology Review, 8(4). 364-382.
Van Rompay, T.J.L., Fransen, M,L., & Borgelink, B.G.D. (2014) Light as a feather: effects of packaging imagery on sensory product impressions and brand evaluation.
Marketing Letters, 25 (4), 397-407
Van Rompay, T.J.L., van Hoof, J.J., Rorink, J., & Folsche, M. (2018). Served straight up: effects of verticality cues on taste evaluations and luxery perceptions.
40 Van Rompay, T.J.L., De Vries P.W., Bontekoe, F., & Tanja-Dijkstra, K. (2012). Embodied product
perception: effects of verticality cues in advertising and packaging design on consumer impressions and price expectations. Psychology & Marketing, 29 (12), 919-928
Van Rompay, T.J.L., & Pruyn, A.T. (2011) When visual product features speak the same language: Effects of shape-typeface congruence on brand perception and price expectations. Journal of Product Innovation Management, 28(4). 599-610
Veryzer, R.W. (2010). Design and consumer research. Design Management Journal, 1. 64-73.
Westerman, S.J., Sutherland, E.J., Gardner, P.H., Baig, N., Critchtley, C., Hickey, S., Mehigan,S., Solway, A., & Zervos, Z. (2013). The design of consumer packaging: Effects of manipulations of shape, orientation, and alignment of graphical forms on consumers’ assessments. Food Quality and Preference, 27. 8-17
Winkielman, P., Schwarz, N., Reber, R., & Fazendeiro, T.A. (2000). Affective and cognitive
41
[image:41.595.70.479.155.371.2]Appendix A. Results pre-test 1.
Table 10. Mean scores vertical cues
Table 11. Mean scores horizontal cues
Strong Powerful Intens Fresh Total score
Design A M = 2.18 SD = 1.29
M = 1.76 SD = 1.06
M = 2.41 SD = 1.46
M = 3.41 SD = 1.29
M = 2.44
Design B M = 2.76 SD = .73
M = 3.00 SD = 1.14
M = 2.94 SD = .80
M = 2.88 SD = .90
M = 2.90
Design C M = 2.76 SD = 1.21
M = 3.29 SD = .96
M = 2.88 SD = 1.37
M = 2.65 SD = 1.03
M = 2.90
Design D M = 3.29 SD = 1.27
M = 2.88 SD = 1.37
M = 3.18 SD = 1.29
M = 4.12 SD = 1.28
M = 3.37
Design E M = 4.00 SD = 1.68
M = 4.06 SD = 1.43
M = 3.59 SD = 1.72
M = 1.94 SD = 1.47
M = 3.40
Strong Powerful Intens Fresh Total score
Design A M = 2.00 SD = 1.04
M = 1.92 SD = 0.92
M = 2.23 SD = 1.12
M = 2.62 SD = 1.15
M = 2.19
Design B M = 2.54 SD = .93
M = 2.31 SD = .82
M = 2.31 SD = 1.04
M = 2.23 SD = .80
M = 2.35
Design C M = 3,08 SD = .83
M = 3,08 SD = 1.00
M = 2.92 SD = 1.07
M = 2.92 SD = 1.27
M = 3.00
Design D M = 2.92 SD = 1.69
M = 3.00 SD = 1.36
M = 3.15 SD = .95
M = 3.69 SD = 1.49
M = 3.19
Design E M = 4.46 SD = 1.08
M = 4.49 SD = 1.07
M = 4.69 SD = 1.07
M = 3.54 SD = 1.65
[image:41.595.71.484.412.625.2]42 Table 12. Mean scores vertical cues
Table 13. Mean scores horizontal cues
Weak Savorless Boring Mild Total score
Design A M = 3.54 SD = 1.39
M = 3.69 SD = 1.32
M = 3.31 SD = 1.07
M = 2.62 SD = .84
M = 3.29
Design B M = 3.46 SD = 1.01
M = 3.31 SD = .91
M = 3.62 SD = 1.00
M = 3.38 SD = 1.00
M = 3.44
Design C M = 3.23 SD = .80
M = 3.00 SD = 1.04
M = 3.54 SD = 1.08
M = 3.77 SD = 1.12
M= 3.39
Design D M = 2.77 SD = 1.42
M = 3.38 SD = 1.27
M =2 .92 SD = 1.38
M = 3.31 SD = 1.59
M = 3.10
Design E M = 2.00 SD = 1.66
M = 1.62 SD = 1.44
M = 1.62 SD = 1.44
M = 1.92 SD = 1.54
M = 1.79
Weak Savorless Boring Mild Total score
Design A M = 3.65 SD = 1.37
M = 3.76 SD = 1.52
M = 3.35 SD = 1.45
M = 2.65 SD = 1.53
M = 3.35
Design B M = 3.18 SD = .71
M = 3.12 SD = .96
M = 3.65 SD = .97
M = 3.29 SD = .89
M = 3.31
Design C M = 3.06 SD = 1.21
M = 2.88 SD = 1.13
M = 2.29 SD = 1.18
M = 3.59 SD = 1.03
M = 2.96
Design D M = 3.41 SD = 1.24
M = 3.29 SD = 1.18
M = 3.82 SD = 1.25
M = 3.29 SD = 1.49
M = 3.45
Design E M = 1.71 SD = 1.52
M = 1.94 SD = 1.51
M = 1.88 SD = 1.45
M = 2.18 SD = 1.50
[image:42.595.72.486.388.600.2]