Analysis of Growth Behavior of a Cellular and Dendritic Interface under
a Constrained Growth Condition using a Phase-Field Model
Yukinobu Natsume
*, Kenichi Ohsasa
1, Hisao Esaka
2and Toshio Narita
1 1Faculty of Engineering, Hokkaido University, Sapporo 060-8628, Japan
2Department of Materials Science & Engineering, National Defense Academy, Yokosuka 239-8686, Japan
A phase-field simulation was carried out to investigate the growth behavior of a cellular and dendritic interface of an Fe–C binary alloy in a constrained growth condition. The simulated results were in good agreement with the experimental results. The effect of the magnitude of anisotropy at solid/liquid interface energy was examined, and it was found that the magnitude of anisotropy affected the growth direction when the growth rate was low. Dimensionless growth direction,0, was used to examine the obtained results, and it was found that0increases from
zero and approaches unity with increase in growth velocity. A good correlation was obtained between calculated growth velocity and growth direction by using dimensionless growth velocity (V=Vc), and this correlation was in agreement with the experimental results.
(Received November 21, 2002; Accepted February 5, 2003)
Keywords: cell, dendrite, growth direction, phase-field, heat flow, solidification, anisotropy
1. Introduction
The mechanism of ‘grain selection’ plays an important role in fabrication of single crystal products using a unidirectional solidification technique such as turbine blades.1) Although single crystal products have been skillfully made by using grain selection, the mechanism of the grain selection has not been elucidated, and a trial and error method is required to make these products. To understand the mechanism of grain selection, the relation between growth direction of cells or dendrites and solidification condition should be elucidated.
It is well known that the growth direction of cells or dendrites is determined by the preferred growth direction and heat flow in a constrained growth condition. Kurz and Fisher2)described the growth directions of dendrites and cells found in normal cubic metals, the preferred growth direction of which is h100i, in the case of constrained growth. Columnar dendrites grow in their preferred growth direction, h100i, regardless of the direction of heat flow. On the other hand, cells grow in the heat flow direction regardless of their preferred growth direction. However, they did not give the reason for the change in growth direction during the transition from cells to dendrites.
In our previous work,3)in situobservation using succino-nitrile (SCN) was performed, and the relation between growth velocity and growth direction of cells and dendrites was obtained. In the experiments, effects of both heat flow and preferred growth direction on either growth of cells or dendrites were observed. In addition, simulations using a phase-field model of an Fe–C binary alloy were carried out to interpret the experimental results, and the simulated results qualitatively agreed with the experimental results. However, since phase-field calculation requires a long CPU time, simulation in previous study has been carried out under a non-steady state growth condition, whereas experiments have been carried out under a steady state condition. In addition, it is expected that the degree of anisotropy of materials influences the growth behavior of cells and dendrites;
however, the effect of anisotropy has not been examined yet. In the present study, the growth behavior of a cellular and dendritic interface in a constrained growth condition was simulated under a steady state condition using a phase-field model, and the results obtained were compared with experi-mental results. The effect of the magnitude of anisotropy on growth direction of cells and dendrites was also investigated.
2. Simulation Method
2.1 Phase-field model
In the present simulation, the phase-field model proposed by Kim et al.4,5) was used. Since the model has been described in detail in our previous paper,3) only a brief description of the model will be given here. The governing equations of the phase-field model for an alloy are as follows:
@
@t ¼ Mð"
2
r2fÞ; ð1Þ
@c
@t ¼ r DðÞ
fcc rfc
; ð2Þ
wherefðc; Þis free energy density of a solid/liquid mixture,
DðÞ is the solute diffusion coefficient, M is a phase-field parameter related to kinetics, and"is a phase-field parameter related to interfacial energy and is expressed as
"ðÞ ¼"ð1þcos 4Þ; ð3Þ
where is the angle between the normal of a solid/liquid interface and the x-axis, andis the magnitude of anisotropy (called anisotropy parameter).
2.2 Calculation procedure
In the simulation, the calculation domain was divided into uniform square grids, and eqs. (1) and (2) were changed to explicit finite difference forms and numerically solved. An Fe–0.2 mass%C binary alloy was used as the target material, as it was in our previous study.3)The physical properties and thermodynamical data of the Fe–C binary alloy6)used in the present simulation are shown in Tables 1and2, respectively. The phase-field parameters used in the simulation were set as
*Graduate Student, Hokkaido University.
Special Issue on Solidification Science and Processing for Advanced Materials
a function of temperature, as they were in our previous study.3)
The calculation domain was divided into 4002000 square grids, each 0.02mmin size. To simulate a cellular and dendritic interface, the initial condition shown in Fig. 1was adopted. The boundary condition in the calculated domain was that the concentration gradient of the solute was zero. In addition, a time-saving calculation technique by which the calculation was not carried out for all grids but only for some grids in a certain region containing the solid/liquid interface was used to simulate the growth of cells or dendrites under a steady state condition. The calculation region in the growth direction (X-axis direction) contains hundreds of grids on either side of the interface. The calculation region was moved with change in the position of the solid/liquid interface. In the case of high growth velocity, 400 (the center being the solid/ liquid interface) grids in the x-axis direction were selected for
the calculation, and in the case of low growth velocity, 800 grids were selected because the diffusion boundary layer in front of the solid/liquid interface changes depending on the growth velocity. The calculated domain in a 2-dimensional condition consists of 400400 and 800400 grids. The calculation time for this domain was only 1/2 or 1/3 of that in the case of calculating all grids. To confirm the validity of the time-saving technique, the results of calculation were compared with the results obtained by calculating all of the grids. It was found that the coarsening process proceeds at the roots of dendrites and cells in the case of calculating all of the grids more than it dose in the case of using the time-saving technique. However, the same morphology and growth behavior of the tips of cells and dendrites were observed.
A certain positive temperature gradient was imposed in the calculation domain, and all of the grids were set to be solid at
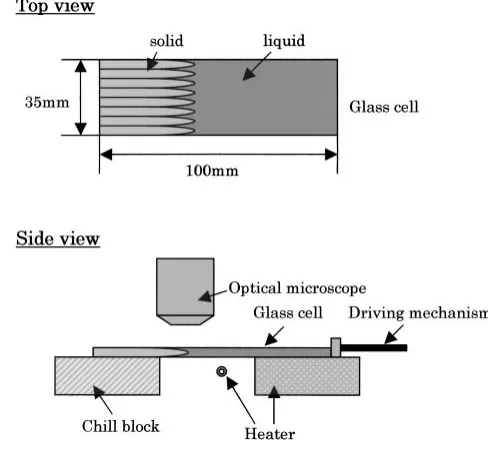
x¼0as an initial condition. The preferred growth direction was the x-axis direction, and the tilted angle between heat flow and preferred growth direction was set to be about 18.43 degrees (¼arctanð1=3Þrad.). In the calculation, the heat transfer equation was not explicitly calculated, and the effect of temperature gradient was involved by changing the free energy densities and the phase-field parameter as a function of temperature. The temperature profile was moved in the heat flow direction at a certain constant velocity to emulate the real experimental conditions. A schematic illustration of the experimental apparatus using succinonitrile is shown in Fig.2, and the experimental procedure has been described in detail in our previous paper.3) The simulated experimental conditions are shown in Table3.
[image:2.595.50.289.84.159.2]To investigate the effect of anisotropy,, in eq. (3), three values of the anisotropy parameter, 0.03, 0.04 and 0.05, were examined. It is known that the anisotropy parameter in eq. (3) must be less than 1/15, and the three values of the anisotropy parameter were set to be less than 1/15. As a result, it was confirmed that dendrite morphology can be produced with the anisotropy parameter in the above range.7)
Table 1 Physical properties of Fe–C binary alloy. Diffusion coefficient of liquid,DL(m2/s) 2:0108
Diffusion coefficient of solid,DS(m2/s) 6:0109
Interface energy,(J/m2) 0.204
Partition coefficient,ke 0.196
Slope of liquidus line (K/mol fra.) 1932:9
[image:2.595.300.544.537.762.2]Melting point of Fe (K) 1810
Table 2 Thermodynamic data ofcrystal and liquid phase of Fe–C binary alloy.
G¼ ð1xÞG
FeþxG
Cþ ½xlnðxÞ þ ð1xÞlnð1xÞ þxð1xÞ½L0þ ð12xÞ(J/mol)
Gbcc Fe ¼0
Gbcc
C ¼14685814:644T
GFeliq¼13807:27:6316T
GCliq¼11422327:196T
Lbcc
0 ¼ 6548033:451T
Lbcc
1 ¼303344:372T
Lliq0 ¼ 123846:5þ29:7485T Lliq1 ¼32216:519:2045T
Fig. 1 Schematic illustration of calculation condition.
[image:2.595.50.545.537.776.2] [image:2.595.54.288.570.769.2]3. Results and Discussion
3.1 Results of calculation and comparison with
experimental results
Figure3 shows the calculated solid/liquid interface mor-phology and microsegregation patterns of the solute during solidification of the Fe–0.2 mass%C alloy in a steady state condition. The gray scale in each of the figures corresponds to the carbon content. Figures 3(a), (b), (c) and (d) show the calculated growth morphology of cellular and dendritic interfaces whose growth velocities are 9:5103, 3:8102,1:0101 and1:9101m/s, respectively. In the case of a cellular interface growing at a low velocity (see Figs. 3(a) and (b)), the growth direction deviates from the preferred growth direction to the heat flow direction. On the other hand, in the case of a cellular and dendritic interface growing at a high velocity (see Figs.3(c) and (d)), the effect of heat flow on the growth direction is slight. The morphology of cell tips becomes sharp toward the preferred growth direction with increase in growth velocity. To estimate the degree of deviation, dimensionless growth direction, 0 defined in our previous paper3) was used.
Dimensionless growth direction,0is defined as follows:
0¼=; ð4Þ
whereis the angle between heat flow direction and growth direction, andis the angle between heat flow direction and preferred growth direction. The growth direction was determined by tracking a growing cell or dendrite tip after steady state growth had been achieved.
The calculated relation between0and growth velocity at
G¼1:58106K/m is shown in Fig.4. Since the growth behavior in the period of initial solidification is not in a steady state,0was measured from the growth morphology in
the later stage. The dimensionless growth direction, 0, increased with increase in growth velocity and approached unity at a higher value of growth velocity. Although it is difficult to make a direct comparison of the results of the calculation and experiment due to the difference between the experimental system and the calculation system used, the tendency in calculated results agrees with that in the experimental results.3)
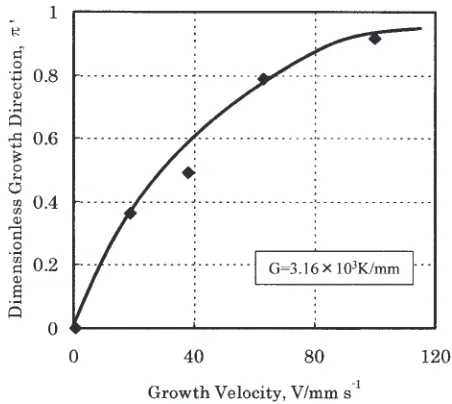
Figure5 shows the relationship between growth velocity and dimensionless growth direction,0atG¼3:16106K/ m. The value of0increases with increase in growth velocity,
Fig. 3 Calculated concentration profiles during solidification of Fe– 0.2 mass%C alloy at G¼1:58103K/mm. (a) V¼9:5mm/s
(b)V¼38:0mm/s (c)V¼100:0mm/s (d)V¼190:0mm/s.
[image:3.595.44.543.79.342.2]Fig. 4 Relation between growth velocity and dimensionless growth direction obtained atG¼1:58103K/mm in the simulation.
Table 3 Experimental conditions.
Temperature gradient,G(K/mm) Growth velocity,V(mm/s) 2.81 0.5, 0.9, 1.8, 2.5, 3.6, 5.4, 7.2, 9.0, 10.8 5.51 0.6, 0.9, 1.9, 2.7, 3.6, 5.4, 7.2, 9.0, 10.8 7.37 0.9, 1.8, 2.5, 3.5, 5.3, 7.2, 9.0, 10.8
[image:3.595.47.313.85.330.2] [image:3.595.306.544.89.365.2] [image:3.595.312.538.556.758.2]like the results shown in Fig.4, but the curve of0in Fig.5 rises more gradually than that in the case of
G¼1:58106K/m shown in Fig.4. These results also agree with the tendency obtained from the experimental results.3)
3.2 Dimensionless growth direction
Figure6 shows the relationship between normalized growth velocity, (V=VC), and 0obtained by an experiment using SCN.3) Here, VC is the critical velocity for breaking down a planar interface and is expressed as follows:
VC¼
kDG
mC0ð1kÞ; ð5Þ
wherekis the equilibrium partition coefficient,mis the slope of the liquidus line, andDis the diffusion coefficient of solute in the liquid. In the experiment, 0 increased sharply with increase inV=VCuntil it reached approximately 0.8. When0 exceeded 0.8, it increased gradually with increase in V=VC and approached unity. The experimental data obtained from three sets of temperature gradient are found to fall on a unique curve.
Figure7 shows the relationship between V=VC and 0 obtained in this simulation. The value of0increased sharply with increase inV=VCand approached unity as was obtained in the experiment. The calculated data obtained from two sets of temperature gradient may be also found to fall on a unique curve. However, the results of calculation shown in Fig.7are not exactly the same as the experimental results shown in Fig.6. The reason for this difference may be the different alloy systems and different solidification conditions used in the calculation and experiment.
The relation between0andVmay depend on the value of anisotropy of the material. Therefore, the effect of anisotropy was examined. The value of the anisotropy parameter,, used in the simulation for which results are shown in Figs.3to5 and7was 0.04.
3.3 Effect of anisotropy on growth direction
In general, the value of in eq. (3) was empirically determined so as to produce appropriate dendrite morphol-ogy,8,9)however, it is not clear how the anisotropy parameter can be concerned with the anisotropy of interfacial en-ergy.10,11)In the present study,7)three values of(0.03, 0.04 and 0.05) were used and the effect of anisotropy on growth direction was examined.
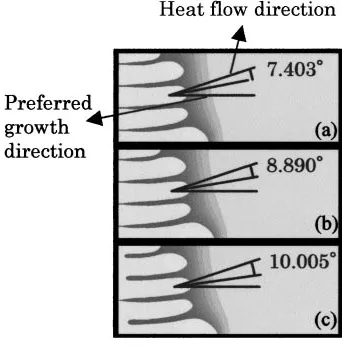
Figure8 shows the calculated solid/liquid interface mor-phology and microsegregation pattern of the solute during unidirectional growth of the Fe–0.2 mass%C alloy for different values of the anisotropy parameter, (a) 0.03 (b) 0.04 and (c) 0.05, at G¼1:58106K/m and
V ¼9:5103m/s. As can be seen in the figure, the growth direction of cells is influenced by the magnitude of the anisotropy parameter, and the cellular interface deflects toward the heat flow direction with a large angle when the magnitude of anisotropy becomes small.
Fig. 6 Relation between normalized growth velocity and dimensionless growth direction obtained in the experiment.
Fig. 7 Relation between normalized growth velocity and dimensionless growth direction obtained in the simulation.
Fig. 8 Calculated concentration profiles during solidification of the Fe– 0.2 mass%C alloy for different values of the anisotropy parameter at
G¼1:58103K/mm and V¼9:5mm/s. (a) ¼0:03 (b) ¼0:04
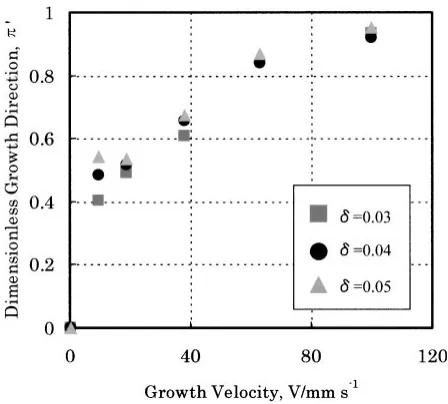
[image:4.595.314.540.73.271.2] [image:4.595.55.280.556.758.2] [image:4.595.340.511.568.741.2]Figure9 shows the relationship between 0 and growth velocity for different value of the anisotropy parameter. The magnitude of anisotropy had a marked influence on the growth direction in the low growth velocity region. However, the effect of anisotropy in the high growth velocity region was small. A marked effect of the magnitude of anisotropy on growth direction was observed in the deflection behavior of dendrites due to fluid flow even in the case of high growth velocity.7)In addition to the condition without fluid flow, the reason for this may be the steady state condition used in the present study. In any case, the tendency for 0 to increase with increase in growth velocity is similar for all values of and agrees with the experimental results.
4. Conclusions
Phase-field simulation was carried out to investigate the growth behavior of a cellular and dendritic interface of an
Fe–C binary alloy in a constrained growth condition. In the simulation, a steady state condition was set up during the growth of cellular and dendritic interface by using a calculation technique. Deviation from the preferred growth direction to the heat flow direction was observed in the case of a cellular interface, whereas the dendritic interface grew in its preferred growth direction. The results of simulation were in good agreement with the experimental results. The effect of magnitude of anisotropy at the solid/liquid interface used in the phase-field simulation was examined, and it was found that the magnitude of anisotropy has a marked effect on growth direction when the growth rate is low.
The results obtained from both the simulation and the experiment are summarized as follows:
(1) Dimensionless growth direction,0, increase from zero and approaches unity with increase in growth velocity. (2) By introducing the dimensionless growth velocity (V=Vc), a good correlation described with a unique line was obtained between growth velocity and growth direction.
REFERENCES
1) M. Durand-Charre: The Microstructure of Superalloys, Amsterdam, (Gordon and Breach Science Publishers, 1997) 53–66.
2) W. Kurz and D. J. Fisher: Fundamentals of Solidification, Aeder-mannsdorf, Switzerland, (Trans Tech Publisher, 1984) 65–96. 3) H. Esaka, H. Daimon, Y. Natsume, K. Ohsasa and M. Tamura: Mater.
Trans.43(2002) 1312–1317.
4) S. G. Kim, W. T. Kim and T. Suzuki: Phys. Rev. E58(1998) 3316– 3323.
5) S. G. Kim, W. T. Kim and T. Suzuki: Phys. Rev. E60(1999) 7186– 7197.
6) L. Kaufman and H. Nesor: Calphad2(1978) 295–318.
7) Y. Natsume, K. Ohsasa and T. Narita: Mater. Trans.43(2002) 2228– 2234.
8) J. S. Lee and T. Suzuki: ISIJ Int.39(1999) 246–252. 9) R. Kobayashi: Physica D63(1993) 410–423.
10) S. C. Huang and M. E. Glicksman: Acta Metall.29(1981) 701–715. 11) S. C. Huang and M. E. Glicksman: Acta Metall.29(1981) 717–734. Fig. 9 Relation between growth velocity and dimensionless growth
[image:5.595.56.280.70.272.2]