Kozak (2004) investigated nonsequential yield component analysis and proposed a parameter and its estimator of influence of yield components on yield; nonsequential components are such compo-nents that are co-related and develop at the same time during the plant ontogenesis. The parameter takes into account a specific multiplicative form of the relationship between yield and its compo-nents. It measures effects of components on yield, providing an estimated average yield in response to a change in a particular component, assuming the other components are fixed.
The results by Kozak (2004) as well as those re-ported in this paper do not pertain to the situation in which yield components develop sequentially
(e.g. Dofing and Knight 1992, García del Moral et al. 2003), but to what is called the non-sequantial development of yield components. Therein, yield components co-develop, making none of them a cause or an effect of another. This is why we call the methodology to analyze such a situation “nonsequential yield component analysis” (NYCA) to distinguish it from yield component analysis for the sequential case, which is sometimes called the sequential yield component analysis (SYCA) (e.g. McArthur and Eaton 1988). The paper by Kozak (2004) represented theoretical work on NYCA, focusing on deriving an appropriate expression for direct effects (parameter as well as its estimator), and comparing, theoretically and via simulation
INFORMATION
Applying statistics for nonsequential yield component analysis
M. Kozak
1, S. Samborski
2, M.S. Kang
3, J. Rozbicki
21
Department of Biometry, Warsaw Agricultural University, Warsaw, Poland
2Department of Agronomy, Warsaw Agricultural University, Warsaw, Poland
3Punjab Agricultural University, Ludhiana, India
ABSTRACT
In the paper, an application of the methodology for analyzing yield as affected by its components that develop at the same ontogenetic level is discussed; it may also be applied to any model in which several traits developing non-sequentially affect their product. The methodology is called “nonsequential yield component analysis”. Two applications are presented; the proposed approach is compared with path analysis, commonly applied for yield component analysis, and Piepho’s approach. In one example, grain yield of two cultivars of winter triticale (× Triti-cosecale Wittmack), Fidelio and Bogo, as affected by harvest index and biomass yield, was studied; the results of the three approaches compared were similar. However, in the study of nitrogen uptake as affected by nitrogen-uptake efficiency and crop nitrogen supply (the problem for which yield component analysis may be applied because of the underlying multiplicative model), the results of the methods were different. For both cultivars, path analysis and Piepho’s method showed a much stronger influence of crop nitrogen supply on nitrogen uptake than that of nitro-gen-uptake efficiency. In the proposed method, however, both these component traits influenced nitrogen uptake to a similar extent. The proposed method is shown to be methodologically better than the other approaches, and to provide different results in some situations. Hence, the new method should be used for nonsequential yield compo-nent analysis although it is suggested that path analysis may be applied if the determination coefficient of the linear model is close to 100%.
studies, the results with those obtained using path analysis. He presented some statistical properties of the estimator. His work laid the foundation for further investigations focusing on practical aspects of yield component analysis, including proper application and interpretation.
The method proposed by Kozak (2004) is very useful in agronomy and plant breeding to show the importance of yield components in determining yield. It has been recently applied by Pieskovski (2005). The aim of this paper is to demonstrate the usefulness of the method using two examples. The first one relates to winter triticale (×Triticosecale
Wittmack) grain yield and its two components, harvest index (HI) and total aboveground biomass yield. In the second one, we study the effect of N-uptake efficiency and crop nitrogen supply on nitrogen uptake. It is to be underlined that most yield component analyses have been done with the use of a linear model so far (for example, path analysis; e.g. Dewey and Lu 1959, Kang and Seneta 1980), and this paper, along with other papers on yield component analysis (e.g. Sparnaaij and Bos 1993, Piepho 1995, Kozak 2004, Kozak and Mądry 2006), shows that there are other approaches than a linear model, usually more appropriate from the theoretical point of view, that can be applied to yield component analysis.
Yield component model
Yield component model represents the reaction of a so-called complex trait (Sparnaaij and Bos 1993) to its components, of which it is a product:
(1)
where: Y is the complex trait (usually yield) and Xi, i = 1, …, k, are its components
From Eq. (1), it follows that the yield component model is multiplicative and has no error term. It is assumed that the model (1) must apply for each sample unit, that is, for a particular sampling unit (e.g. plot or plant) multiplying component values must give the corresponding yield value (Kozak and Mądry 2006). For this reason, one of the com-ponents is usually calculated based on values of yield and the remaining components.
The multiplicative nature of the model (1) ren-ders interpretation more complicated than for example a linear model. First, lack of an error term makes Y to be completely determined by Xs. Furthermore, interpretation of influences of Xs on
�
� � ki Xi
Y 1 i y y i
i � µ
� � � i y y i
i ss µˆ
�ˆ �
Y is different. As there are no coefficients in the model, there is no estimation related to the model, and there is nothing to base interpretation of the model upon. Kozak (2004) showed how to inter-pret the multiplicative model similarly to linear models, and proposed a form of so-called direct effects of components on yield. The effect θi of the
ith component X
i, i = 1, ..., k, on yield Y is:
(2)
where:
µyi is the population mean of the variable
and σi and σy are the population standard deviations of ith component and yield (Y), respectively
The biased estimator of the parameter (2) has the form:
(3)
where: µyi is the sample mean of Yi and si and sy are the sample standard deviations of Xiand Y, respectively
The estimator θi assesses the effect of ith compo-nent on yield. The parameter θi, as well as its esti-mator, is quite similar to the direct effect from path analysis (Kang and Seneta 1980), where the direct effect represents a change in the response variable (in standard deviation units) following a standard deviation unit increase in the ith independent vari-able, when the other independent variables are held constant. The coefficient in Eq. (2) has this property but it estimates an expected (mean) value of this change, because unlike in linear models this change is not constant for various Xs; this is very important and has to be stressed.
When different analyses are to be compared, recall that (i) determination of a response variable in all analyses is complete and (ii) direct effects describe a quantitative change in the response variable. Then it makes no sense to compare how components determine their response variable (in all cases, the determination of the response vari-ables by their components is the same and equals 100%); instead, the pattern of this determination should be studied in order to resolve which com-ponent has a greater direct effect. Moreover, if two equivalent effects from various analyses are different in magnitude, it means that the compo-nent (for which this effect is estimated) causes different changes in the response variable. Thus, although the response variable in the two studies to be compared (e.g. grain yield of two winter-triticale cultivars) is completely determined (100%) by its components (HI and biomass yield), it can
�
� �� kj j i j
i X
Y 1,
i
y
�ˆ
i
react to a change in components differently in these studies.
The proposed method versus other methods
For a general discussion on yield component analysis, refer to Kozak and Mądry (2006). To fa-cilitate understanding of the proposed method, we provide here some insight into the methodology and present a theoretical comparison of the method with two other approaches for NYCA, viz. path analysis and Piepho’s method (Piepho 1995).
The comparison of estimation using the proposed method with path analysis (so with a linear model) was presented by Kozak (2004). The linear model can sometimes well approximate the model (1). The determination coefficient of the linear model can be higher than 95%, and may be even close to 100%. In such situations, the use of the linear model is permissible. However, as Kozak (2004) proved via simulation studies and as it will also be shown in this paper using real data, sometimes such an approximation may be poor. This is because no proof exists that the linear model would work well for the multiplicative model (1). In addition, the error term in the linear model is a result only of this approximation.
Piepho (1995) proposed a NYCA method based on a logarithmic transformation of the model (1); in this method, the coefficients based on decom-position of the variance of logY into terms of co-variances between logY and log Xs are calculated. Piepho’s method and the proposed method are similar as they both take into account the mul-tiplicative form of the relationship. The main difference is that Piepho’s method applies loga-rithmic transformation, the use of which may be debatable (Kozak 2004, Kozak and Mądry 2006); it is well known that interpretation of an analysis based on transformed variables should be linked to the transformed variables, but not directly to the original variables. The interpretation in the proposed method is very easy to understand since it is based on similar principles as the interpretation in path analysis for linear systems, and it is done for original variables. Note that Kozak et al. (2006) proposed a different approach to analyze a similar system to that of Piepho (i.e., the system in which one variable is a sum of some other variables and there is no error term; in Piepho’s method, these variables were Y and Xs in a log scale). Kozak et al. (2006) showed how to interpret such results similarly to path analysis.
EXAMPLE 1. Winter triticale grain yield as affected by HI and biomass yield
Harvest index is a ratio of grain yield to total aboveground biomass yield (grain plus straw) har-vested at maturity. This index was introduced by Donald (1962) to estimate the proportion of dry matter (assimilated photosynthate) that is channeled to harvestable product, or, in the case of cereals, to grain (Sinclair 1998). Increases in wheat (one of the biological parents of triticale) grain yield around the world are usually associated with increases in HI, whereas increases in biomass production are negli-gible and unrelated to HI (see Paponov et al. 1996, and the citations therein). The amount of nitrogen that a crop can accumulate strongly affects maximum obtainable HI (Sinclair 1998). In addition to delayed leaf senescence and extended duration of the grain- filling period, manipulation of HI in breeding pro-grams is an important strategy for improving grain yield (Atkins 1993). Here, we study a pattern of de-termination of grain yield by its two nonsequential components, viz., biomass yield and HI, to find which of them is a stronger determiner of grain yield.
Material
The data examined here originated from a field experiment conducted at the Chylice Experimental Station of the Warsaw Agricultural University (52°05’N, 20°33’E) in 1997–2001 on a heavy soil with a boulder light loamy texture. The following experimental factors were investigated: two culti-vars (Bogo and Fidelio), two rates of nitrogen at the beginning of spring vegetation (150 and 100 kg/ha), supplementary nitrogen (0 – in four replications, 50 kg/ha at the beginning of stem elongation, GS 31, in two replications, and 50 kg/ha at the end of boot stage, GS 49, in two replications; Zadoks et al. 1974), and two growth regulator treatments (Chloromequat – 3 l/ha and 0 l/ha).
aboveground dry biomass yield (hereafter called biomass yield) were used to determine harvest index (HI) as a quotient of these two traits. The grain yield for each plot is the product of the plot values for HI and biomass yield.
The analyses were conducted using all of the observations from plots and years (16 for each cultivar in each year, i.e. 64 for each cultivar), treating them as a representative sample from the population generated by agronomic (treatments) and environmental (years) conditions. All calcu-lations used in the paper were performed with R language (R Development Core Team 2006).
Results
Means and coefficients of variation for grain yield, biomass yield, and harvest index (HI) for both cultivars of winter triticale are presented in
Table 1. Table 2 represents a correlation matrix of the characters. For both cultivars, grain yield was strongly correlated with harvest index. For cultivar Bogo, a significant but weak correlation between grain and biomass yield was detected; for cultivar Fidelio, the correlation between these components was non-significant. Biomass yield and harvest index were negatively correlated for both cultivars.
Yield component analysis for grain yield of both cultivars is presented in Table 3. It contains the estimators (3) of the effects of components on yield as well as the corresponding estimators from path analysis and Piepho’s method.
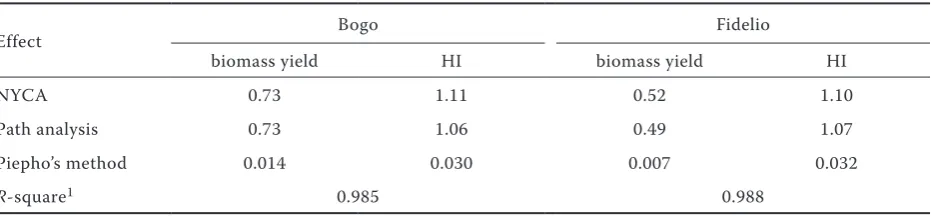
[image:4.595.63.534.92.164.2]As the proposed method revealed for Bogo, both components clearly influenced grain yield (Table 3). The effect of HI on grain yield was larger than that of biomass yield. For Fidelio,grain yield was affected by both components (Table 3); the effect of biomass yield on grain yield was, Table 1. Means and coefficients of variation for grain yield, biomass yield, and harvest index for two cultivars of winter triticale – Example 1
Cultivar Grain yield g/m2 Biomass yield g/m2 Harvest Index (HI)
MV CV (%) MV CV (%) MV CV (%)
Bogo 604.6 16 1557.7 12 0.39 18
Fidelio 622.5 16 1574.3 8 0.40 18
[image:4.595.63.531.218.290.2]MV – mean value; CV – coefficient of variation
Table 2. Correlation matrices between studied characters for two cultivars of winter triticale – Example 1
Bogo Fidelio
grain yield biomass yield grain yield biomass yield
Biomass yield 0.270* 1 0.089 1
HI 0.743** –0.434* 0.884** –0.376*
[image:4.595.66.532.636.744.2]*, ** significant at 0.05 and 0.01 probability level, respectively
Table 3. Yield component analysis for grain yield and its components (biomass yield and harvest index) for two cultivars of winter triticale using three approaches – Example 1
Effect Bogo Fidelio
biomass yield HI biomass yield HI
NYCA 0.73 1.11 0.52 1.10
Path analysis 0.73 1.06 0.49 1.07
Piepho’s method 0.014 0.030 0.007 0.032
R-square1 0.985 0.988
however, smaller than that for Bogo, whereas the effect of harvest index on yield was similar to that for Bogo.
The determination coefficient in path analysis was greater than 98% for both cultivars so the approximation of the yield component model (1) with the linear model was very good (just 2% of yield determination was lost because of the ap-proximation error). Path coefficients, which reflect corresponding direct effects, were very similar to the effects estimated using the proposed method. The results of Piepho’s approach were similar to those of the proposed method as well as of path analysis (note that these results are of a different scale, so the results of different methods have to be compared relatively).
Finally, one can conclude that there were no meaningful differences between the results and in-terpretation provided by the three methods, i.e. the proposed method, path analysis, and Piepho’s ap-proach (Piepho 1995). In the next example, how-ever, we show that this is not always the case.
EXAMPLE 2. Winter triticale N uptake as affected by N-uptake efficiency and crop N supply
Nitrogen-uptake efficiency (Nupe) is defined as a quotient of plant N uptake (Nupt) and crop total N supply (fertilizer plus soil mineral N), Nsup. The amount of N efficiently taken up by the crop is determined by cultivar characteristics (i.e. root system, senescence time, and resistance to drought) and the amount of N coming from fertilizers and soil mineral N. The true plant N uptake is also, to a large extent, modified by weather conditions (Tremblay and Bélec 2006). Regarding genotype characteristics, Noulas (2002) stated that root system at anthesis played an important role in N-uptake efficiency because peculiarities in the growth of the system were observed. It may mean that each genotype has its intrinsic N-uptake capac-ity at similar crop mass. As suggested by Neumann (2005), further work on genetic regulation of roots might lead to the development of crops possessing larger capacity to maintain root growth under water deficit conditions and better capacity to take up and metabolize nutrients. Considering N supply, Ehdaie and Waines (2001) indicated that a further improvement in N uptake and partitioning should be undertaken in wheat under low N input. Data presented by Le Gouis et al. (2000) show that the genotype × N interaction for N-uptake efficiency
explained most of the variation attributed to the interaction for grain yield.
Investigations done on small grains by Fotyma (1997) demonstrated that under Polish condi-tions, wheat and triticale had the highest nitro-gen utilization. Since 1997, Polish dwarf triticale cultivars have been introduced due to their high-yield potential, inter alia. However, the differences between traditional and dwarf triticale cultivars in nitrogen-efficiency indicators, including N-up-take efficiency, have not been widely researched. As reported by Lemaire et al. (2004), a breeding program for high N-uptake efficiency under low N availability conditions is a relevant objective for extensive cropping systems in which the use of N fertilizer is too expensive or in which envi-ronmental risks arise.
As already mentioned, plant N uptake is defined by a multiplicative model with two components, N-uptake efficiency and crop total N supply. Therefore, the yield component analysis meth-odology might be applied to study the influence of these two traits on plant N uptake, because of the identical representation of both models (yield versus its components, and plant N uptake versus N-uptake efficiency and crop total N supply). Below, we present the application of the proposed yield component analysis methodology for two winter triticale cultivars, Bogo (a traditional cul-tivar) and Fidelio (a dwarf culcul-tivar).
Material
The data analyzed here came from a field ex-periment conducted at the Chylice Exex-perimental Station in 2000 and 2003 on a heavy soil with a boulder light loamy texture. The experimen-tal design was a randomized complete block in a split-plot arrangement with four replications within a year. Fifteen winter triticale genotypes were the main plots, and 3 nitrogen rates, i.e. 0, 80 (45 + 35), and 170 (100 + 70) kg/ha, were the subplots. For the purpose of this paper, only data related to two morphologically different cultivars, Fidelio and Bogo, were considered.
of nitrogen coming from fertilizer and soil mineral nitrogen (both ammonium and nitrate forms) in a soil layer of 0–90 cm depth, determined calori-metrically in the early spring before crop growth begins. We did not take into account N possibly available later in the season or N losses at the same time. As in the previous example, the analyses were conducted using all of the observations from plots and years, using R language (R Development Core Team 2006).
Results
Means and coefficients of variation for plant N uptake, N-uptake efficiency and crop total N supply for both winter triticale cultivars are presented in Table 4. Table 5 contains a
correla-tion matrix of the traits. For Bogo, plant N uptake was negatively correlated with N-uptake efficiency and strongly positively correlated with crop total N supply. In addition, N-uptake efficiency and crop total N supply were strongly negatively cor-related. For Fidelio, only a negative correlation between plant N uptake and N-uptake efficiency was significant.
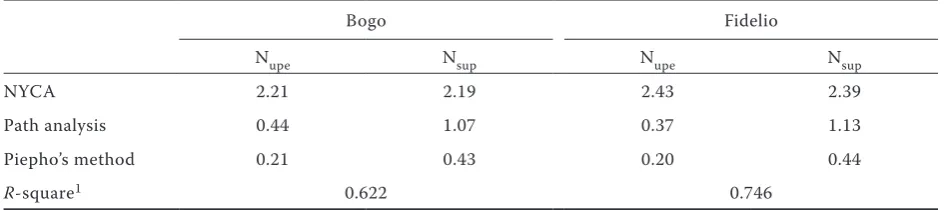
[image:6.595.63.533.91.163.2]The results of the three studied methods to analyze plant N uptake as affected by its two component traits, N-uptake efficiency and crop total N supply, are presented in Table 6. As the proposed method revealed, for both cultivars, both component traits had a large positive ef-fect on plant N uptake. Note that path analysis provided very different results (Table 3). In path analysis for Bogo, both component traits directly influenced plant N uptake positively, although the Table 4. Means and coefficients of variation for N uptake, N uptake efficiency and crop total N supply for two cultivars of winter triticale – Example 2
Cultivar Nupt Nupe Nsup
MV CV (%) MV CV (%) MV CV (%)
Bogo 143.5 31 1.32 54 137.9 53
Fidelio 139.3 28 1.28 53 140.2 53
[image:6.595.63.533.222.295.2]MV – mean value; CV – coefficient of variation
Table 5. Correlation matrices between studied characters for two cultivars of winter triticale – Example 2
Bogo Fidelio
Nupt Nupe Nupt Nupe
Nupe –0.370* 1 –0.529** 1
Nsup 0.735** –0.757** 0.235 –0.136
*, ** significant at 0.05 and 0.01 probability level, respectively
Table 6. Analysis of plant N uptake (Nupt) and its components (nitrogen uptake efficiency, Nupe; and crop total N supply, Nsup) for two cultivars using three approaches – Example 2
Bogo Fidelio
Nupe Nsup Nupe Nsup
NYCA 2.21 2.19 2.43 2.39
Path analysis 0.44 1.07 0.37 1.13
Piepho’s method 0.21 0.43 0.20 0.44
R-square1 0.622 0.746
[image:6.595.62.537.632.737.2]path coefficient for crop total N supply was no-ticeably greater than that for N-uptake efficiency. This result is opposite to that obtained using the proposed method. Very similar results of path analysis were obtained for Fidelio.
Piepho’s approach (Piepho 1995) provided results that were somewhat similar to those of path analysis. The effect of crop total N supply was about two times higher than that of N-uptake efficiency, which is, again, similar to the result provided by path analysis, but is far different from the result provided by the proposed method. Therefore, we may conclude that in this example the proposed method provided a different pattern of affecting plant N uptake by N-uptake efficiency and crop total N supply.
DISCUSSION
In this paper, we have presented application possibilities of the method proposed by Kozak (2004). The coefficients studied in this paper are useful only in studying effects of nonsequential multiplicative components on yield (Kozak 2004, Kozak and Mądry 2006), and should not be consid-ered in other applications. Following the discus-sion presented in the paper by Kozak and Mądry (2006), the method is appropriate if the product of the components gives the yield value for all sample units. This is obtained when values of one of the traits are calculated based on the values of the other traits; see Kozak and Mądry (2006) for a broader discussion on this topic.
As previously discussed (e.g. Sparnaaij and Bos 1993, Piepho 1995, Kozak 2004, Kozak and Mądry 2006), the linear model (path analysis) is not correct for yield component analysis. We have shown that our methodology may provide similar results to those from path analysis; in such case, the determination coefficient in path analysis would be close to 100%. However, it is also possible to obtain very different results, providing different interpretations, as was the case in example 2. Such a situation may occur mostly under great variation in component traits (Kozak 2004); then, the determination coefficient in path analysis would be too low to be acceptable. In addition, we have shown that Piepho’s (1995) ap-proach may provide different results from those of the proposed method, mostly because the former, although it takes into account the multiplicative form of the relationship studied (1), operates on log-transformed variables, which is known to mix up interpretation from many analyses.
In summary, the theory shows that the proposed method is better than the other methods because: (1) it takes the multiplicative model into account – path analysis does not do that; and (2) has no transformation so the interpretation is based on original variables (components) – Piepho’s method uses a logarithmic transformation so the inter-pretation refers to the transformed variables. For these reasons, the method proposed in this paper is recommended for application to nonsequential yield component analysis. However, if one obtains a linear (path) model with a good approximation of the component model (1), path model may be applied; we have proven that in such instances the latter provides similar results to those of the proposed method. However, if this approximation is unacceptable, for example, the coefficient of determination is lower than 90%, path analysis should not be applied. Interestingly, the results of Piepho’s approach usually provide similar inter-pretation as path analysis so these remarks also apply to Piepho’s method.
Note that we have shown that yield component model may be applied not only to the traits that are commonly called yield components, but also to other traits that follow the component model (1), such as plant N uptake and its two compo-nents, N-uptake efficiency and crop total N supply. Thus, this method, and in general, nonsequential yield component analysis, may have quite many interesting applications in agronomy and crop science.
Further studies should be concentrated on de-velopment of the method, for example, to find a way of estimating not only direct, but also indi-rect effects. This may be difficult because of the nonlinear nature of the relationship.
REFERENCES
Atkins C.A. (1993): Nitrogen assimilation and translo-cation in relation to plant growth. In: Buxton D.R., Shibles R., Forsberg R.A., Blad B.L., Asay K.H., Paulser G.M., Wilson R.F. (eds.): International Crop Science I. Crop Science Society of America, Madison, Wiscon-sin, USA: 807–811.
Concon J.M., Soltess D. (1973): Rapid micro Kjeldahl digestion of cereal grains and other biological materi-als. Anal. Biochem., 53: 35–41.
Dofing S.M., Knight C.W. (1992): Alternative model for path analysis of small-grain yield. Crop Sci., 32: 487–489.
Donald C.M. (1962): In search of yield. J. Aust. Inst. Agr. Sci., 28: 171–178.
Ehdaie B., Waines J.G. (2001): Sowing date and nitrogen rate effects on dry matter and nitrogen partitioning in bread and durum wheat. Field Crop. Res., 73: 47–61. Fotyma E. (1997): The efficiency of nitrogen fertiliza-tion of some arable crops. Fragmenta Agron. XIV, 1: 46–66. (In Polish)
García del Moral L.F., Rharrabti Y., Villegas D., Royo C. (2003): Evaluation of grain yield and its components in durum wheat under Mediterranean conditions: An ontogenetic approach. Agron. J., 95: 266–274. Kang K.M., Seneta E. (1980): Path analysis: An
expo-sition. In: Krishnaiah P.R. (eds.): Developments in Statistics 3. Academic Press, NY, USA: 217–245. Kozak M. (2004): New concept of yield component
analysis. Biometrical Lett., 41: 59–69.
Kozak M., Gozdowski D., Wyszyński Z. (2006): An ap-proach to analyzing a response variable as affected by its additive components: Example for spring barley grain yield. Cereal Res. Commun., 34: 981–988. Kozak M., Mądry W. (2006): Note on yield component
analysis. Cereal Res. Commun., 34: 933–940. Le Gouis J., Béghin D., Heumez E., Pluchard P. (2000):
Genetic differences for nitrogen uptake and nitrogen utilisation efficiencies in winter wheat. Eur. J. Agron., 12: 163–173.
Lemaire G., Recous S., Mary B. (2004): Managing resi-dues and nitrogen in intensive cropping systems. New understanding for efficient recovery by crops. In: Proc. 4th Int. Crop Sci. Congr., Brisbane, Australia.
McArthur D.A.J, Eaton G.W. (1988): Strawberry yield response to fertilizer, paclobutrazol and chlormequat. Sci. Hortic., 34: 33–45.
Neumann P.M. (2005): Nutrient uptake efficiency at the soil-root interface: Interactions with water stress. The International Fertilizer Society – Proceeding 567, UK.
Noulas C. (2002): Parameters of nitrogen use effi-ciency of Swiss spring wheat genotypes (Triticum aestivum L.). [Ph.D. Thesis.] University of Zurich, Switzerland.
Paponov I., Aufhammer W., Kaul H.P., Ehmele F.P. (1996): Nitrogen efficiency components of winter cereals. Eur. J. Agron., 5: 115–124.
Piepho H.P. (1995): A simple procedure for yield com-ponent analysis. Euphytica, 84: 43–48.
Pieskovski G. (2005): Breeding progress and nitrogen uptake and utilization by winter wheat (Triticum aestivum ssp. vulgare) genotypes in Poland. [Ph.D. Thesis.] Warsaw Agricultural University, Poland. (In Polish)
R Development Core Team (2006): R: A Language and Environment for Statistical Computing. R Foundation for Statistical Computing, Vienna, Austria. Available at: http://www.R-project.org
Sinclair T.R. (1998): Historical changes in harvest in-dex and crop nitrogen accumulation. Crop Sci., 38: 638–643.
Sparnaaij L.D., Bos I. (1993): Component analysis of complex characters in plant breeding. I. Proposed method for quantifying the relative contribution of individual components to variation of the complex character. Euphytica, 70: 225–235.
Tremblay N., Bélec C. (2006): Adapting nitrogen fer-tilization to unpredictable seasonal conditions with the least impact on the environment. Horttechnol-ogy, 16: 408–412.
Zadoks J.C., Chang T.T., Konzak G.F. (1974): A deci-mal code for growth stages of cereals. Weed Res., 14: 415–421.
Received on June 8, 2007
Corresponding author:
Dr. Ing. Marcin Kozak, Ph.D., Warsaw Agricultural University, Department of Biometry, Nowoursynowska 159, 02-776 Warsaw, Poland
I
NSTITUTE OF AGRICULTURAL AND FOOD INFORMATION
Slezská 7, 120 56 Prague 2, Czech Republic
Tel.: + 420 227 010 111, Fax: + 420 227 010 116, E-mail: [email protected]
In this institute scientific journals dealing with the problems of agriculture and related sciences are published on behalf of the Czech Academy of Agricultural Sciences. The periodicals are published in English.
Number Yearly subscription Journal of issues per year in USD
Plant, Soil and Environment 12 285
Czech Journal of Animal Science (Živočišná výroba) 12 285
Agricultural Economics (Zemědělská ekonomika) 12 285
Journal of Forest Science 12 285
Veterinární medicína (Veterinary Medicine – Czech) 12 285
Czech Journal of Food Sciences 6 150
Plant Protection Science 4 85
Czech Journal of Genetics and Plant Breeding 4 85
Horticultural Science (Zahradnictví) 4 85
Research in Agricultural Engineering 4 85
Soil and Water Research 4 85