The modern viniculture in the czech republic has been influenced especially by the changed wine law in 1995 (and its later revisions) and by the privatiza-tion of companies. The most important stimulator
of the increasing consumption of domestic wine was the increasing quality of the wines enabled by the improvement of agricultural technology and wine cultivation and big investments into the modern
The development of main factors of the wine demand
Vybrané ukazatele vývoje poptávky po vínu
H. Chládková, P. Tomšík, S. Gurská
Faculty of Business and Economics,
Mendel University of Agriculture
and Forestry, Brno, Czech Republic
Abstract: The paper identifies and analyses the main factors which influenced the wine demand. The average annual wine consumption per capita is the basic factor of the wine demand.The average annual wine consumption, one of the wine demand factors, grew between 2003 and 2007 from 16.3 l to 18.5 l per capita. Following this trend, we can expect the avera-ge annual wine consumption 19.0 l per capita in year 2010. A positive feature of this development is also the fact, that there grows the demand after the quality wines. At the same time, there grows also the consumption of the lower quality, cheap wines packed in boxes or PET bottles. A continuously growing tendency can be also noticed in the red-wine consumption. This change of consumer preferences has significantly influenced the growth of the share of the red varieties in the new-planted vineyards. however, there are critical factors in the development of the demand for wine demand here. Specifically, it is the daily feasible ration of alcohol in wine and other alcoholic drinks, especially beer that we can treat as the substi-tute of wine. The average annual beer consumption moves about 160 l per capita in the czech republic. The continuously growing tendency of wine consumption is reduced by the lower price of beer too, because beer is the cheapest alcoholic drink in the czech republic. The taste and preferences of consumers have been changing, that means, that the consumers are the ones who decide about the wine quality, and not producers. That is why this paper includes the partial results of the research oriented on the habits and behaviour of consumers in the wine market in the czech republic. it is concentrated on the wine sellers opinions on demand development in the wine market.
Key words: wine, wine production, wine demand, wine consumption, consumer preferences
Abstrakt: Příspěvek identifikuje a analyzuje hlavní ukazatele, které ovlivňují vývoj poptávky po vínu. základním ukazatelem poptávky po vínu je jeho průměrná roční spotřeba vína na jednoho obyvatele. Přitom v roce 2003 sespotřeba pohybovala kolem 16,3 l a podle údajů Českého statistického úřadu se zvýšila v roce 2007 na 18,5 l. Také do budoucna je očekáván nárůst spotřeby na cca 19,0 l v roce 2010. Pozitivní na tomto vývoji je také to, že se zvyšuje poptávka po kvalitních vínech. zároveň také roste spotřeba méně kvalitních, levných vín balených v krabicích, či PET lahvích. Stále rostoucí tendenci rov-něž vykazuje spotřeba červeného vína. Tato změna v preferencích spotřebitelů výrazně ovlivnila zvyšování podílu modrých odrůd při nových výsadbách vinic. Mezi další faktory ovlivňující spotřebu (poptávku) vína patří také spotřeba ostatních alkoholických nápojů, a to především piva, které vystupuje na trhu vína v roli substitutu a jehož spotřeba v Čr se pohy-buje kolem 160 l na osobu a rok. negativně na nárůst spotřeby vína působí i ceny alkoholických nápojů, neboť nejlevnější alkohol je možné koupit opět ve formě piva. Vzhledem k tomu, že se mění chutě a preference spotřebitelů a o kvalitě vína nerozhoduje vinař, ale spotřebitel, obsahuje příspěvek také dílčí výsledky průzkumu orientovaného na zvyklosti a chování spotřebitelů na trhu vína v Čr, včetně názorů obchodníků s vínem na vývoj poptávky.
Klíčová slova: víno, produkce vína, poptávka po vínu, spotřeba vína, preference spotřebitelů
technological equipment of manufacturing capacities. The increasing consumption has also been supported by the growth of knowledge of consumers thanks to a number of books and other literature titles being published and accessible for the public, together with the TV series about wine, its character and origin.
The popularity of wine was increased by wine tour-ism and special programs focused on the presentation of wine areas and variety wines with the authentic and clear origin. Last but not least, the popularity of wine was also influenced by the health recommenda-tion of physicians.
The growing interest in domestic wines is connected with the increasing area of vineyards. With a signifi-cant support of the state, their area increased from 12 000 hectares in 1989 to 19 000 hectares in 2004 (the entrance of the cr into the EU). A vast majority of vineyards (96 %) is set up in South Moravia, the South-Eastern part of the czech republic. Except the area of czech vineyards, also the variety com-position changed towards the production of quality wines, which are characterized – except their good taste characteristics – also with a higher content of healthy substances.
in recent years, there have been many research-ers who focused on wine production and wine con-sumption in the czech republic, e.g. chládková et al. (2004); chládková (2005); Tomšík, chládková (2005); Tomšík et al. (2006); Tomšík (2006); Pyšný et al. (2007); Kučerová (2005).
MATeriAl And MeThods
The subject of the analysis is the demand for wine in the czech republic. it is analyzed based on sec-ondary information useful for the characteristics of the demand development in the wine market in the czech republic, which were published by czech Statistical office, Ministry of Agriculture of czech republic and the Wine Fund of the czech republic. The development of demand is expressed in the form of the average annual consumption of wine per capita in litters, and its progress is evaluated also in com-parison with the development of the demand in wine markets in the EU countries, product price in the czech republic and considering the importance of beer as a possible important substitute.
There are also particular results of the primary research presented in the paper, which provide the selected information about the market according to wine sellers. The paper should answer the ques-tions if our domestic producers are – according to the opinion of sellers – able to react to the changes
in demand and also how the demand for wine will develop in the future. The input information for realizing this goal were primary data gained from 99 owners (or employees) of wine shops and of 44 employees of supermarkets or hypermarkets, who work at the wine shop departments. The whole set of respondents was structured based on the geographi-cal point of view.
resulTs And discussion
The European Union has more than 2.4 million wine companies, which farm on 3.6 million hectares (a small part of this are also czech wine companies, which farm on 19 646 hectares, which represent 0.5% of area of European Union). About 15 million inhab-itants of the European Union work in viniculture. in the year 2006, the wine production represented 5% of agricultural production in the EU, but the con-sumption has been generally decreasing in the EU. on the contrary in the czech republic, there is an opposite trend, the consumption has been slightly increasing, together with the growing sales of quality wines. it is necessary to mention that to the quality of wine in the czech republic reflects the progres-sive change of legislation after the year 1989, which was anchored in the Act no. 321/2004 on viniculture and the changes of some related laws. According to the current trends in the EU, 15% surplus-produc-tion of wine is expected in the year 2010/11, on the exoneration of which, about one half of billion Euro will be spent in the EU, if there does not appear any discontinuous influence. The czech republic imports more than one half of its wine consumption.
There is about one half of world wine area in the EU, where the major part of the world production is produced. The long-term development is docu-mented by the decreasing wine area and decreasing wine consumption and export. in the last 20 years, the European share in the world wine production fell from 78 % to 68%. on the contrary, the biggest increase of production was noticed in Asia – from 1.5% to 5.1%.
its popularity and consumption have been growing. it is documented for example by the development in Spain and Argentina, where the consumption fell to one third, in France, italy and Portugal to about one half of its previous level. in Austria and germany, the consumption is quite stable and in the czech republic, Belgium, netherlands, Denmark and England it has been increasing.
situation in the czech republic
in the czech republic, the actual vineyard area was17 418.68 hectares, where 34% of the area were set with blue stum varieties, 66% with white stum varieties and 1% with table and stock varieties. As regards the vineyard structure in the czech republic according to the area and number of producers, it is possible to say that 42% from the whole amount of producers farm on the area up to 0.1 hectare. nevertheless, the total of these small vineyards was just 4% of the total vineyard area, while the produc-ers with vineyards over 5 hectares farmed on 46% of vineyards in the czech republic.
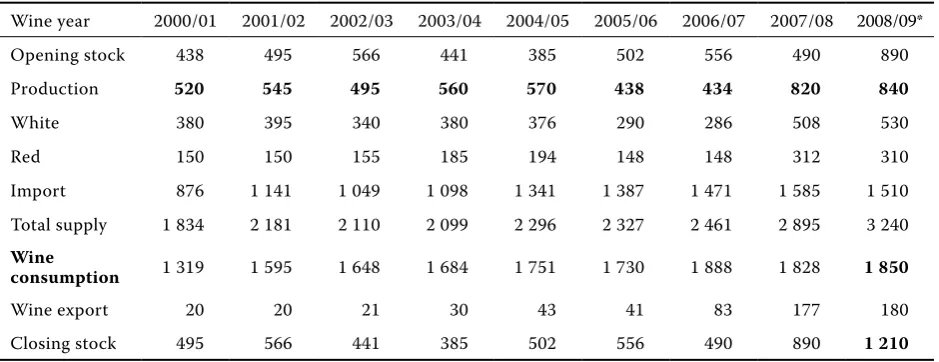
Table 1 documents the total supply and consump-tion in the wine years 2000/01 to 2008/09 in thousand hectolitres. The production grew by 61.5% in com-parison to the years 2000/2001 and 2008/09. import also increased by 72.4%. By contrast, the consumption increased in the same period by 40.3%.
As documented in the Table 2, the consumption of grapes and wine in czech republic has an increasing trend. The consumption of wine in the year 2000 was around 16.1 litters per capita, in the year 2007, it was already 18.5 litters per capita. in the future, there is expected a growth of consumption of grapes and also of wine.
The average consumer price of grapes was rapidly varying from the year 2000 to 2008. The highest price was in the year 2001, 82.03 czK per kilogram. in the period of 2000–2006, the price was gradually decreasing and in the year 2006, there was the lowest price, 55.50 czK per kilogram. in 2008, the average consumer price of grapes was 58.79 czK per kilogram. The fall of consumer prices probably influenced the increase of consumption in an essential way.
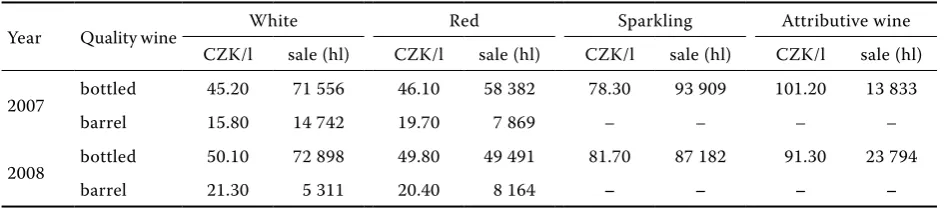
[image:3.595.64.534.417.598.2]Average prices of industry producers of table and quality wine are documented in Table 3 and 4. The
Table 1. Balance of wine in the wine years 2000 to 2009 (in thousand hectolitters)
Wine year 2000/01 2001/02 2002/03 2003/04 2004/05 2005/06 2006/07 2007/08 2008/09*
opening stock 438 495 566 441 385 502 556 490 890
Production 520 545 495 560 570 438 434 820 840
White 380 395 340 380 376 290 286 508 530
red 150 150 155 185 194 148 148 312 310
import 876 1 141 1 049 1 098 1 341 1 387 1 471 1 585 1 510
Total supply 1 834 2 181 2 110 2 099 2 296 2 327 2 461 2 895 3 240 Wine
consumption 1 319 1 595 1 648 1 684 1 751 1 730 1 888 1 828 1 850
Wine export 20 20 21 30 43 41 83 177 180
closing stock 495 566 441 385 502 556 490 890 1 210
*estimate
Source: Wine Association of the czech republic
Table 2. Development of wine grapes and wine consumption in the years 2000 to 2008
Product 2000 2001 2002 2003 2004 2005 2006 2007 2008*
Table wines
(kg/capita) 2.7 2.9 3.1 3.3 3.5 4.1 4.2 3.9 4.0
Wine total
(liters/inhabitant) 16.1 16.2 16.2 16.3 16.5 16.8 17.2 18.5 18.7
*estimate
[image:3.595.66.536.663.733.2]industry producer price is a price, for which the wine is taken from producing companies, without transpor-tation costs and VAT. From both tables, it issues that red wines, both table and quality, have higher prices than white wines. And then, in the year 2008 there was an increase of the industry producers’ prices of white and red wine, both table and quality. in the case of table bottled wine and the tetra pack,the increase of prices was accompanied with the decrease of the sold amount of red and white wine. on the other hand, in the case of barrel wine, there was a decrease of prices, but still there was also a considerable decrease of she sold amount of red and white wine.
in the case of the bottled white quality wine, the increase of the price by 4.90 czK per litter did not mean the fall of the sold amount, on the contrary, it was connected with its increase by nearly 2%. in the case of the barrel white wine, the increase of price by 5.50 czK per litter caused the fall of the sold amount by 64%. The price of bottled red wine increased, which was accompanied by the fall of sold amount by 16.3%. increase of price of sparkling wine was connected with fall of the sold amount by 7.3%. The price of the attributive (higher quality) wine fell by 9.90 czK per litter and the sold amount was increased by 72%.
The opinions of wine shop owners and the own-ers of super- and hypermarkets on the development of wine demand (selected results of survey) are as follows:
Figure 1 documents the opinion of the respondents on the development of wine demand in the czech republic to the year 2010. 89.9% of respondents from the wine shops and 85.7% from the super- and hyper-markets think that the demand will be higher.
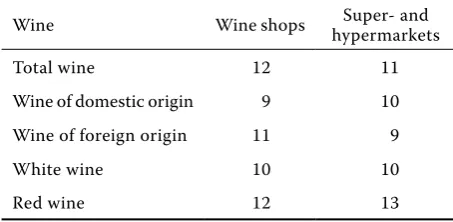
in both groups of respondents, there predominates the opinion that demand in the wine market will grow, and there is expected a growth of both domestic and foreign production. From the answers, it results that in comparison with the end of the year 2003, it is possible to expect the increase of wine demand and consumption in 2010 shown in Table 5.
According to both groups of respondents, the in-crease of the domestic wine demand is sustained i.e. by the advantages or strengths of domestic wines. The most important strengths considered by both groups of respondents include especially a high quality, low price and the specific taste of domestic wines.
[image:4.595.63.537.642.746.2]The development of wine consumption in the czech republic will be influenced by beer consumption, which is a substitute of wine and its consumption and popularity has a long tradition. The total production
Table 4. Average prices of quality wine by industry producers in the years 2007 and 2008
Year Quality wine White red Sparkling Attributive wine
czK/l sale (hl) czK/l sale (hl) czK/l sale (hl) czK/l sale (hl)
2007 bottled 45.20 71 556 46.10 58 382 78.30 93 909 101.20 13 833
barrel 15.80 14 742 19.70 7 869 – – – –
2008 bottled 50.10 72 898 49.80 49 491 81.70 87 182 91.30 23 794
barrel 21.30 5 311 20.40 8 164 – – – –
Source: nTiS SziF and own calculations
Table 3. Average prices of table wine by industry producers in the years 2007 and 2008
Year Table wine White red
czK/l sold amount (hl) czK/l sold amount (hl)
2007 bottledbarrel 30.3022.50 8 0332 934 31.1025.8 8 6951 369
tetra pack 15.50 19 503 16.10 15 830
2008
bottled 32.60 6 063 33.40 6 583
barrel 18.20 512 18.80 207
tetra pack 18.80 12 520 19.50 9 845
of beer in the czech republic was 19 806 107 hl in 2008, which is by 0.5 less than in the year 2007, but we have to realize, that beer production in 2007 was the biggest total production in history.
There were consumed 16 100 154 hectolitres of beer in the year 2008, which is by 1.3% less than in 2007. nevertheless, the czech republic is in the long term in the front place of the amount of consumed beer per capita. Every czech annually drinks approximately 160 litters of beer. in the year 2005, there was reached the maximum, when the per capita consumption was 163.5 litters of beer, next year it was followed by the fall to 159.1 litters. it is estimated that 15 to 20% of the share belongs to foreign tourists.
The czech republic is the 16th biggest producer of beer in the world (by the year 2007) with the an-nual total production of beer around 19 900 million hectolitres, and the 9th biggest world exporter of beer with a sustained growth. it is supposed that by the year 2012, it will be on the 7th place. The most sold
brand of beer in the czech republic is gambrinus, second place belongs to radegast and third place to Staropramen. As regards the price development, the beer price was rapidly increasing in the nineties of 20th century. in the time of communism, the average price was in the long term almost unchanged except for two enhancements. The first was in 1965, when the price increased from 1.70 czK to 2.50 czK per bottle (0.5 litter). The next gradual rise in prices came in the years 1992 to 2003, when the price got to around 8.60 czK per bottle. in the following years, there was a moderate fall of price to the lowest price in the year 2006. At this time, beer costed 8.40 czK per bottle. As regards the current prices of beer, the biggest brewing group in the country – Plzeňský Prazdroj (Pilsner Urquell) – increased the prices of their brands since november 2007 in average by 5–7%. “To keep the price on the current level means for each brewery a shift from quality, our current rise of price covered just 2/3 of the increase of raw material prices,” claimed the speaker of Prazdroj Jiří Mareček. Prazdroj according to his speech does not deny a possible rise of price in the year 2008. The price of a bottle of Pilsner Urquell increased by 1 czK to 18.90 czK and the most sold czech beer – gambrinus – marked up by 70 heller to 12.20 czK.
conclusion
[image:5.595.130.496.67.265.2]in the year 2008, there was a decrease of the world wine consumption by 0.8 % to 243 million hectoli-tres in opposite to 245 million hectolihectoli-tres in 2007. According to the speech of the general director of the
Figure 1. Estimation of wine demand development in the year 2010 Source: own work
wine shops
89,90%
3,80%
6,30%
higher lower same
super and hypermarkets
85,70%
7,20%
7,10%
higher lower same
7.20% 7.10%
85.70%
wine shops
89,90%
3,80%
6,30%
higher lower same
super and hypermarkets
85,70%
7,20%
7,10%
higher lower same
6.30%3.80%
89.90%
wine shops
89,90%
3,80%
6,30%
higher lower same
super and hypermarkets
85,70%
7,20%
7,10%
higher lower same
higher lower sameWine shop super and hypermarkets
Table 5. The expected increase of demand in 2010 (%)
Wine Wine shops hypermarketsSuper- and
Total wine 12 11
Wine of domestic origin 9 10 Wine of foreign origin 11 9
White wine 10 10
red wine 12 13
[image:5.595.63.290.637.748.2]international organization of Vine and Wine (oiV) Federic castellucci the world economic crisis played a role in the decrease of the global wine demand. For this decrease, there is blamed the fall of the demand in the traditional wine countries like France, italy and germany. The situation was saved by the or higher sales of wine in the USA, Australia, canada or Brazil. The world wine production has globally increased. in European countries, the year 2008 was one of the weakest, with the production 161.6 million hectoli-tres. it was caused by the decrease of production in France, which amounted to 4.6 million hectolitres of the total 41.4 million hectolitres, which is the lowest figure since 1991. The USA with total production of 27.3 million hectolitres drew away italy with 26 mil-lion hectolitres for the first time.
The share of the so-called new-World wines, from Argentina, chile, South Africa, Australia, new zeeland and USA (california) increased in the year 2008 in the world scale to practically 30% against the average 23.3% in the years 2001 to 2005. italy continued to be the biggest exporter of wine in volume and France in the value of export.
The basic indicator of demand in the wine market is the annual consumption per capita. Wine is a specific commodity, because wine demand depends on the consumer’s age, education, health status, geographic area, tradition and preferences. The most important factors in connection with wine consumption are the disposable consumers’ income, the product price and the existence and accessibility of substitutes.
reFerences
chládková h. (2005): chování spotřebitelů na trhu vína v Čr (consumer behavior on the czech wine market). Acta Universitatis Agriculturae et Silvicul-turae Mendelianae Brunensis, 52 (6): 175–187.
chládková h., Pošvář z., Žufan P. (2004): consumer habits in the czech wine market. Agricultural Eco-nomics – czech, 50 (9): 323–330.
Kučerová r. (2005): Factors of wine demand in the czech republic and in the neighboring wine coun-tries. Agricultural Economics – czech, 51 (8): 403–410.
Pyšný T., Pošvář z., gurská S. (2007): Analysis of selected demand factors of wine market of the czech republic. Agricultural Economics – czech,
53 (7): 304–311.
Tomšík P. (2006): Adaptation of the czech Viniculture to the conditions of European Union. in: colloque international de la Vineyard Data Quantification Society 2006. Bordeaux, VDQS Paris. Available at www.vdqs.net
Tomšík P. a kol. (2006): Perspektivy vývoje a návrhy opatření politiky vinohradnictví a vinařství a roz-voje venkova v Jihomoravském regionu (Develop-ment perspectives and proposals policy measure for winegrowing and wine-production and rural development in the Southern Moravia region). 1st ed. MzLU, Brno; iSBn 80-7157-971-8.
Tomšík P., chládková h. (2005): comparison of analy-ses of winegrowing and wine-production in the czech republic, EU, and South Africa. Agricultural Economics – czech, 51 (7): 322–328.
Tomšík P., Žufan P., Sedlo J. (2006): Atraktivita odvětví vinohradnictví a vinařství v České republice ve fázi adaptace na jednotný trh Evropské unie (Attractive-ness of czech winegrowing and wine-production in the stage of adaptation to the united market of the European Union). Acta Universitatis Agricul-turae et SilviculAgricul-turae Mendelianae Brunensis, 53
(3): 101–113.
http://www.czso.cz / [Quoted 2009]. http://www.Mze.cz/ [Quoted 2009]. http://www.szif.cz/ [Quoted 2009].
Arrived on 29th May 2009
Contact address
helena chládková, Mendel University of Agriculture and Forestry in Brno, zemědělská 1, 613 00 Brno, czech republic